6-for-6 Midterm Run: Gold (COMEX) (GC) Has Averaged 8.31% Gains in This 127-Day Window
Gold (COMEX) futures are pulling back from record territory just as a historically strong midterm-year fall seasonal window approaches, with ETF inflows and softer Fed expectations adding fuel.
Price as of Sep 1, 2026: $4,484.70 (intraday).

What is the seasonal pattern for Gold (COMEX) (GC)?
Gold (COMEX) has risen in 6 of 6 midterm-election-year Sep 12–Jan 16 windows, with an average gain of 8.31% in winning years.
- 6 for 6 in this window, with Gold (COMEX) averaging 8.31% gains across all six midterm-election-year runs.
- Seasonal window runs from Sep 12 through Jan 16, spanning 127 calendar days in the late part of the midterm election year.
- Percent Profitable is 100%, with 6 winners and 0 losers in the TradeWave lookback sample.
- Median profit of 8.54% and a Sharpe ratio of 2.27 point to unusually consistent upside for a long setup.
- TradeWave Ratio of 2.28 suggests price has typically traveled meaningfully in the trade direction within the window, not just at the close.
- Intraperiod swings have still included notable drawdowns in some years, so the path has not been a straight line higher.
According to historical data from TradeWave.ai, this late-midterm stretch has behaved very differently from an average quarter for gold futures, with a clear directional bias that most traders never see quantified.
How strong is the upcoming seasonal window for Gold (COMEX) (GC)?
Gold (COMEX) has closed higher in every single Sep 12–Jan 16 window across the last six midterm election years, averaging 8.31% gains for long positions. Futures settled Monday at 4,484.30 on the prior session’s close, leaving the contract about 19.7% below its 52-week high of 5,586.20 and still well above the 3,618.40 low of the past year. With that backdrop, the next 127-day window that starts on Sep 12 has historically marked a regime where gold’s role as a macro hedge and election-cycle asset tends to come into sharper focus.
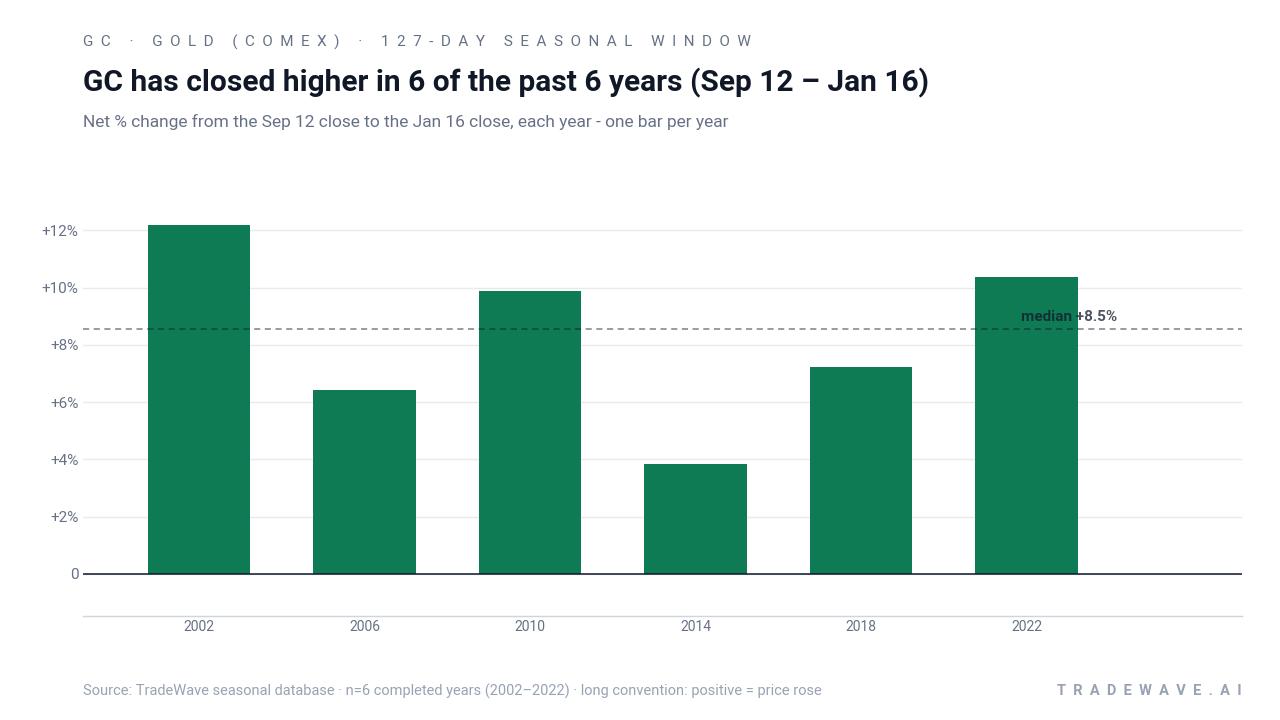
Grouping the data by the presidential election cycle matters here because this window always lands in the late part of a midterm election year, just before the pre-election year that has often been supportive for risk assets and macro hedges. Policy debates over spending, taxes and regulation tend to intensify in this phase, and gold’s historical seasonality in GC futures appears to reflect that recurring backdrop.
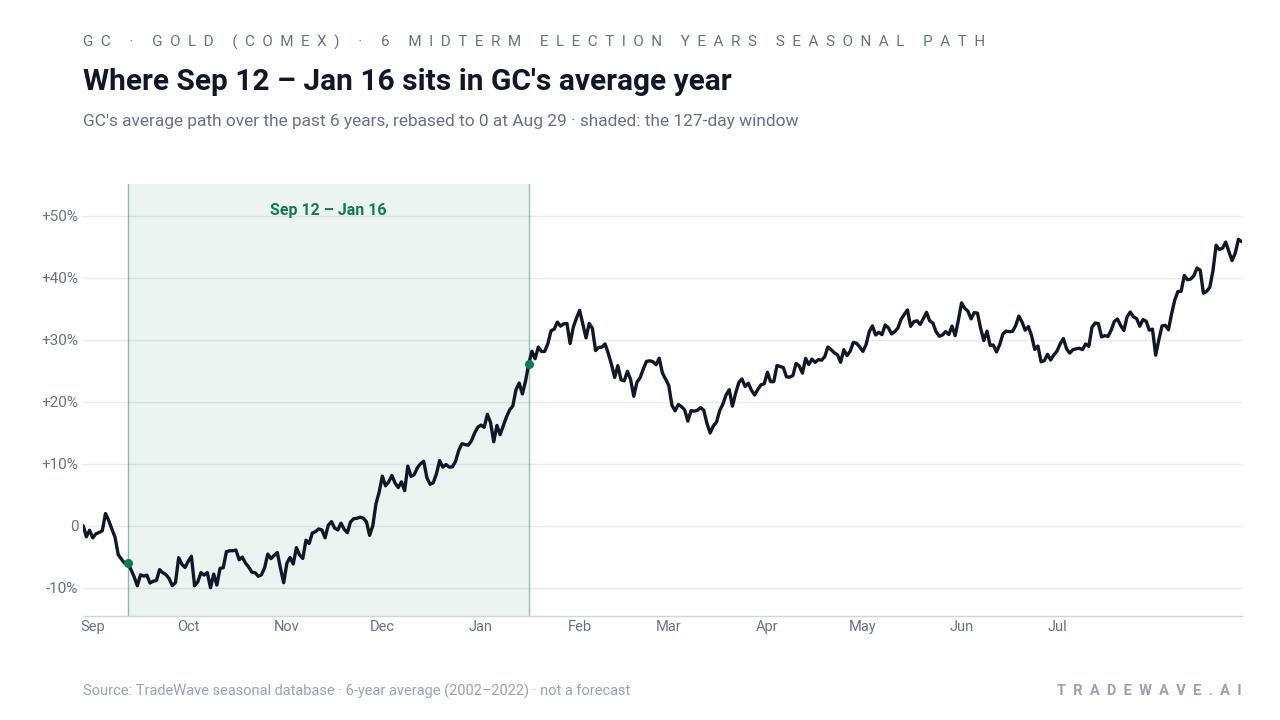
Year-by-year ranges show how much gold has typically swung inside the window before finishing higher.
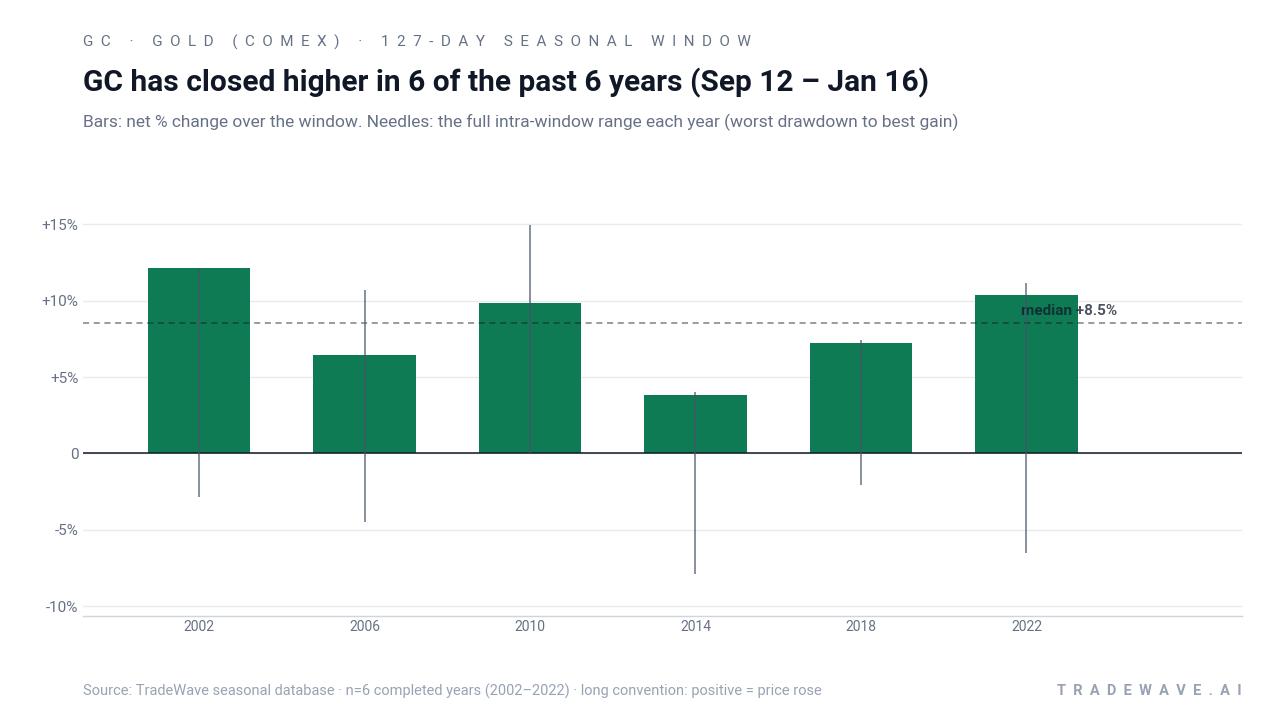
The per-year record shows how consistent that pattern has been. The weakest outcome in the sample was still a 3.82% gain in 2014, a year that also featured the deepest intraperiod drawdown as gold dropped as much as 7.88% below the entry level before recovering by the close. At the other end of the spectrum, 2010 delivered a 9.88% net gain with a maximum favorable move of 14.94% and no meaningful adverse excursion, underscoring how powerful the window can be when macro conditions line up.
Across all six midterm-election-year samples, the cumulative return from repeatedly holding only this 127-day window compounds to roughly 61%, which is unusually strong for a slice of the calendar that covers just over one-third of a year. The Sharpe ratio of 2.27, based on end-of-window outcomes, points to a favorable balance between return and volatility for a long bias. The TradeWave Ratio of 2.28 indicates that price has typically traveled substantially in the trade direction within the window, not just at the final close, which is consistent with the large maximum favorable excursions seen in years like 2010 and 2022.
Intraperiod behavior has not been one-way traffic. Several years show meaningful maximum adverse moves, with drawdowns of roughly 4% to almost 8% from the entry level before the contract finished higher. That profile suggests a window where pullbacks have been part of the playbook even in ultimately positive seasons, and where timing inside the window has mattered for traders trying to lean into the GC seasonal trend.
Put together, the pattern is clear: this 127-day stretch has favored long exposure in 6 of 6 midterm-election-year runs, with solid average gains and enough intraperiod volatility to matter for risk management.
Why does Gold (COMEX) (GC) follow this seasonal pattern?
One likely driver is the way fiscal debates and policy uncertainty tend to ramp up as the midterm election year concludes and markets start to price the coming pre-election year. Analysts have pointed to recurring concerns over deficits, Treasury supply and central-bank policy in this phase, all of which can boost demand for gold as a hedge. The pattern may also reflect institutional portfolio rebalancing and year-end positioning, as investors adjust exposure to inflation hedges and safe-haven assets heading into a new calendar and political year.
History does not guarantee future results; adverse excursions within the window have been large in some years even when the final outcome was positive.
What is driving Gold (COMEX) (GC) today?
Gold (COMEX) futures slipped 0.29% in the prior session to 4,484.30, easing from recent highs but holding well above the 52-week low of 3,618.40 as traders digest a sharp summer rally and shifting rate expectations. The contract remains supported by softer U.S. payroll data that reduced the odds of a September Federal Reserve rate hike, pressuring real yields and underpinning bullion demand.[1] A surprise increase in U.S. Treasury buybacks has also weighed on the dollar and stoked concerns about long-term fiscal credibility, another tailwind for gold as a hedge against debt and currency risk.[2] Morgan Stanley recently noted that gold reached its prior fourth-quarter target ahead of schedule and outlined a path above $5,000 per ounce in 2027, citing fading Fed hike expectations and strong ETF inflows as key supports.[3][4]
The chart below situates the latest pullback against the past year’s rally and a 60-day seasonal projection path.
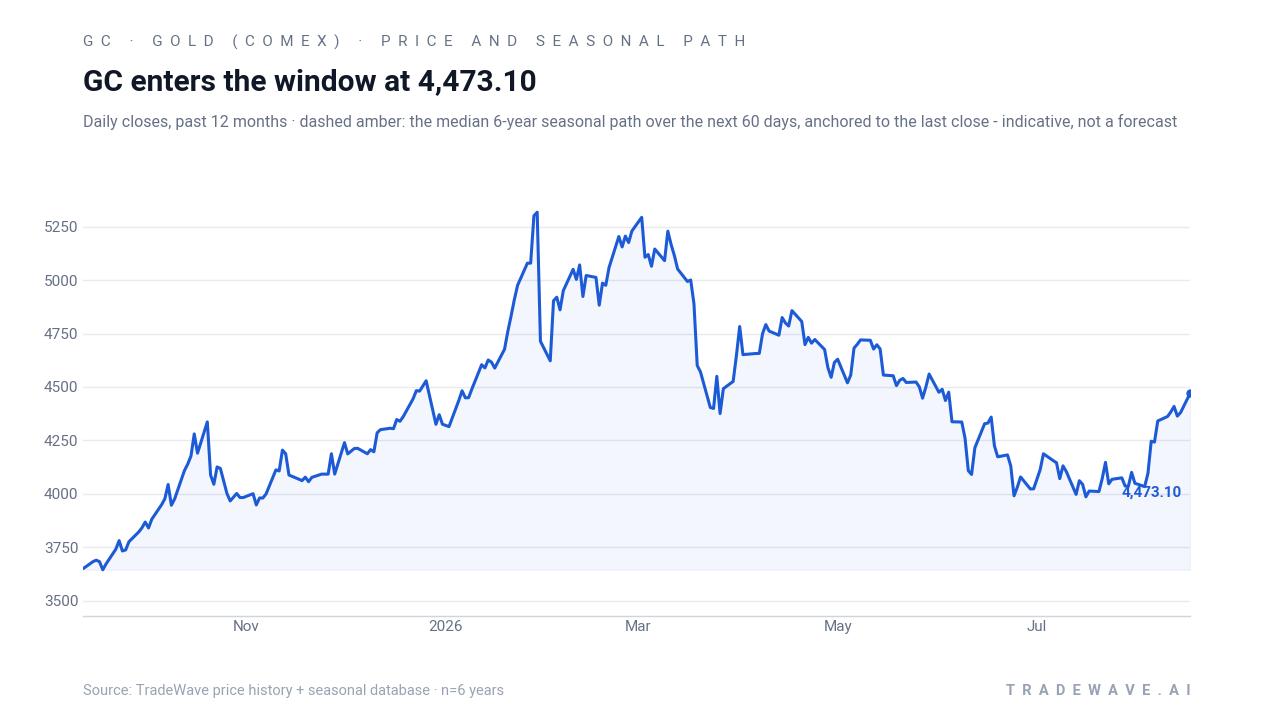
Flows and positioning help explain why this GC seasonal trend matters now. Gold-backed ETFs recently attracted 46.7 metric tons in their biggest weekly inflow in 10 months, part of roughly 70 metric tons added across July and August, signaling renewed institutional and retail interest in paper gold exposure.[2][3] At the same time, COMEX short positioning is near its lowest level since April 2020, which Morgan Stanley has flagged as reducing the fuel available for a classic short-covering squeeze but also indicating that many bears have already stepped aside.[3][6] Against that backdrop, the upcoming Sep 12–Jan 16 window arrives with gold still below its 52-week high yet supported by macro tailwinds, ETF demand and a cleaner positioning slate.
Looking ahead, traders will focus on incoming U.S. inflation data and the next Federal Reserve policy decisions, which remain central to the outlook for real yields and the dollar.[1] Larger Treasury buybacks and ongoing questions about U.S. borrowing needs keep fiscal credibility in play as a driver of safe-haven demand.[2] Sector-wide, continued inflows into gold ETFs and steady central-bank purchases form a constructive backdrop for bullion, even as the market digests a powerful multi-quarter rally.[3]
What should traders watch as this GC seasonal window approaches?
First, the calendar: the 127-day window begins on Sep 12 and runs through Jan 16, covering the final stretch of the midterm election year and the first weeks of the pre-election year. Historically, that has been a sweet spot for long GC exposure in this election-cycle grouping, with 6 winners and no losers in the sample. How gold behaves into and through that start date will show whether the current pullback is just consolidation after a strong run or the start of a deeper reset.
Second, macro catalysts. Upcoming U.S. inflation prints and the Fed’s next policy meetings will shape real yields, which remain the single most important macro input for gold.[1] If softer data keeps rate expectations capped while Treasury financing concerns linger, the historical seasonality could align with a supportive macro backdrop. A sharp rebound in real yields or a stronger dollar would cut the other way and could test the resilience of the GC seasonal pattern.
Third, flows and positioning. The recent surge in ETF inflows and the drop in COMEX short interest have already shifted the balance of power in the futures market.[2][3][6] Traders will be watching whether ETF demand stays strong into year-end and whether shorts rebuild into rallies or continue to stand aside. Persistent inflows and subdued short interest through the window would echo prior strong years in the pattern, while fading demand or a rapid rebuild in shorts would signal a tougher tape even inside a historically bullish stretch.
Finally, levels. On the downside, the 4,300–4,350 area, not far above the 52-week low band, has been an important reference zone for recent buyers. On the upside, the 5,000 handle looms as both a psychological level and a waypoint in some longer-term bank scenarios.[3][4] How GC trades around these zones during the Sep 12–Jan 16 window will tell traders whether this cycle is tracking the historical script or breaking from it.
Sources
- Yahoo Finance (MarketWatch excerpt) - Gold Makes Surprising Move on Fed Expectations
- GuruFocus via Yahoo Finance - Gold Makes a Powerful New Move
- Yahoo Finance (Investing.com summary of Morgan Stanley) - Morgan Stanley is out with its gold price outlook for 2027
- Yahoo Finance (original Morgan Stanley article) - Morgan Stanley Doubles Down on Gold After Breakout
- Barchart - Gold Aug '28 Futures Performance Report - GCQ28
- CME Group - Gold Options Volume & Open Interest - CME Group
About this seasonal analysis
Seasonal pattern data is sourced from TradeWave.ai, which analyzes historical price behavior across annual calendar windows going back up to 30 years. Read the full data methodology or the book The 100-Year Pattern by Afshin Moshrefi (2026 edition). Past performance of seasonal patterns does not guarantee future results. This article is for informational purposes only and does not constitute investment advice.