Amphenol (APH) Has Rallied in 8 Straight Midterm Sep-Apr Windows, Averaging 11.66% Gains
Amphenol is heading into a historically strong midterm-year seasonal window even as shares sit well below their 52-week high ahead of a stock dividend and fall earnings.
Price as of Aug 31, 2026: $158.55 (last close).

What is the seasonal pattern for Amphenol (APH)?
Amphenol has risen in 8 of 8 midterm-election-year Sep 18 to Apr 7 windows, with an average gain of 11.66% in winning years.
- 8 for 8 in this window, with Amphenol posting gains every time and averaging 11.66% in winning years.
- Seasonal window runs from Sep 18 for 202 days, covering the late midterm election year into the start of the pre-election year.
- Percent Profitable is 100%, with 8 winners and 0 losers across the last 8 midterm election years.
- Average profit of 11.66% compares with a cumulative return of 140% when stacking this window across all eight cycles.
- Intraperiod swings have been meaningful, with individual years showing double-digit peak gains and double-digit drawdowns before finishing higher.
- Sharpe ratio of 3.08 and a TradeWave Ratio of 2.46 point to historically strong, risk-adjusted upside in this specific Amphenol trading window.
According to historical data from TradeWave.ai, this upcoming stretch for Amphenol behaves very differently from an average calendar period. The next section walks through how that election-cycle seasonal pattern has played out in prior midterm years.
How has Amphenol (APH) traded in past midterm-year Sep–Apr windows?
Amphenol has finished higher in every single Sep 18 to Apr 7 window across the last eight midterm election years, averaging an 11.66% gain with no losing cycles. Today the stock closed at 158.55, up 0.5% on the day and about 11.2% below its 52-week high of 178.52, after a year-to-date climb of 17.73% that has already outpaced many large-cap tech peers.[1]
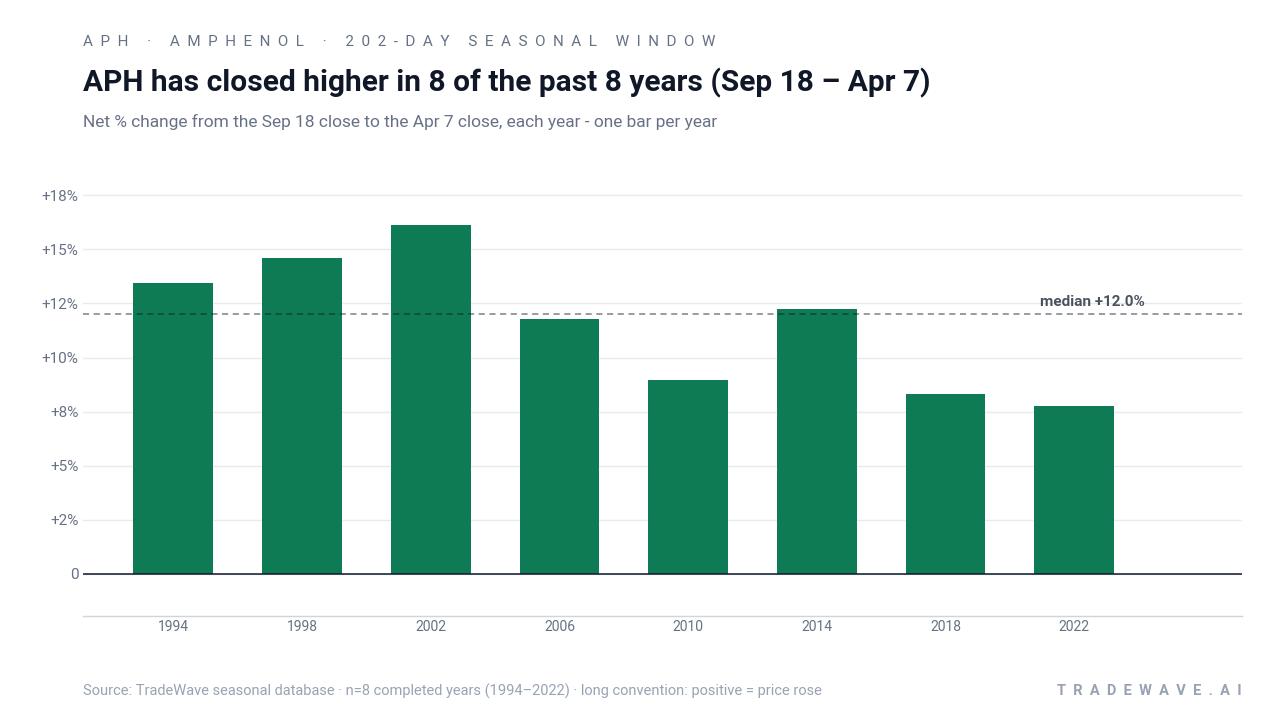
The pattern is grouped by the presidential election cycle, focusing on the last eight midterm election years rather than consecutive calendar years. That matters because policy uncertainty, spending debates and rate cycles often cluster in similar ways across midterm years, and Amphenol’s historical seasonality appears to line up with that macro rhythm.
This seasonal window begins on Sep 18 and spans 202 days, carrying through the end of the midterm election year and into the early months of the year before the presidential election. Historically, during this period, Amphenol has shown a strong upside tendency for long positions, with 8 winners and 0 losers and a cumulative gain of 140% when the windows are stacked.
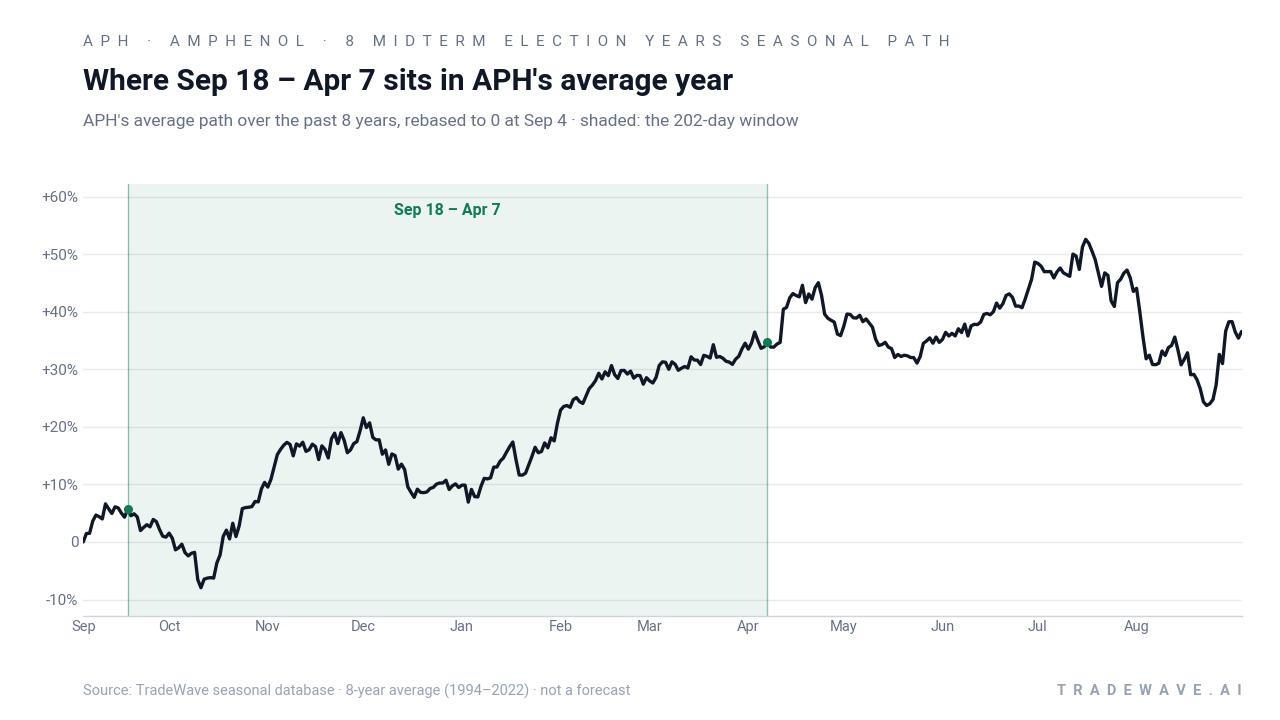
A second view shows how far Amphenol has typically swung inside the window before finishing higher.
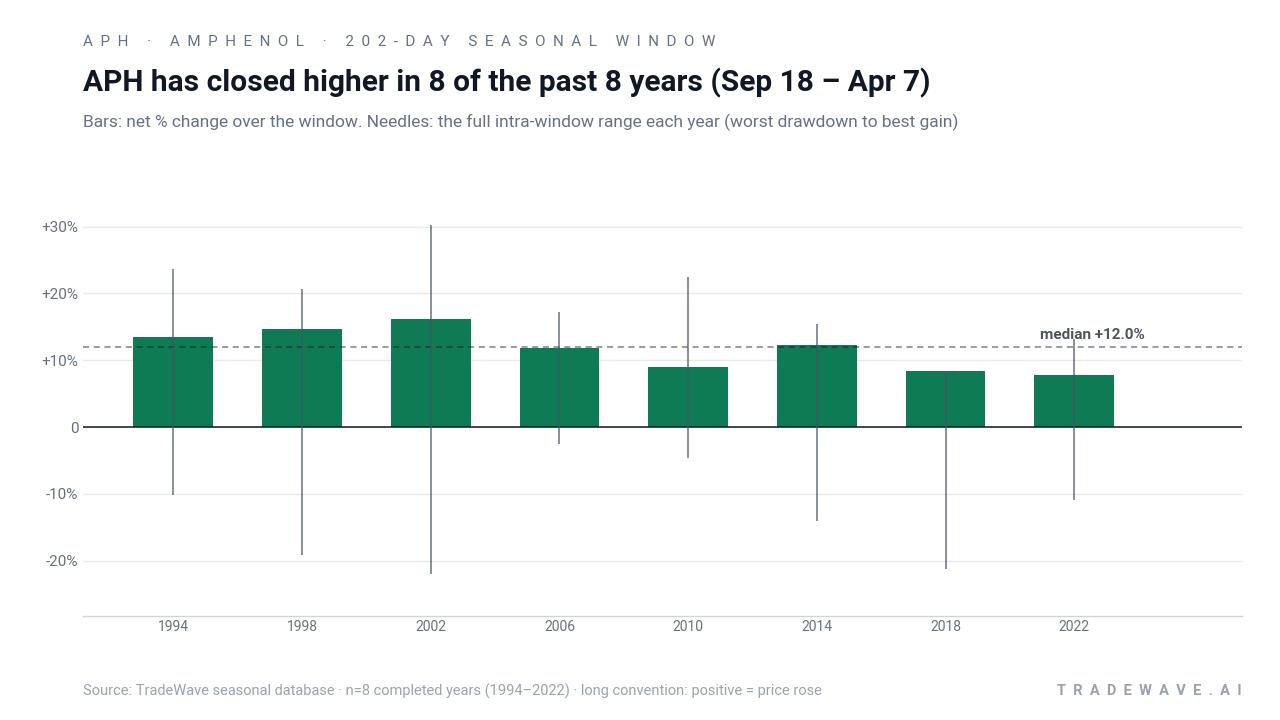
Average winners of 11.66% mask some wide swings under the surface. In 2002, for example, Amphenol’s best intraperiod move reached a 30.18% run-up while the worst drawdown from entry was a 21.95% slide before the stock still finished the window up 16.11%. In 2018, the net gain was 8.33%, but the path included a 21.2% adverse move at one point, underscoring that even “all green” windows can feel rough in real time.
The maximum favorable excursions, or peak run-ups, have been consistently double-digit, with years like 1994 and 1998 posting intraperiod highs of 23.61% and 20.59% respectively. On the downside, the maximum adverse excursions, or worst drawdowns, have ranged from a relatively mild 2.51% in 2006 to deeper hits above 20% in 1998, 2002 and 2018. That mix of strong upside and meaningful downside is what drives the TradeWave Ratio of 2.46 and a Sharpe ratio of 3.08 for this long setup.
The trend profile across the eight midterm-year samples leans toward a steady climb rather than a single explosive burst. The historical seasonal average suggests gains tend to build through the fall and winter, with some choppier stretches where drawdowns have appeared before the window closes higher into early April. The cumulative return chart, which compounds each window year over year, reaches 140.9%, showing how repeating this specific slice of the calendar has stacked up over time.
Put together, the record is simple: eight for eight, with double-digit average gains and sizable intraperiod swings that have so far resolved in favor of the long side.
Why does Amphenol (APH) follow this seasonal pattern?
One likely driver is the way Amphenol’s earnings calendar lines up with the midterm election year, with Q3 and Q4 results and guidance often landing inside this Sep–Apr stretch and shaping expectations for the following year.[2][5] Analysts have also pointed to institutional portfolio repositioning around year-end, when large investors adjust exposure to technology and electronic components ahead of the typically stronger year before the presidential election.[1][3][4] The pattern may also reflect sector rotation as investors lean into durable, cash-generative tech hardware names when policy and rate paths look more predictable heading into the pre-election year.
History does not guarantee future results; adverse excursions can be large even in winning windows, and past seasonality does not ensure similar outcomes in 2026–27.
What is driving Amphenol (APH) today?
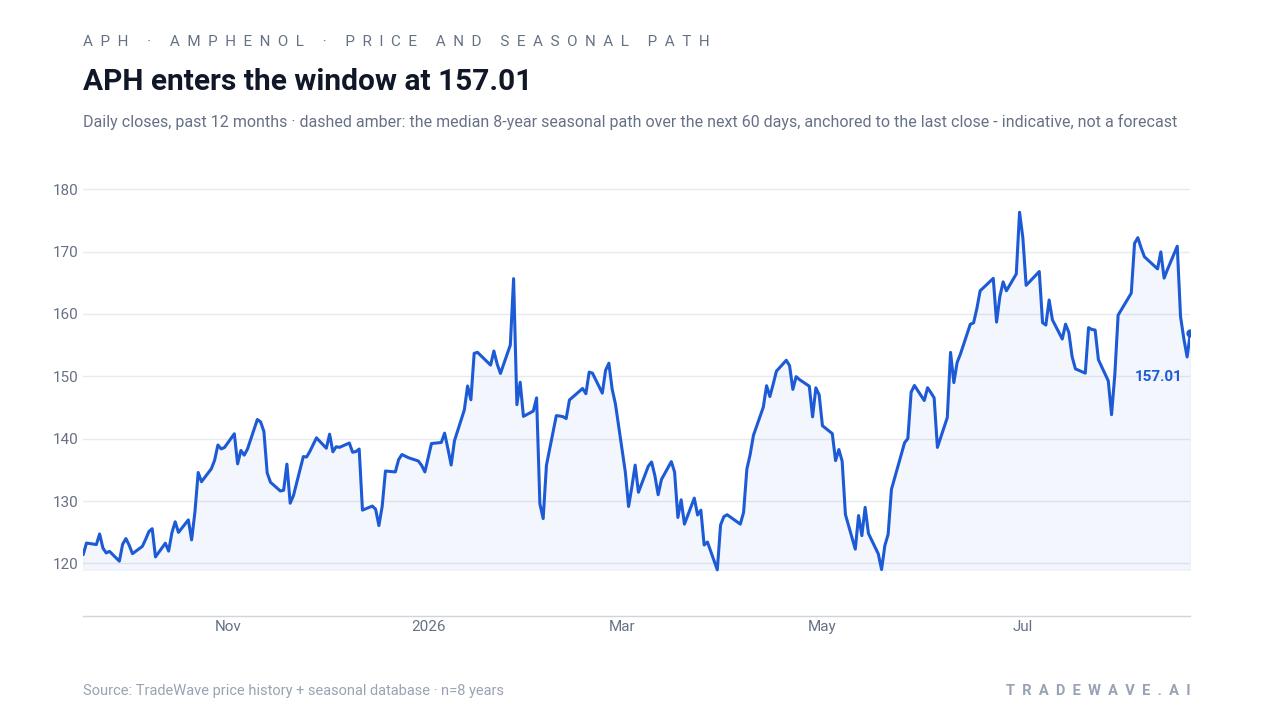
Amphenol shares ended Tuesday at 158.55, up 0.81 on the session, leaving the stock about 11.2% below its 52-week high of 178.52 and up 17.73% so far in 2026.[1] That puts the electronic components maker solidly in an uptrend but not stretched, with the 50-day moving average near 161.01 and 20-day average volume around 5.61 million shares, suggesting liquidity is ample for institutional positioning ahead of the seasonal window.
The near-term corporate calendar is busy. A 100% stock dividend carries an ex-date of Sep 3, 2026, a structural event that can reset headline share prices and sometimes draw in incremental retail interest as the nominal price falls.[2] On the fundamental side, Amphenol is coming off a strong Q2 2026, where EPS of $0.68 topped estimates of $0.59 by roughly 15%, and Q1 fiscal 2026 revenue was reported at $7.62 billion with earnings of $933 million and a profit margin of 12.24%.[2][5] The next earnings call is scheduled for Oct 21, 2026, with the formal Q3 2026 earnings date listed as Oct 28, 2026, giving investors two catalysts squarely inside the early part of the Sep–Apr seasonal window.[1][5]
On the sentiment side, Wall Street remains constructive. Yahoo Finance’s aggregated analyst data shows a consensus “Buy” rating on Amphenol, with a blended price target around 192.12 that sits comfortably above the current quote.[1][2][3] Public.com’s snapshot of the name similarly highlights a technology-sector stalwart with solid revenue, a mainstream valuation and a distribution of analyst recommendations skewed toward positive views.[4] In May 2026, GuruFocus flagged notable insider selling over a three-month span, citing figures of $18.7 million and $130.8 million in separate pieces, which some investors read as a sign that management saw the stock as fairly valued after a strong run.[6]
The chart below situates the latest move in its recent multi-month context and overlays the median 60-day seasonal path.
What should traders watch as this Amphenol seasonal window approaches?
First, the calendar. The 202-day window opens on Sep 18 and runs through Apr 7, overlapping both the late stages of the midterm election year and the early months of the year before the presidential election. Historically, that transition has been a constructive backdrop for risk assets, and Amphenol’s own record in this slice of the calendar has been unusually consistent.
Second, price levels. With the stock about 11.2% below its 52-week high, traders will be watching whether Amphenol can reclaim the 50-day moving average near 161 and then push toward the 170–180 zone as the window progresses.[1] Behavior inside the window that instead sees the stock break below recent lows and stay there would mark a clear departure from the historical pattern.
Third, catalysts. The Sep 3 stock dividend, followed by the Oct 21 earnings call and Oct 28 Q3 print, will test whether the company can sustain its recent run of EPS beats and margin strength.[2][5] Strong results and guidance during this period would rhyme with prior midterm-year windows that delivered double-digit gains, while a miss or cautious tone could be the kind of shock that produces the deeper intraperiod drawdowns seen in years like 2002 and 2018.
Finally, positioning and insider behavior. While the insider selling flagged in May 2026 is dated by early September, traders will be alert for any fresh filings that either extend that pattern or show a shift back toward insider buying.[6] A slowdown in selling or a turn toward accumulation during the Sep–Apr window would align with the historical bullish seasonal trend, while renewed heavy selling into strength would be a sign that this cycle may not track the prior eight as cleanly.
Add it up: a stock in a solid uptrend, a packed catalyst calendar and a midterm-year seasonal window that has never produced a losing outcome in this dataset. The next 202 days will show whether Amphenol can keep that perfect record intact.
Sources
- Yahoo Finance - Amphenol Corporation (APH) Stock Price, News, Quote & ...
- Yahoo Finance - Analysis - Amphenol Corporation (APH) Analyst Ratings, Estimates & Forecasts - Yahoo Finance
- Yahoo Finance (article) - Do Wall Street Analysts Like Amphenol Stock?
- Public.com - Buy Amphenol Stock – APH Stock Quote Today & Investment Insights - Public.com
- Public.com - Earnings - Amphenol (APH) Earnings: Latest Report, Earnings Call & Financials
- GuruFocus - Amphenol Corp (APH) Stock Up 5.8% and Still Undervalued
About this seasonal analysis
Seasonal pattern data is sourced from TradeWave.ai, which analyzes historical price behavior across annual calendar windows going back up to 30 years. Read the full data methodology or the book The 100-Year Pattern by Afshin Moshrefi (2026 edition). Past performance of seasonal patterns does not guarantee future results. This article is for informational purposes only and does not constitute investment advice.