Gold (COMEX) (GC) Has Closed Higher in Every Sep 12-Jan 16 Midterm Window Since 2002
Gold (COMEX) futures hover near $4,639 as traders look toward a mid-September seasonal window that has quietly delivered gains in every midterm election year since 2002.
Price as of Aug 28, 2026: $4,639.60 (intraday).

What is the seasonal pattern for Gold (COMEX) (GC)?
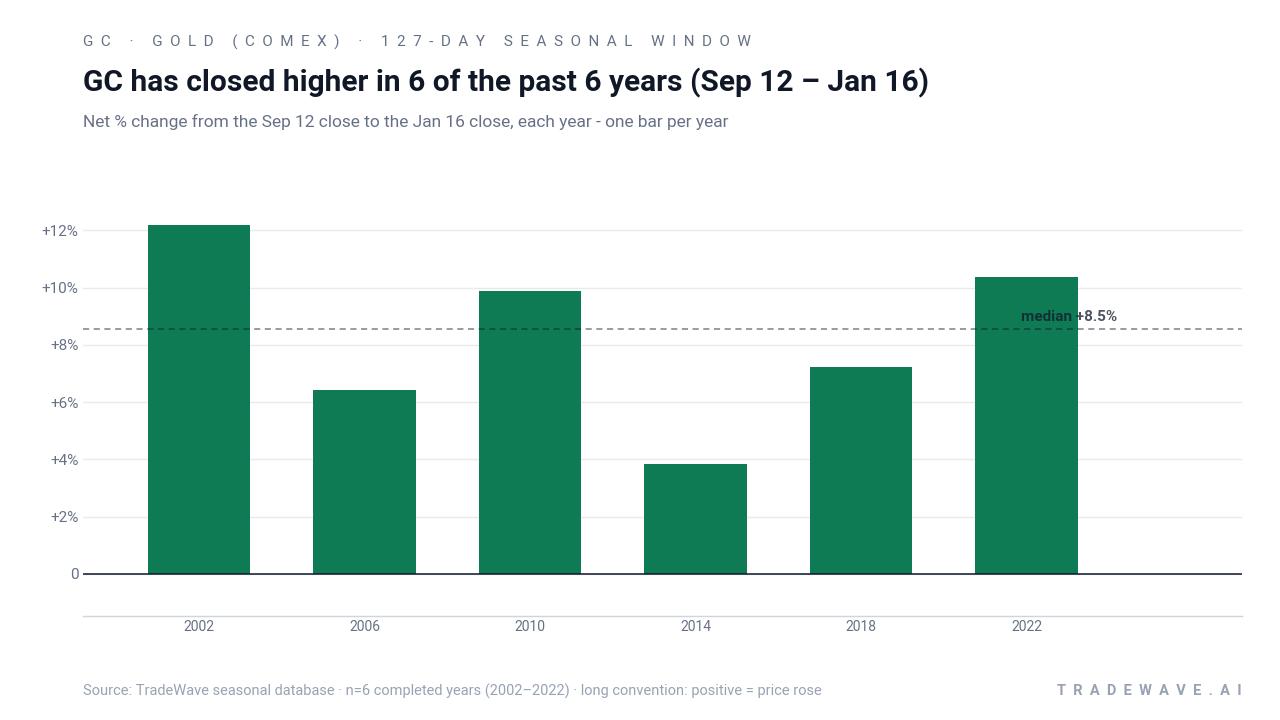
Gold (COMEX) has risen in 6 of 6 midterm-election-year Sep 12–Jan 16 windows, with an average gain of 8.31% in winning years.
- 6 for 6 in this window, averaging 8.31% gains in winning years across the last six midterm election cycles.
- Seasonal window runs from Sep 12 to Jan 16 (127 days), covering late midterm year into the start of the year before the presidential election.
- Percent Profitable is 100%, with 6 winners and 0 losers in the historical sample.
- Trade Direction is long, with a Sharpe ratio of 2.27 and a TradeWave Ratio of 2.28 for this specific Gold (COMEX) trading window.
- Individual years have seen double-digit maximum favorable moves, but some also carried mid-single-digit drawdowns before finishing higher.
- Cumulative stacking of this window across the six cycles adds up to a 61% total gain, underscoring how persistent this GC seasonal trend has been.
According to historical data from TradeWave.ai, this late-year stretch in midterm election cycles has behaved very differently from an average month on the gold calendar, and the next iteration is less than three weeks away.
How strong is the upcoming seasonal window for Gold (COMEX) (GC)?
Gold (COMEX) has finished higher in every single Sep 12 to Jan 16 window across the last six midterm election years, averaging an 8.31% gain with a long bias. The next 127-day window begins on Sep 12, 2026, with GC trading around $4,639 and sitting between a 52-week low near $3,568 and a high above $5,586, a range that shows how volatile this contract has been over the past year.
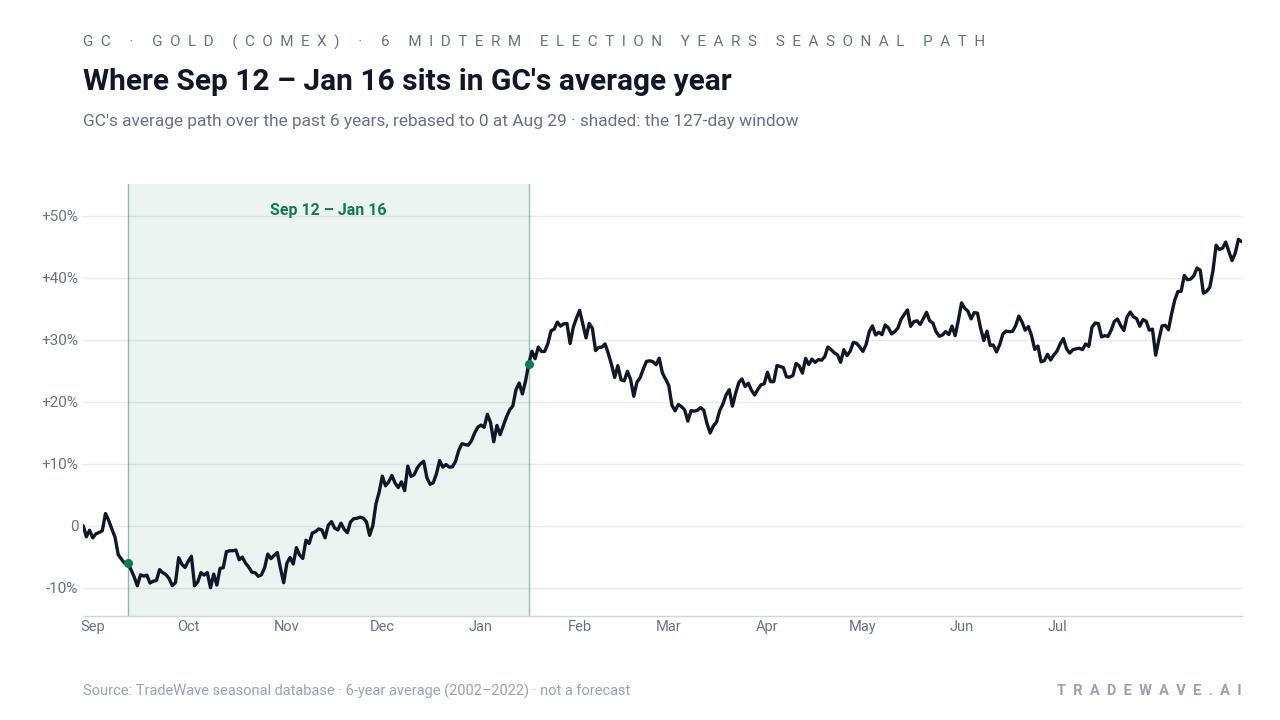
Because this pattern is grouped by the presidential election cycle, it only looks at midterm election years, then tracks how gold behaves as markets transition into the year before the presidential election. That matters for a macro asset like GC, since fiscal debates, Fed policy shifts and risk sentiment often change character between the midterm year and the pre-election year.
Across the six completed midterm-year samples since 2002, every Sep 12–Jan 16 window ended positive for a long position, with net returns ranging from 3.82% in 2014 to 12.17% in 2002. The strongest year in this Gold (COMEX) trading window was 2002, when the contract rallied 12.17% from entry to exit, while 2014 was the softest at 3.82%, yet still finished green. Add it up: stacking those six windows compounds to roughly a 61% cumulative gain.
The intraperiod path has not been a straight line. In 2010, gold’s best year by intraday follow-through, the maximum favorable move reached 14.94% while the worst drawdown from entry was effectively flat, showing a clean grind higher. By contrast, 2014 saw a maximum adverse move of about 7.88% before recovering into a modest gain, and 2022 carried a 6.54% drawdown at one point even though it ultimately delivered a 10.36% net return. For a long-biased pattern, that mix of double-digit upside potential and mid-single-digit downside swings is the risk profile traders have had to live with.
A per-year view of net returns, best rallies and worst drawdowns shows how consistently this window has favored longs while still delivering sizable swings.
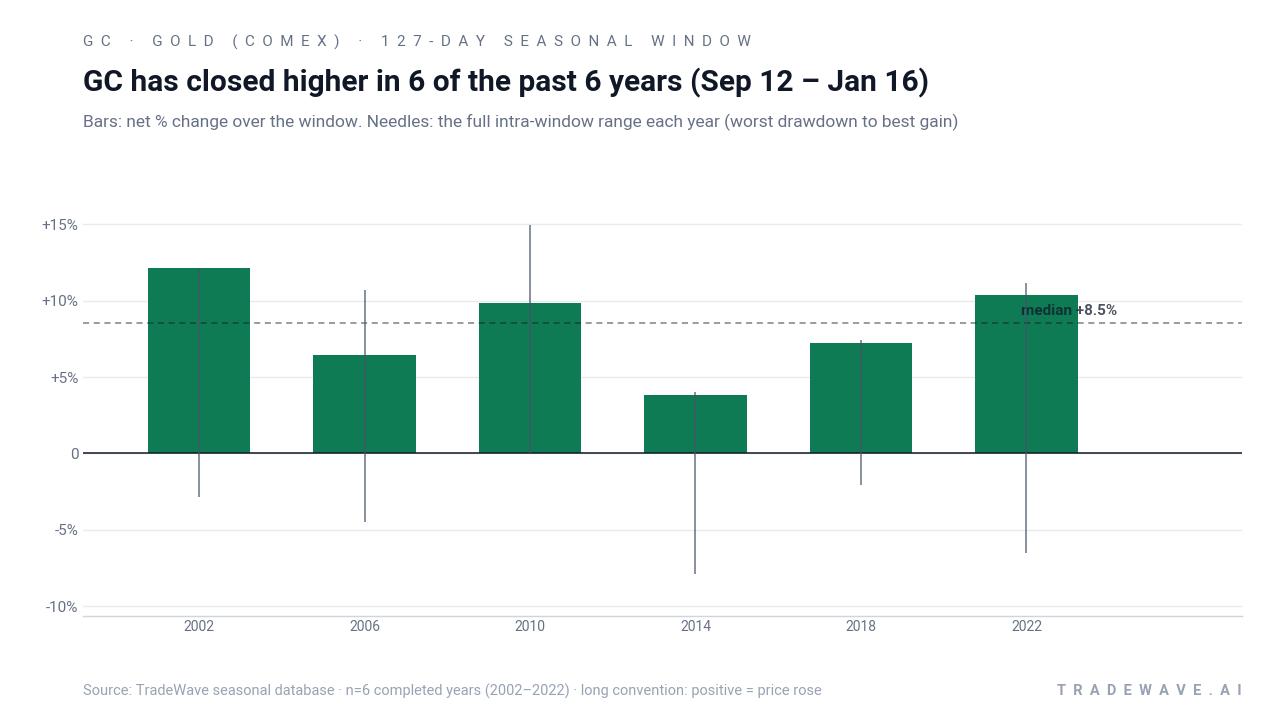
Across the sample, maximum favorable moves have often pushed into high single digits or low double digits, while maximum adverse moves have typically stayed in the low- to mid-single digits. That combination, along with a TradeWave Ratio of 2.28 and a Sharpe ratio of 2.27, points to a window where upside has historically outweighed downside for long positions, even though the path can be bumpy.
History does not guarantee future results; adverse excursions can still be large in this window even when the final outcome has been positive in prior years.
Why does Gold (COMEX) (GC) follow this seasonal pattern?
One likely driver is the way macro and policy calendars bunch up between late September and mid-January in midterm election years, from fiscal showdowns to central-bank meetings and year-end portfolio rebalancing. Analysts have also pointed to seasonal demand patterns in physical gold and jewelry ahead of major holidays, which can tighten supply and support prices. This GC seasonal trend may reflect that mix of policy uncertainty, shifting rate expectations and real-world buying that tends to favor gold as the midterm year wraps and the year before the presidential election begins.
What is driving Gold (COMEX) (GC) today?
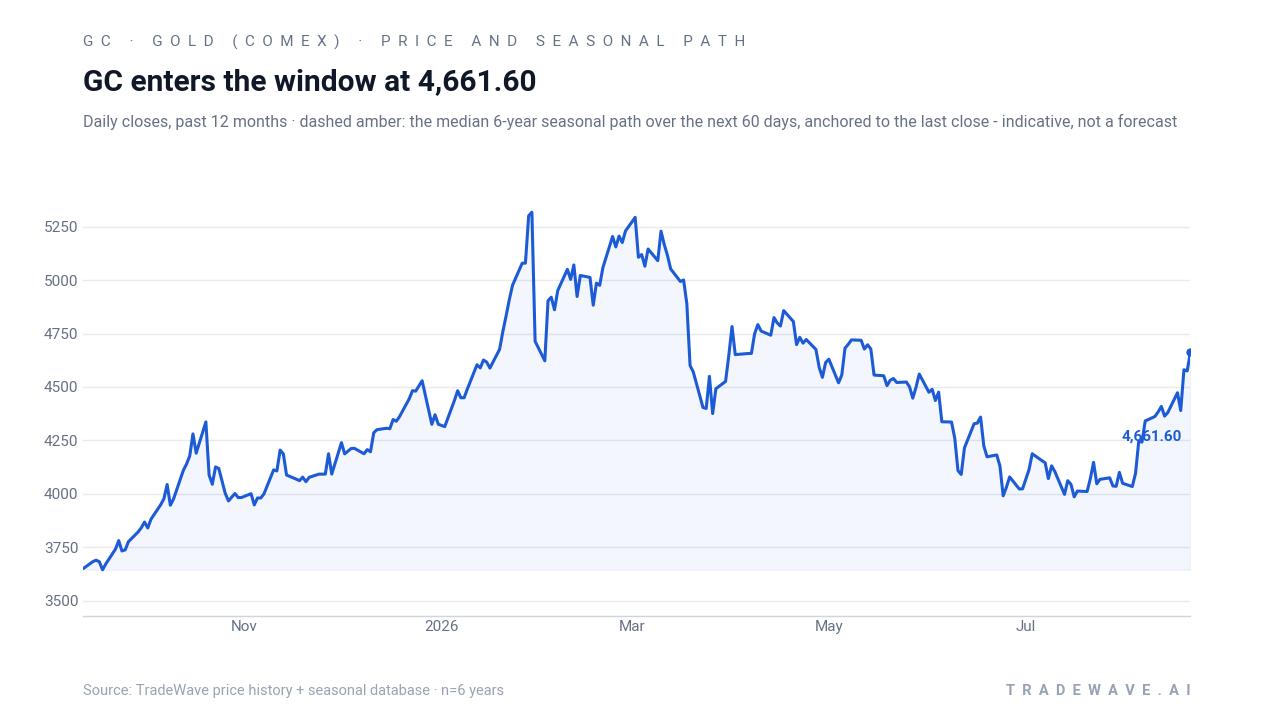
Gold (COMEX) futures settled near $4,639.10 in the prior session, down about 0.34% on the day, leaving the contract roughly in the middle of a wide 52-week band between $4,628.00 and $4,664.80. Recent trading has clustered in the mid-$4,600s, with the Dec 26 contract quoted around $4,647.80 on Aug 27 and the nearby Aug 26 contract near $4,607.80, underscoring how the curve is holding a modest upward slope into 2027.[1][2]
Macro drivers have been supportive. On Aug 12, softer U.S. payrolls data cut the perceived odds of another Federal Reserve rate hike, lowering the opportunity cost of holding non-yielding gold and helping front-month futures settle around $4,383.[3] By Aug 27, a surprise pickup in U.S. Treasury buybacks and mounting fiscal concerns pushed yields and the dollar lower, with front-month Comex gold settling at $4,640.80 and marking multi-month highs for the contract.[4]
Flows have echoed that shift in tone. Gold-backed ETFs absorbed about 46.7 metric tons in the biggest weekly inflow in 10 months, an estimated $6.4 billion that added fuel to the rally and signaled renewed institutional interest in the metal as a hedge against policy and fiscal risk.[4] Intraday snapshots also show active trading in nearby contracts, with GCQ26 volume readings helping confirm that futures desks are leaning into the move rather than fading it.[2]
The chart below puts the latest pullback in the context of a year-long climb and the historical 60-day seasonal projection.
What should traders watch as this Gold (COMEX) seasonal window approaches?
First, the calendar. The Sep 12 start date lands just as Washington’s fiscal debates and year-end positioning typically heat up in a midterm election year, a backdrop that has historically lined up with stronger gold performance in this specific window. Traders will be watching whether upcoming payrolls, inflation prints and Fed communications keep real yields contained, which would align with the historical pattern of gold grinding higher into January.[3][4]
Second, levels. The 52-week high near $5,586.20 is a natural reference point for bulls, while the mid-$4,500s have been an important near-term pivot in recent trading. If GC can hold above that zone as the window opens and volatility stays skewed toward upside spikes rather than deep drawdowns, it would rhyme with prior years where maximum favorable moves outpaced maximum adverse swings.
Third, flows and positioning. The recent 46.7-metric-ton surge into gold-backed ETFs is a clear sign that macro hedgers are back in the market.[4] If those inflows persist or expand as the seasonal window kicks in, it would reinforce the historical tendency for this period to favor long exposure. A sharp reversal in ETF flows or a cooling in futures volume would be an early sign that this cycle might diverge from the past.
Finally, behavior inside the window will matter as much as the end result. In prior cycles, even winning years saw drawdowns of 4–8% before recovering, so traders will be watching whether any early weakness stays within that historical band or breaks meaningfully below it. A pattern of shallow dips followed by steady buying would fit the established GC seasonal trend, while a deep, persistent selloff would be a clear break from the six-for-six record that has defined this midterm-year stretch so far.
Sources
About this seasonal analysis
Seasonal pattern data is sourced from TradeWave.ai, which analyzes historical price behavior across annual calendar windows going back up to 30 years. Read the full data methodology or the book The 100-Year Pattern by Afshin Moshrefi (2026 edition). Past performance of seasonal patterns does not guarantee future results. This article is for informational purposes only and does not constitute investment advice.