CBOE Volatility Index (VIX) Climbs to Multi-Month High Just Ahead of Historically Strong Sep 13-Oct 3 Run
CBOE Volatility Index is sliding toward the low end of its 52-week range just as a mid-September seasonal window that has usually seen volatility pick up comes into view.
Price as of Aug 27, 2026: $14.51 (last close).

What is the seasonal pattern for CBOE Volatility Index (VIX)?
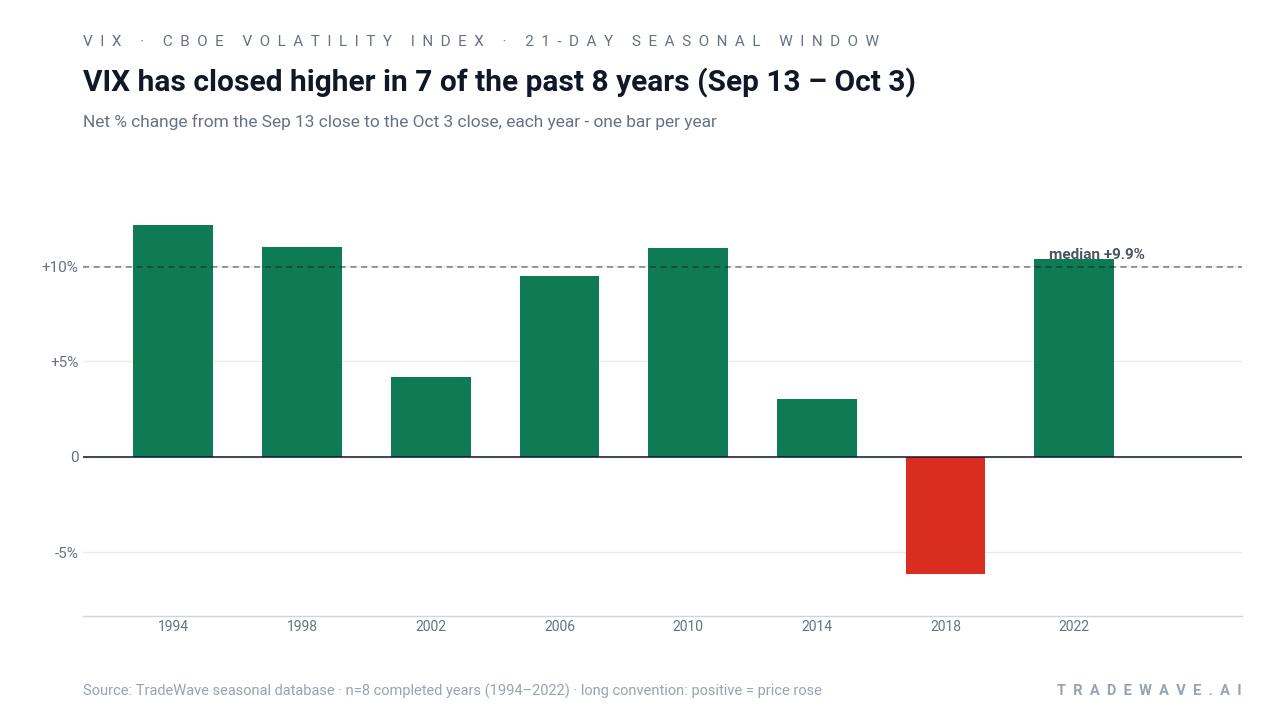
CBOE Volatility Index has risen in 7 of 8 midterm-year Sep 13–Oct 3 windows, with an average gain of 8.73% in winning years.
- 7 for 8 in this window, with winning years averaging 8.73% gains and a 68% cumulative return across the sample.
- Percent Profitable is 88%, with 7 winners and 1 loser across the last 8 midterm election years in this 21-day stretch.
- Avg Profit - All, which includes the lone losing year, still comes in at 7%, pointing to a solid upside bias for a long VIX stance.
- The strongest years, such as 1994 and 1998, saw double-digit net gains and intraperiod spikes of more than 18% from entry.
- The weakest year, 2018, posted a -6.14% net decline and saw an adverse move of -10.27% from entry before stabilizing.
- Intraperiod swings are wide, with several years showing worst drawdowns near -17% even when the window ultimately finished higher.
According to historical data from TradeWave.ai, this mid-September stretch has behaved very differently from an average month on the calendar for the VIX. The next section walks through how that pattern has played out across past midterm election years and what it implies for the coming window.
How has CBOE Volatility Index (VIX) traded in the Sep 13–Oct 3 window?
CBOE Volatility Index has closed higher in 7 of the last 8 midterm-year Sep 13–Oct 3 windows, with long trades in this stretch posting an average gain of 8.73% in winning years. The next iteration of that 21-day window begins on Sep 13, 2026, with VIX currently at 14.51, about 58.9% below its 52-week high of 35.3 and roughly 8.4% above its 52-week low of 13.38. That combination of a historically bullish volatility window and a spot level parked near the bottom of the recent range is what has short-term volatility traders paying attention.
The pattern is built specifically on midterm election years, a phase that often features policy uncertainty, budget fights and shifting expectations for the following pre-election year. Grouping by this presidential cycle slice matters because volatility behavior in midterms has historically looked very different from election years or the year after, with more frequent spikes around policy headlines and risk-off episodes.
Across the eight midterm-year samples since 1994, the long VIX trade in this window has produced a 68% cumulative return when the 21-day slices are stacked back to back. Median profit sits at 9.93%, which is slightly higher than the all-years average and suggests that the typical winning outcome is not being skewed only by one or two outliers. The lone losing year, 2018, clipped the all-years average down to 7%, but did not erase the broader upside bias.
Looking at individual years, 1994 and 1998 stand out as classic volatility surges, with net gains of 12.13% and 10.99% and maximum favorable moves of 19.1% and 18.12% from entry. More recently, 2022 delivered a 10.38% net gain with a 27.91% best intraperiod run-up, reflecting how quickly implied volatility can expand when macro stress builds. On the softer side, 2014 still finished positive at 3.05% but saw a very wide range, with a 27.34% best gain and an -18.41% worst drawdown inside the same 21-day span.
The intraperiod profile is where the risk shows up. Several years, including 1994 and 1998, saw worst adverse moves of roughly -16% from entry even though the window ultimately closed higher. In 2018, the losing year, the maximum adverse move reached -10.27%, and the best rally from entry topped out at 11.16% before fading into a negative close. That mix of large positive and negative excursions is consistent with a high-variance volatility window rather than a slow grind.
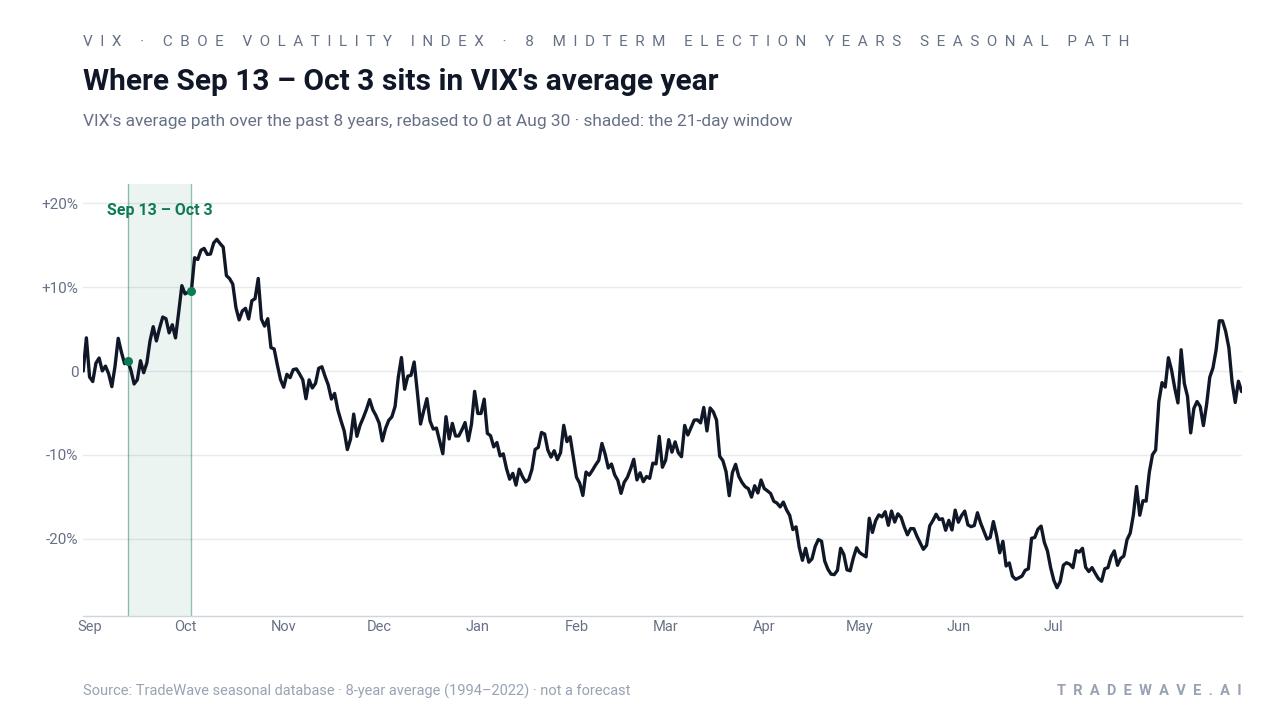
A second view of the same window highlights how far VIX has swung inside each 21-day slice.
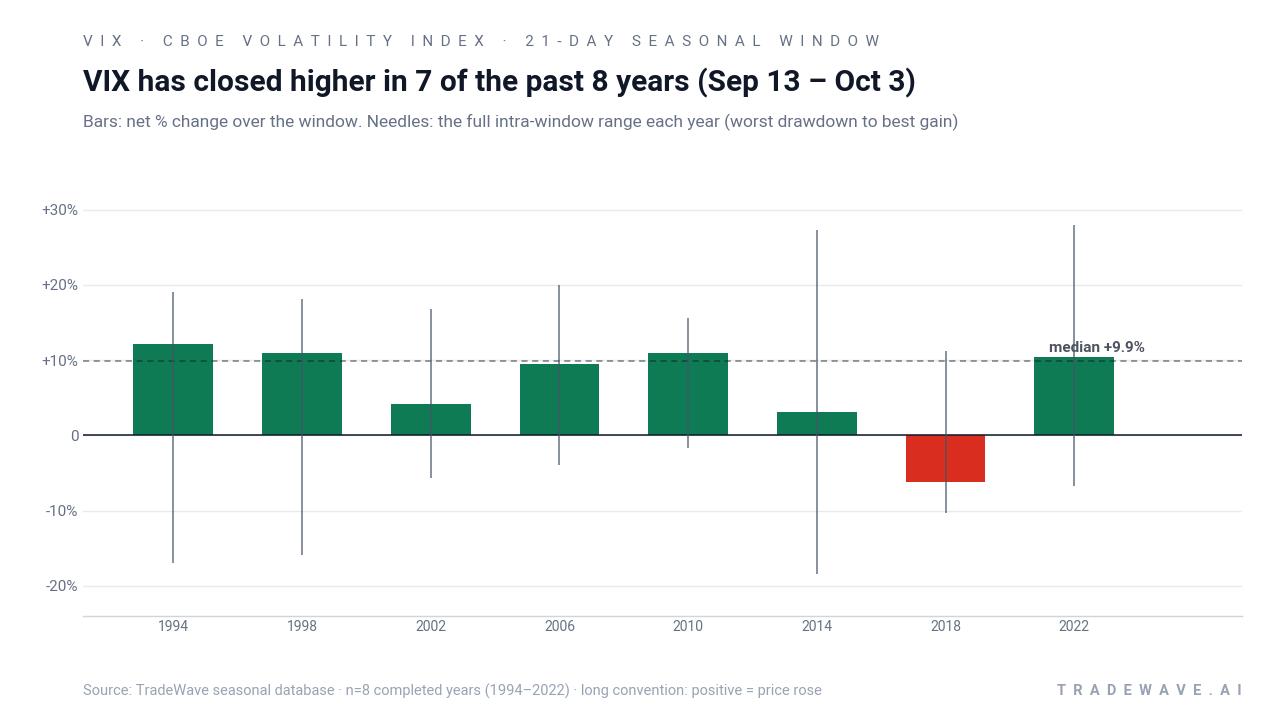
The combined net/MFE/MAE view shows why this pattern attracts tactical traders. Maximum favorable excursions have often pushed into the mid-teens or higher in percentage terms, while maximum adverse moves have frequently been in the high single digits to mid-teens. That profile, along with a TradeWave Ratio of 3.39 and a Sharpe ratio of 1.07, points to a window where volatility itself tends to move a lot, and where long VIX exposure has historically been rewarded more often than not, but with meaningful downside swings along the way.
History does not guarantee future results; adverse excursions (MAE) can be large even in winning windows.
Why does CBOE Volatility Index (VIX) follow this seasonal pattern?
One likely driver is the clustering of macro and policy events in late September of midterm election years, including budget deadlines, debt-ceiling debates and shifting expectations for the following pre-election year. Analysts have also pointed to institutional portfolio rebalancing and options positioning around quarter-end, which can amplify demand for S&P 500 protection and lift implied volatility. This Sep 13–Oct 3 window may therefore capture a recurring mix of policy risk and hedging flows that tends to push the VIX higher from relatively subdued late-summer levels.
What is driving CBOE Volatility Index (VIX) today?
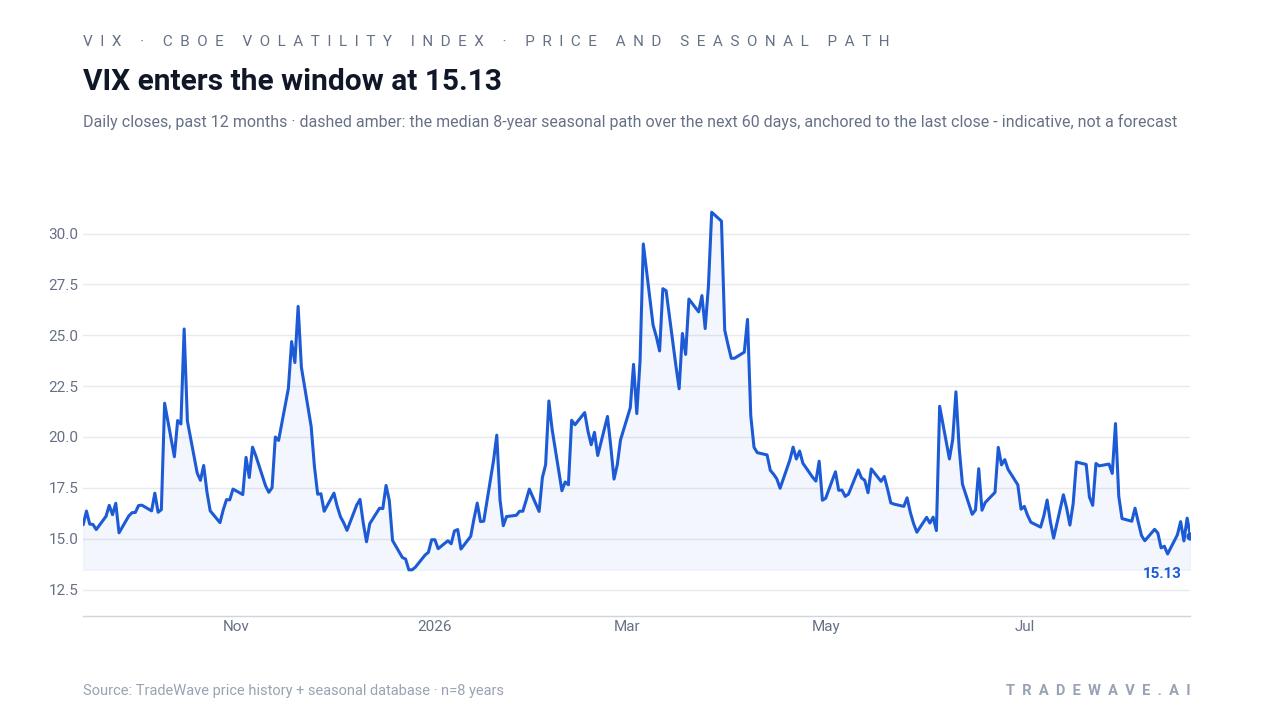
CBOE Volatility Index ended the prior session at 14.51, down 4.6% on the day and well below its 50-day moving average of 16.5806, leaving it about 58.9% under its 52-week high of 35.3 and roughly 8.4% above its 52-week low of 13.38. That puts the so-called fear gauge in a relatively calm zone compared with the spikes seen when geopolitical tensions or tariff headlines have flared in past years, even as investors remain alert to the potential for sudden jumps in implied volatility around macro surprises.[2]
The chart below situates the latest move in its recent multi-month context alongside a historical seasonal projection.
What should traders watch in this VIX seasonal window?
For the upcoming Sep 13–Oct 3 stretch, the first thing to watch is whether VIX remains pinned near the low end of its 52-week range into the start of the window or begins to lift ahead of it. A flat or drifting-lower VIX into mid-September would echo several past midterm years where the index entered the window subdued and then spiked, while an early rise could front-load some of the historical move. The 13–16 band around the recent lows is a practical reference zone for whether implied volatility is still “cheap” relative to its own history.
Second, the behavior of macro and policy headlines around late September will matter. Midterm years often bring budget showdowns and trade or geopolitical noise, and in prior cycles those episodes have coincided with sharp VIX jumps as investors scrambled for S&P 500 downside protection.[2] If similar tensions build into this year’s quarter-end, traders will be watching to see whether VIX follows its historical seasonal trend higher or whether a more benign macro backdrop keeps the index suppressed.
Finally, intraperiod swings inside the window will be as important as the closing print. Past years have seen maximum favorable moves north of 15% and adverse moves in the low- to mid-teens, so traders focused on this VIX seasonal trend will be monitoring not just where the index finishes on Oct 3, but how violently it travels between entry and exit. A pattern of quick spikes that fade, or of shallow dips that are bought, would each tell a different story about how today’s volatility regime compares with the last eight midterm election years.
Sources
About this seasonal analysis
Seasonal pattern data is sourced from TradeWave.ai, which analyzes historical price behavior across annual calendar windows going back up to 30 years. Read the full data methodology or the book The 100-Year Pattern by Afshin Moshrefi (2026 edition). Past performance of seasonal patterns does not guarantee future results. This article is for informational purposes only and does not constitute investment advice.