Nasdaq QQQ Invesco ETF (QQQ) Has Rallied in 6 Straight Midterm Windows, Averaging 23.8% Gains
Nasdaq QQQ Invesco ETF is stepping into a historically powerful 315-day seasonal window even as AI-driven CapEx and cash-flow pressure keep the tech-heavy fund under close watch.

What is the seasonal pattern for Nasdaq QQQ Invesco ETF (QQQ)?
Nasdaq QQQ Invesco ETF has risen in 6 of 6 midterm-election-year windows starting Sep 8 and lasting 315 days, with an average gain of 23.8% in winning years.
- 6 for 6 in this window, with QQQ averaging 23.8% gains across all six midterm-election-year cycles.
- Seasonal window runs from Sep 8 through roughly Jul 19, spanning 315 calendar days in the midterm election year into the pre-election year.
- Percent Profitable is 100%, with 6 winners and 0 losers across the historical sample.
- Annualized return for the pattern clocks in at 23.39%, with a Sharpe ratio of 1.88 based on end-of-window outcomes.
- TradeWave Ratio of 1.84 indicates that price has typically traveled meaningfully in the long direction within the window, not just at the close.
- Individual years have still seen sizable drawdowns inside the window, including adverse moves worse than 20% before finishing higher.
According to historical data from TradeWave.ai, this long midterm-to-pre-election stretch has behaved very differently from an average year for QQQ. The next section walks through what that election-cycle seasonality has looked like in practice for the tech-heavy ETF.
How has Nasdaq QQQ Invesco ETF (QQQ) traded in this midterm-year window?
Nasdaq QQQ Invesco ETF has finished higher in every one of the last six midterm-election-year windows that start on Sep 8 and run 315 days into the following pre-election year, averaging a 23.8% gain. The ETF enters this latest iteration around 717.67, leaving it about 3.9% below its 52-week high and well above its 52-week low, after a modest 0.56% pullback over the past month.
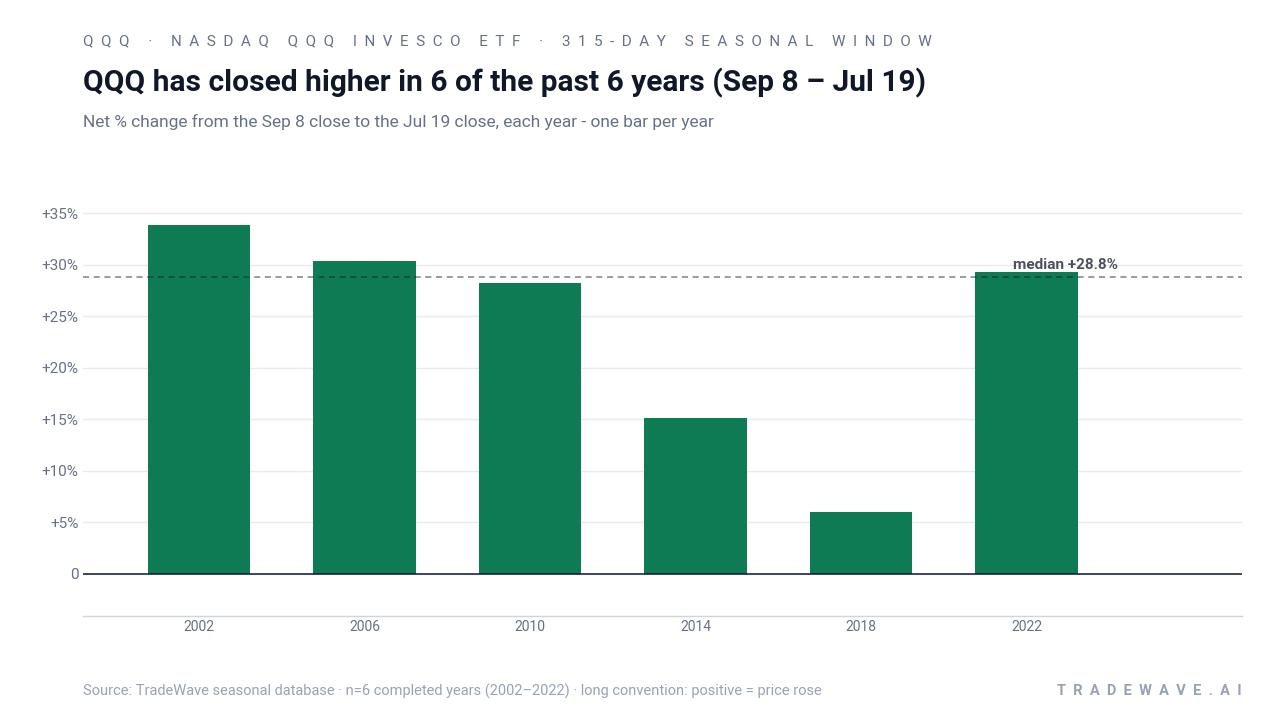
Grouping by the presidential election cycle matters here because this window sits in the concluding midterm election year and runs deep into the year before the presidential election, a phase that has often coincided with friendlier policy tone and risk-on behavior in growth stocks. In this sample, the trade direction is explicitly long, and every completed midterm-year instance from 2002 through 2022 has delivered a positive net return for QQQ.
Across those six cycles, the ETF’s annualized return inside the window is 23.39%, with a Sharpe ratio of 1.88 based on end-of-window outcomes. Average gains of 23.8% mask a wide range of results: the strongest year in 2002 posted a 33.8% net return, while the softest in 2018 still finished up 6.03% after a rough stretch that included a deep drawdown.
Intraperiod swings have been meaningful. In 2002, QQQ’s best point-to-peak move, or maximum favorable excursion, reached 41.9% while the worst drawdown from entry, or maximum adverse excursion, hit -14.38%. In 2018, the ETF suffered an intraperiod drawdown of -20.69% before recovering to end the window higher, underscoring that even “all green” years have not been smooth rides.
The trend profile leans steadily positive. Trend statistics show 37 long-biased trend days versus just 1 short-biased trend day across the composite, and a similar skew in the shorter-horizon trend measures, suggesting that strength has tended to persist rather than mean-revert quickly. The cumulative pattern compounds to a 252% gain across the six completed windows, meaning that stacking only this Sep 8 to Jul 19 slice of the calendar has historically produced outsized returns relative to holding periods of similar length.
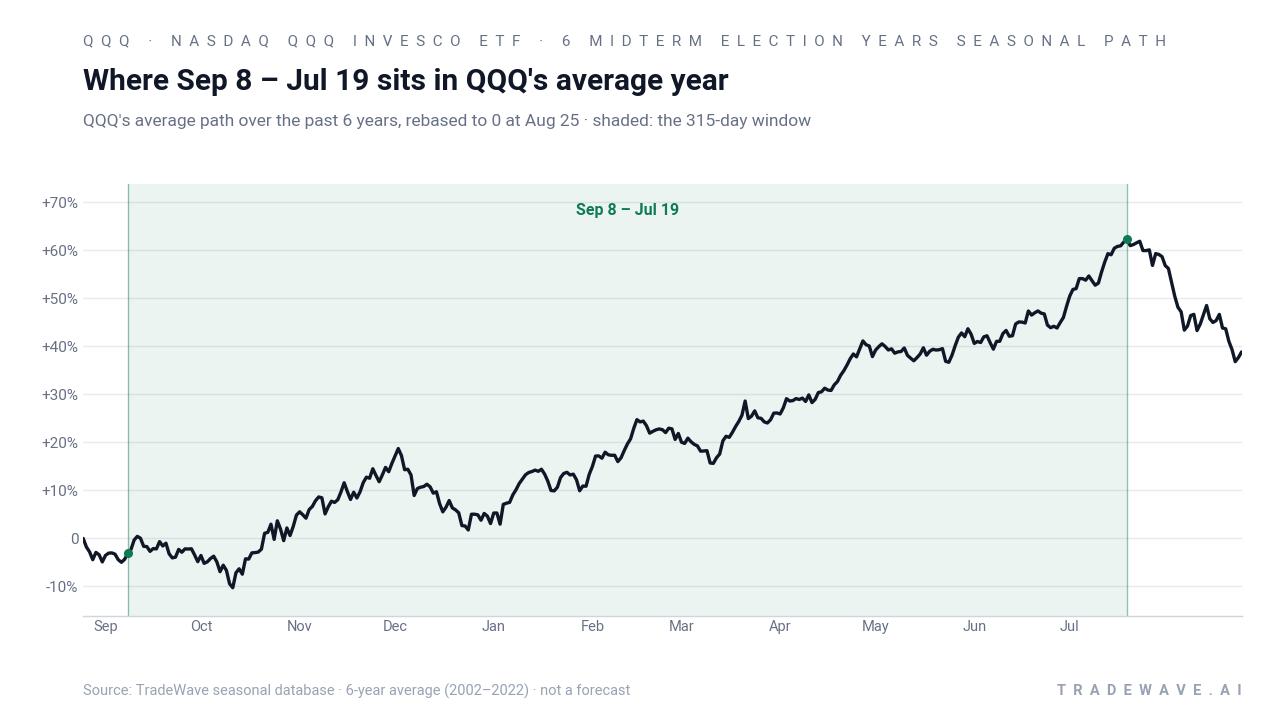
A second view shows how each year’s net result and intraperiod range stack up inside that average path.
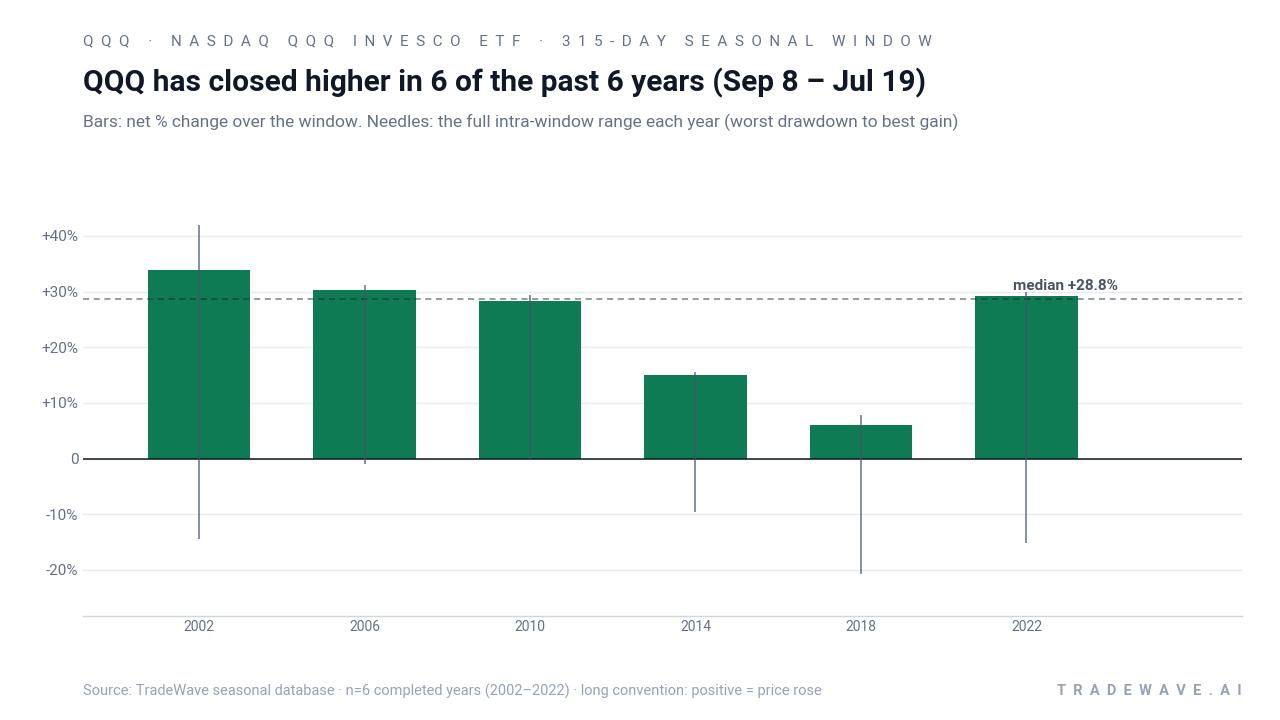
That stacked bar-and-range view shows a consistent pattern of positive closes paired with wide intraperiod ranges, where the distance between the worst drawdown and best gain has often exceeded 30 percentage points. Add it up: six straight winning windows, 252% cumulative gains, and a history of sharp swings that have rewarded patience but punished weak hands.
History does not guarantee future results; adverse excursions can be large even in winning windows, and past seasonal behavior may not repeat.
Why does Nasdaq QQQ Invesco ETF (QQQ) follow this seasonal pattern?
One likely driver is the way the presidential election cycle shapes policy expectations and risk appetite, with the late midterm year into the year before the presidential election often seeing friendlier liquidity and less policy uncertainty. Analysts have also pointed to the clustering of big-tech earnings, fiscal-year budgeting, and institutional portfolio rebalancing in this stretch, which can funnel flows into growth and technology-heavy benchmarks like QQQ.[4] The pattern may also reflect how AI and cloud spending cycles ramp into calendar-year planning, reinforcing a pro-risk tone when macro conditions cooperate.[5]
What is driving Nasdaq QQQ Invesco ETF (QQQ) today?
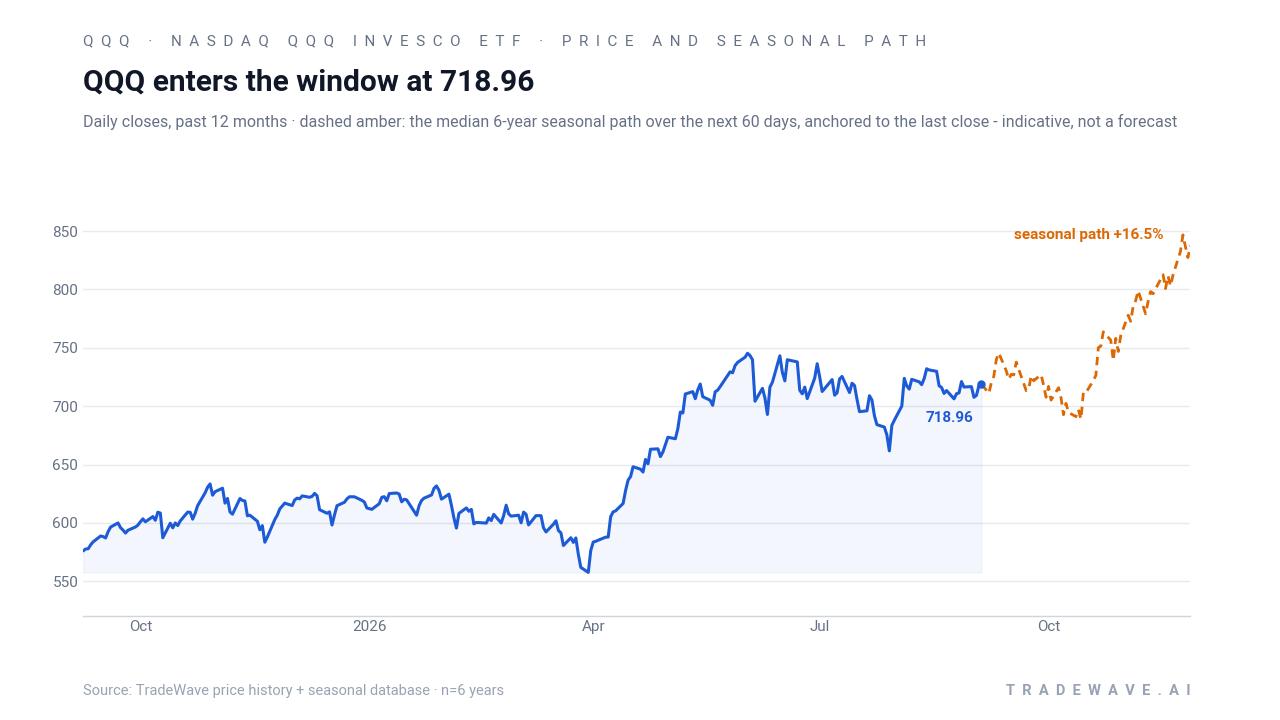
QQQ traded around 717.67 on Sep 8, up 1.19% on the day and sitting about 3.9% below its 52-week high of roughly 747, after a mild 0.56% slide over the past month. The ETF’s 20-day average volume near 30.8 million shares and a 50-day moving average around 711 suggest the fund is consolidating near highs rather than breaking out or breaking down.
Macro drivers remain tightly linked to the AI investment boom. Large technology constituents inside QQQ are pouring capital into data centers, chips, and cloud infrastructure, a spending wave that could either sustain earnings growth or compress returns if projects fail to pay off.[4] Rising capital-expenditure burdens have already pushed some top holdings into negative free cash flow, which has led several commentators to argue for a more cautious stance on the ETF despite its long-term track record.[4]
At the same time, QQQ’s role as a core Nasdaq-100 tracker with hundreds of billions of dollars in assets under management keeps it central to retail and institutional positioning.[3] In early September 2026, some long-horizon investors continued to frame the fund as a “buy and hold forever” vehicle for tech-led growth, even as they acknowledged that the AI CapEx arms race could create more volatile paths to those returns.[5]
The chart below situates the latest move against the past year of trading and a median seasonal path for the next two months.
What should traders watch in this QQQ seasonal window?
First, watch how QQQ behaves around its 52-week high zone near 747. A sustained push through that band early in the window would rhyme with prior cycles where strength built quickly and stayed intact, while repeated failures there would signal a more volatile, 2018-style path.
Second, track the AI and cloud CapEx narrative from QQQ’s largest holdings. If spending continues to rise but earnings and free cash flow keep pace, the historical midterm-to-pre-election strength could align with fundamentals; if margins compress, the same seasonal window could feature deeper drawdowns before any recovery.[4]
Third, monitor volatility and drawdowns inside the window rather than just end-point returns. Past cycles show that QQQ can drop 15% to 20% within this stretch and still finish the period higher, so how the ETF trades around those air pockets will tell you whether this iteration is tracking the historical script or breaking from it.
Finally, keep an eye on policy and macro headlines tied to the approaching presidential election year. Shifts in regulation, antitrust scrutiny, or tax policy aimed at big tech could either reinforce or blunt the historically strong QQQ seasonal trend in this phase of the election cycle.[4]
Sources
- The Motley Fool - Where Will QQQ Be in 12 Months? Wall Street Analysts Have a Clear Answer.
- The Motley Fool - Should You Buy the Invesco QQQ ETF After the Recent Nasdaq Sell-Off? History Offers a Crystal-Clear Answer.
- The Motley Fool - Where Will QQQ Be in 10 Years?
- Seeking Alpha - QQQ And Tech Earnings: They Can't All Win The CapEx Arms Race (NASDAQ:QQQ)
- The Motley Fool - If I Were in My 20s, I'd Buy This Spectacular Nasdaq-100 Index Fund and Hold It Forever
About this seasonal analysis
Seasonal pattern data is sourced from TradeWave.ai, which analyzes historical price behavior across annual calendar windows going back up to 30 years. Read the full data methodology or the book The 100-Year Pattern by Afshin Moshrefi (2026 edition). Past performance of seasonal patterns does not guarantee future results. This article is for informational purposes only and does not constitute investment advice.