Near Record Highs, Merck & Co. (MRK) Rides a 93% Profitable Midterm Sep-Apr Rally History
Merck & Co. is trading just below record highs as it sits inside a midterm-election seasonal window that has delivered gains in nearly every cycle, raising the stakes for a stock already up sharply this year.
Price as of Sep 4, 2026: $150.33 (last close).

What is the seasonal pattern for Merck & Co. (MRK)?
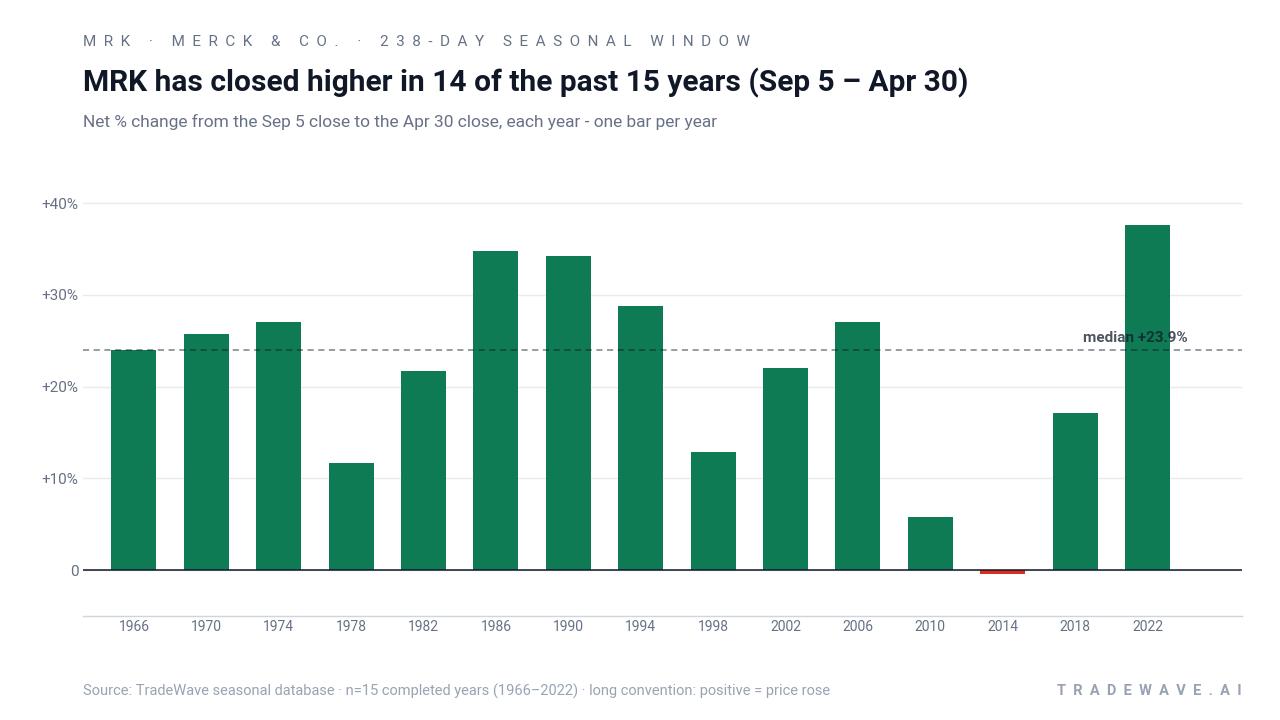
Merck & Co. has risen in 14 of the past 15 midterm-year Sep 5 to Apr 30 windows, with an average gain of 23.61% in winning years.
- 14-for-15 record in this window, with winners averaging 23.61% gains and only one losing year across the sample.
- Seasonal window runs 238 days from Sep 5 to Apr 30 in the last 15 midterm election years, aligning late midterm with the ramp into the pre-election year.
- Percent Profitable is 93%, with 14 winners and 1 loser, and an all-years average return of 22% after including the lone down year.
- Average loss in the single negative year is just -0.4%, highlighting how mild the downside has been relative to upside outcomes.
- TradeWave Ratio (TWR) of 2.07 and a Sharpe ratio of 1.79 point to strong, historically consistent upside in this long-biased MRK seasonal trend.
- Intraperiod swings have still mattered, with some years showing double-digit drawdowns before finishing higher, so timing and risk controls remain important.
According to historical data from TradeWave.ai, this midterm-year stretch in Merck & Co. has behaved very differently from an average calendar period, and the current cycle is already inside that regime.
How strong is Merck & Co. (MRK) in the current Sep–Apr seasonal window?
Merck & Co. has closed higher in 14 of the past 15 midterm-year windows running from Sep 5 to Apr 30, averaging 23.61% gains when it wins. Shares entered this year’s iteration at 150.33, leaving the stock about 4.2% below its 52-week high of 156.92 and up 42.82% year to date.[3] That combination of a powerful historical tailwind and a stock already near record territory makes this MRK seasonal trend hard for traders to ignore.
The election-cycle framing matters here. This pattern is built from the last 15 midterm election years, a phase where policy uncertainty often peaks before giving way to a more supportive backdrop as markets pivot into the pre-election year. For a defensive growth name like Merck & Co., that shift has historically lined up with sustained demand for large-cap healthcare exposure rather than the risk-off behavior many investors associate with midterms.
Across those 15 midterm-year samples, the trade direction is explicitly long. Percent Profitable sits at 93%, with 14 winners and just 1 loser, and the all-years average return of 22% is only slightly below the 23.61% average for winning years. That small gap tells you the lone down year, 2014, was shallow at -0.4%, while the positive years did most of the heavy lifting.
The per-year breakdown shows how that upside has played out. Strong cycles such as 1986, 1990 and 2022 delivered net gains of 34.78%, 34.22% and 37.56% respectively, while even the softer 2010 window still finished up 5.8%. The weakest outcome, 2014, barely dipped below flat, which is unusual for a long window that spans more than seven months.
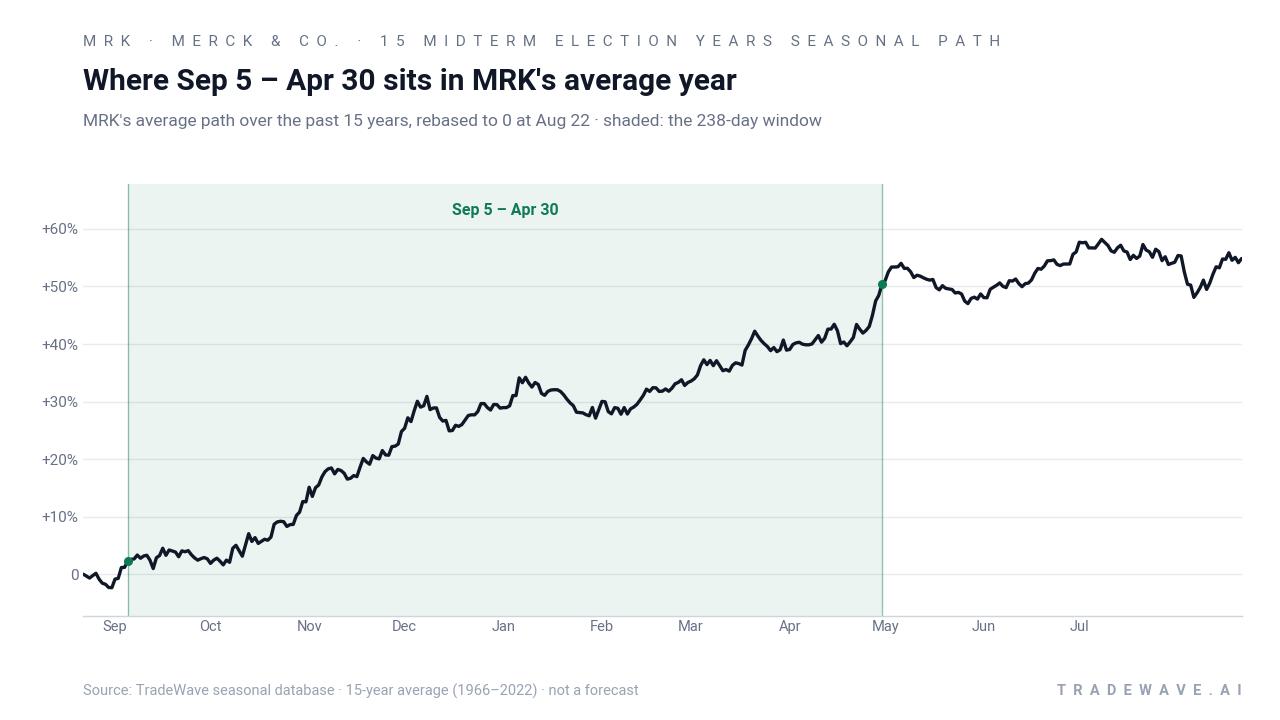
The historical seasonal average chart shows MRK’s path tending to grind higher through this window rather than spike in a single burst. Gains often build from early autumn, pause around year-end, then extend into the first months of the new year, which fits the pattern of investors rotating into healthcare as macro and policy headlines intensify.
Yearly net and intraperiod swings show how much room MRK has historically had to run and to pull back inside this window.
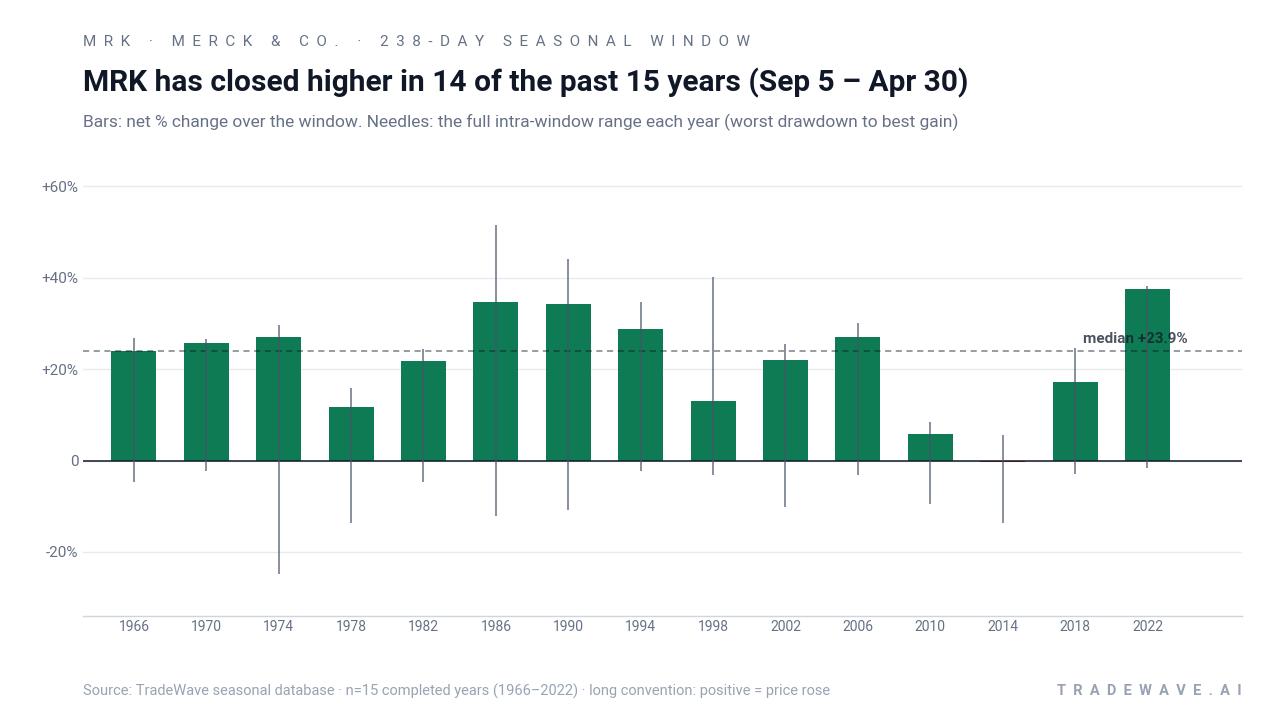
The combined net / maximum favorable move / maximum adverse move view shows why this long-biased pattern has appealed to trend followers. In strong years like 1986 and 2022, the best intraperiod rallies reached into the 38% to 51% zone, while the worst drawdowns from entry stayed contained in the low double digits. Even in the lone losing year, 2014, the worst drawdown was -13.58%, which is meaningful but not catastrophic for a 238-day holding period.
Put simply, this MRK seasonal window has been both consistent and powerful: 14 winners, one small loser, and a long-run compounded gain of 1,765% if you had only been exposed during these midterm-year Sep–Apr stretches. History does not guarantee a repeat, but that track record is unusually strong for a single stock pattern.
History does not guarantee future results; adverse excursions (MAE) can be large even in winning windows, and individual cycles can still break the pattern.
Why does Merck & Co. (MRK) follow this seasonal pattern?
One likely driver is the way Merck’s earnings calendar and drug news flow cluster around late autumn and early spring, which often pulls institutional money into the stock during this stretch. Analysts have also pointed to election-cycle dynamics, with midterm-year policy uncertainty pushing investors toward defensive growth sectors like healthcare before risk appetite broadens in the pre-election year. The pattern may also reflect portfolio rebalancing and sector rotation as large managers reset positions around year-end while keeping exposure to high-quality pharma names.
What is driving Merck & Co. (MRK) today?
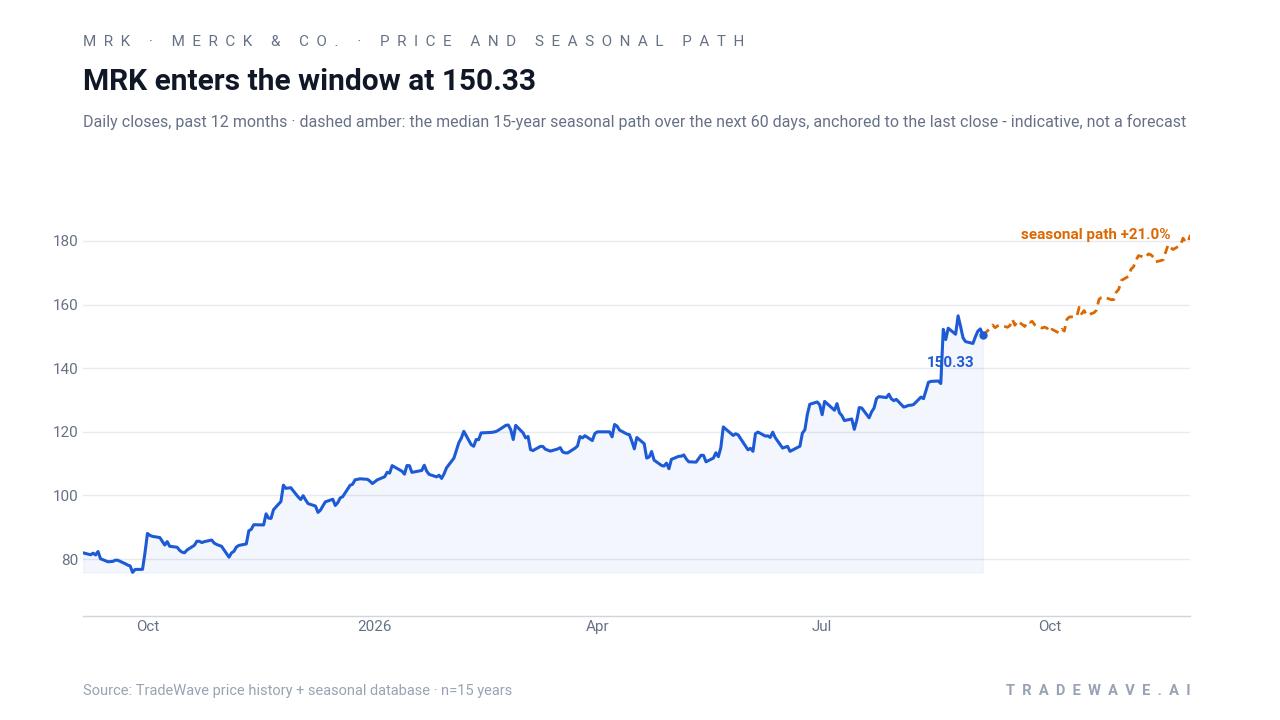
Merck & Co. closed Monday at 150.33, down 1.3% on the day, yet the stock remains up 42.82% so far in 2026 and about 4.2% below its 52-week high of 156.92.[3] That surge has been powered in part by back-to-back earnings beats, including Q2 2026 results on Aug 4 that topped revenue and EPS expectations and came with full-year guidance of $2.66 to $2.76 in EPS.[5] Earlier in the year, Merck also exceeded forecasts and narrowed its 2026 outlook, with analysts highlighting oncology blockbuster Keytruda and pulmonary arterial hypertension drug Winrevair as key growth engines.[4] Fresh analyst work reflects that strength, with MarketWatch citing an aggregated “Overweight” consensus and a FactSet / MarketWatch blended price target of 149.44 that the stock has already slightly surpassed.[1]
Positioning and flow data round out the picture. Barron’s reported in late August that short interest in MRK had fallen by 13.35% to 24.51 million shares, while trading volume in one snapshot ran at roughly 41% of the 10.7 million average, suggesting shorts have been backing away as the uptrend extended.[6] In April, GuruFocus also flagged roughly $40.1 million of insider selling over a three-month span, a reminder that some executives have been taking profits into strength rather than adding exposure at these levels.[4]
The chart below situates the latest move in its recent multi-month context and overlays the median seasonal path for the next two months.
What should traders watch in this MRK seasonal window?
First, the calendar. This window runs through Apr 30, so the key test is whether MRK can maintain its historical tendency to grind higher through year-end and into early 2027 rather than stalling after a strong year-to-date run. Price action around the 52-week high near 156.92 will be important: in prior cycles, strong years often saw the stock break to new highs early in the window and then consolidate rather than reverse sharply.
Second, watch how fundamentals track against expectations. Merck has already set its 2026 EPS guidance band, so any updates on Keytruda, Winrevair or the broader pipeline could shift sentiment quickly around the next earnings checkpoints.[4][5] A guidance raise or clean beat would rhyme with the historical pattern of strong midterm-to-pre-election windows, while a stumble could be the catalyst that finally breaks the 14-of-15 streak.
Third, monitor positioning and liquidity. The recent drop in short interest suggests bears have been squeezed out, which can reduce incremental buying fuel if the stock keeps grinding higher.[6] If short interest starts to rebuild or volume spikes back toward or above the 20-day average, that would signal a more two-sided tape and could make the intraperiod drawdowns seen in past windows more likely to repeat.
Finally, keep an eye on the broader policy and election backdrop. As the midterm election year concludes and the pre-election year begins, markets often shift toward a more risk-on stance, and healthcare’s role in that rotation can change quickly. If MRK continues to behave like it has in 14 of the last 15 midterm-year Sep–Apr windows, traders will be watching for a steady, trend-like climb with manageable pullbacks rather than a blow-off top or deep reversal.
Sources
- MarketWatch - MRK | Merck & Co. Inc. Analyst Estimates | MarketWatch
- GuruFocus / article referencing B of A Securities note - MRK Maintained by B of A Securities -- Price Target Raised to $141
- MarketWatch - MRK Stock Price | Merck & Co. Inc. Stock Quote (U.S.: NYSE) | MarketWatch
- GuruFocus - MRK: Merck Exceeds Earnings Expectations and Narrows FY26 Outloo
- MarketBeat - Merck & Co. Inc. (NYSE:MRK) Stock Price Expected to Rise, Wells Fargo & Company Analyst Says
- Barron's - Merck & Co. Inc. Research & Ratings | MRK
About this seasonal analysis
Seasonal pattern data is sourced from TradeWave.ai, which analyzes historical price behavior across annual calendar windows going back up to 30 years. Read the full data methodology or the book The 100-Year Pattern by Afshin Moshrefi (2026 edition). Past performance of seasonal patterns does not guarantee future results. This article is for informational purposes only and does not constitute investment advice.