Gold (COMEX) (GC) Has Rallied 6 of 6 Midterm Falls, Averaging 8.31% Gains in This 127-Day Window
Gold (COMEX) is trading well below its 52-week high as it heads toward a mid-September seasonal window that has delivered gains in every midterm election year in the sample, just as traders brace for fresh inflation data and Fed signals.
Price as of Aug 14, 2026: $4,373.10 (intraday).

What is the seasonal pattern for Gold (COMEX) (GC)?
Gold (COMEX) has risen in 6 of 6 midterm election years during the Sep 12 to Jan 16 window, with an average gain of 8.31% in winning years.
- 6 for 6 in this window, averaging 8.31% gains in winning years across the last 6 midterm election years.
- The upcoming window runs from Sep 12 to Jan 16, spanning 127 days that have historically favored long positions in GC.
- Percent Profitable is 100%, with 6 winners and 0 losers in the historical sample.
- Average profit of 8.31% per window stacks to a 61% cumulative gain when compounded across the six completed cycles.
- Intraperiod swings have been meaningful, with individual years showing double-digit peak run-ups and several percentage points of worst drawdown before finishing higher.
- The pattern is measured specifically in midterm election years, tying gold’s seasonal strength to a distinct phase of the U.S. political and policy cycle.
According to historical data from TradeWave.ai, this mid-September window in midterm election years has behaved very differently from an average stretch on the gold calendar, with a clear directional bias that traders often overlook.
How strong is the midterm-year fall seasonal window for Gold (COMEX) (GC)?
Gold (COMEX) has finished higher in every single Sep 12 to Jan 16 window across the last six midterm election years, averaging an 8.31% gain for long positions. Today the front-month GC contract settled at 4,373.20, down 0.8% on the session and about 21.7% below its 52-week high of 5,586.20, leaving plenty of room between spot prices and the highs seen earlier in the cycle.
Because this pattern is grouped by the presidential election cycle, it captures how gold has behaved specifically in midterm election years rather than in a generic calendar sample. That matters in 2026, which is itself a midterm election year, as markets juggle policy uncertainty, shifting fiscal priorities and the approach of the historically risk-on pre-election year that begins in 2027.
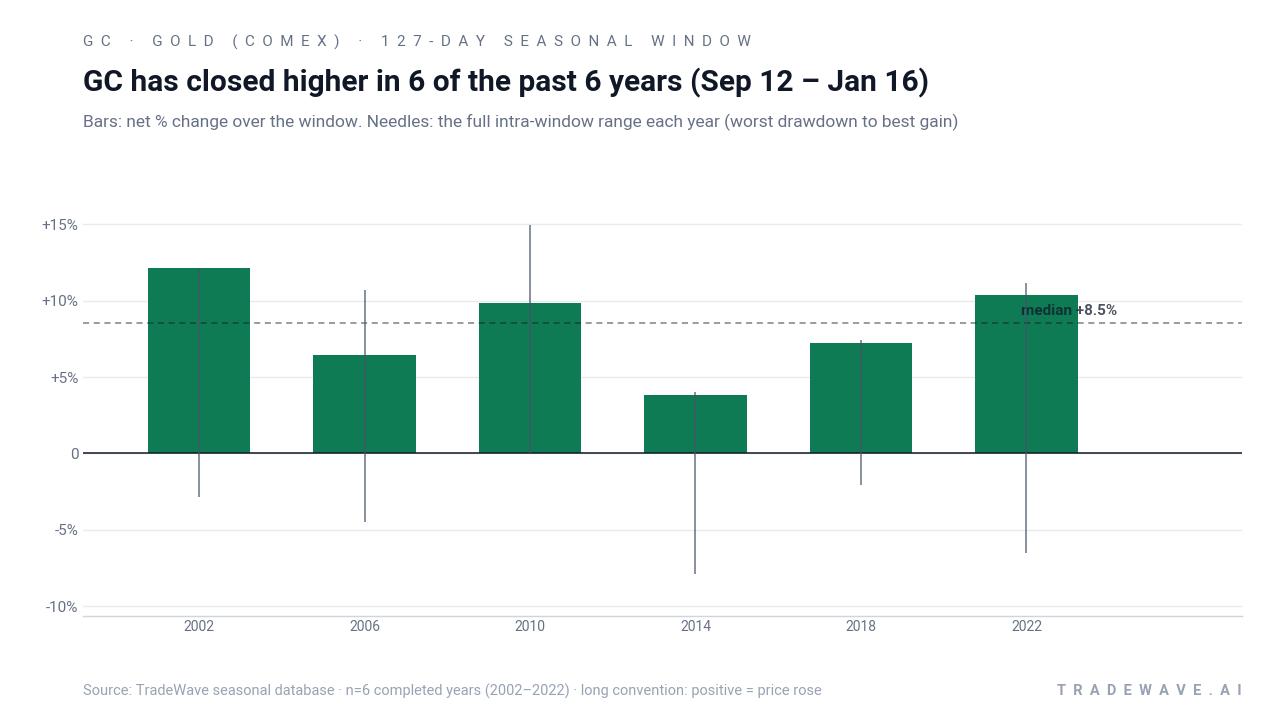
The upcoming seasonal window begins on Sep 12 and runs for 127 calendar days, carrying through to Jan 16. Across the six completed midterm-year samples from 2002 to 2022, Gold (COMEX) posted a positive net return in all six cases, with no losing years for the long trade direction. The average profit of 8.31% and median profit of 8.54% sit on top of a 61% cumulative gain when those windows are compounded, which is unusually consistent for a commodity that often trades in wide ranges.
Individual years show how that GC seasonal trend has played out. In 2002, the contract gained 12.17% from entry to exit, while 2010 delivered a 9.88% net return as gold surged through the heart of the financial-crisis recovery. The softest outcome in the sample came in 2014, when gold still managed a 3.82% gain despite a deeper intraperiod drawdown, underscoring that even the weaker midterm-year windows have historically finished in the green for longs.
Intraday and intra-window volatility has been part of the story. The best peak run-up within the window, or maximum favorable excursion, reached 14.94% in 2010, while several years saw double-digit upside at some point before the window closed. On the downside, the worst drawdown from entry, or maximum adverse excursion, reached as much as 7.88% in 2014 and 6.54% in 2022, showing that even winning windows have required traders to sit through meaningful pullbacks before the seasonal tailwind reasserted itself.
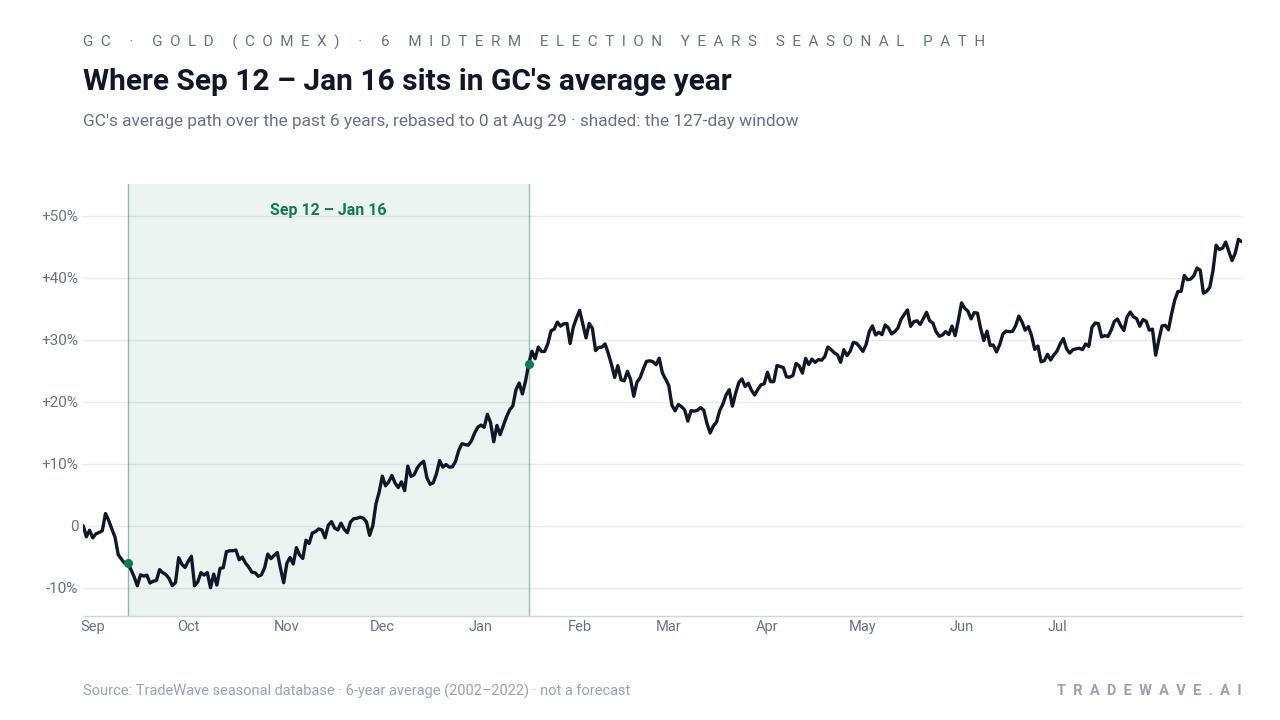
The historical seasonal average, summarized by the trend chart, shows gains that tend to build steadily rather than in a single burst. In prior midterm election years, gold has often started the window with choppy action, then picked up momentum into late Q4 and early January, which lines up with the traditional year-end risk and liquidity dynamics that often favor precious metals.
Year-by-year bars with full intraperiod ranges show how far GC has typically swung in both directions before closing higher.
History does not guarantee future results; adverse excursions can be large even in winning windows, and traders can experience sizable drawdowns before any seasonal tailwind plays out.
Why does Gold (COMEX) (GC) follow this seasonal pattern?
One likely driver is the way midterm election years cluster policy uncertainty, fiscal debates and Fed communication late in the year, which can boost demand for gold as a hedge. Analysts have also pointed to year-end portfolio rebalancing and central-bank reserve decisions that often concentrate in Q4, adding structural buying interest around this window.[2][6] On top of that, holiday-season liquidity and positioning shifts in broader commodities can amplify moves in GC when macro headlines line up with this historical seasonality.
What is driving Gold (COMEX) (GC) today?
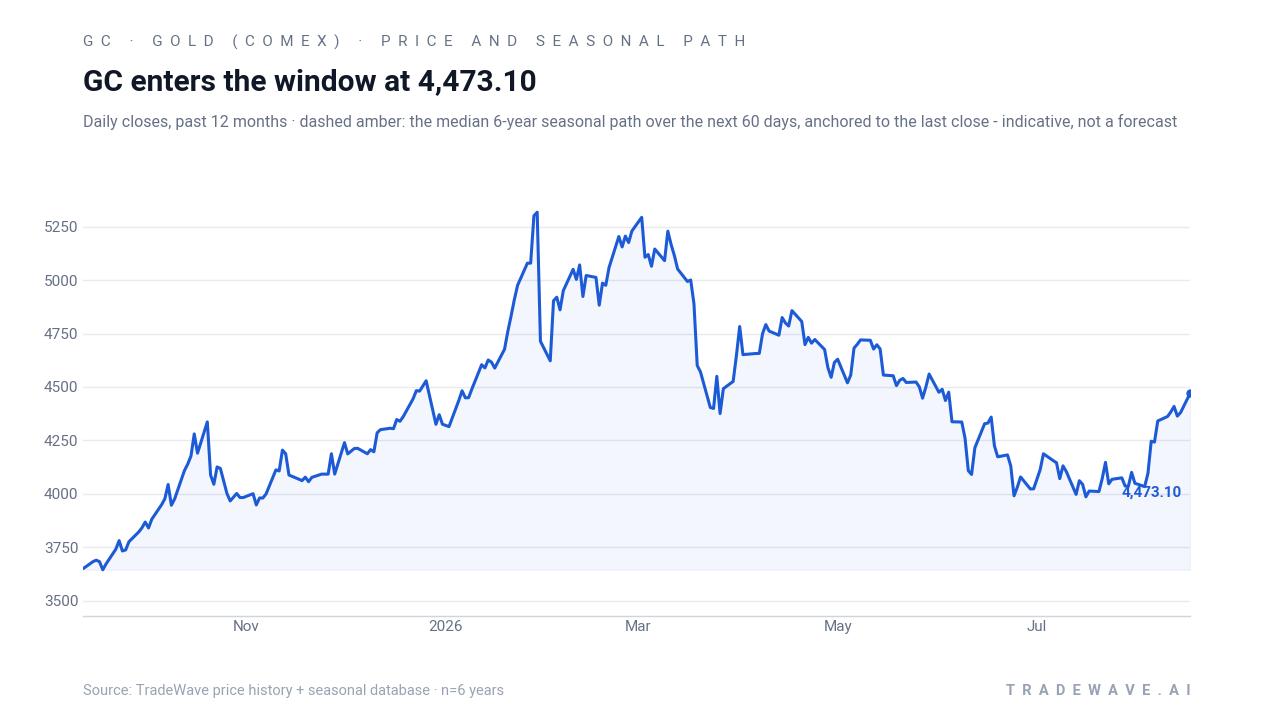
Front-month Gold (COMEX) futures settled at 4,373.20 on Friday, down 33.90 points or 0.8% on the day, after trading between 4,365.50 and 4,419.40. The contract has climbed 10.51% over the past month but remains about 21.7% below its 52-week high of 5,586.20, leaving it in a consolidation band after this year’s run-up.
Near term, traders are focused on upcoming U.S. inflation data, with July CPI and PPI prints expected to shape the Federal Reserve’s rate path and real-yield outlook, both key inputs for gold pricing.[2] A softer inflation profile that pulls real yields lower would tend to support bullion, while any upside surprise that revives talk of additional tightening could pressure the metal as carry in cash and bonds becomes more attractive.
Recent commentary has also highlighted the tug-of-war between central-bank demand and real interest rates. Strategists note that sustained buying by official institutions has underpinned gold on dips, even as periods of rising real yields and a stronger dollar have capped rallies and sparked debate over whether technical breakouts represent durable moves or bull traps.[1][6] In early August, technicians were watching gold’s interaction with key moving averages, including a breach of the 50-day and tests of the 200-day, as a litmus test for whether the latest advance had legs.[4]
Within the broader commodities and precious-metals complex, GC remains a reference point for risk sentiment and inflation hedging. Sector coverage has framed gold’s term structure and related ETF flows alongside silver and miners, with many investors using futures levels and nearby contract pivots as the cleanest read on how aggressively the market is willing to pay for protection against policy or macro shocks.[1][3]
The chart below situates the latest move in its recent multi-month context, alongside a historical seasonal projection for the next 60 days.
What should traders watch as this seasonal window approaches?
The first marker is the calendar itself. The Sep 12 start date is less than a month away, and the 127-day window runs straight through the heart of the midterm election year into early 2027, when markets transition into the historically stronger pre-election phase for risk assets. How gold behaves into and through that handoff will show whether this midterm-year seasonal pattern is still in force.
Macro-wise, the key checkpoints are the next few inflation releases, Fed meetings and any shifts in real yields. A sequence of softer CPI and PPI prints that drags real rates lower would rhyme with prior midterm-year windows that saw gold grind higher into year-end.[2][6] Conversely, a renewed back-up in real yields or a hawkish turn from the Fed could test the resilience of the historical GC seasonal trend and produce the kind of mid-window drawdowns seen in 2014 and 2022.
Price levels also matter. Traders will be watching how GC behaves around the 4,000 to 4,400 zone that recent technical work has framed as a wedge area, and whether any breakouts above resistance are confirmed by follow-through rather than fading quickly.[1][4][6] A sustained push that holds above key moving averages into late September would align with the long-biased seasonal window, while repeated failures at resistance could signal that macro headwinds are overpowering the pattern.
Finally, behavior inside the window will be the real test. If gold enters the Sep 12 to Jan 16 stretch and quickly shows a familiar profile of early chop followed by a late-year grind higher, that would be consistent with the last six midterm election years. A sharp, persistent selloff that breaks below recent support and fails to recover would mark a clear departure from the historical GC seasonal trend and remind traders that even a 6-for-6 record does not lock in a seventh win.
Sources
- Barchart – “Complacency in Gold May Be Hiding the Next Big Move” (Aug 9, 2026)
- Yahoo Finance (MarketWatch) – “Gold Makes Surprising Move on Fed Expectations” (Aug 13, 2026)
- Barchart – “Gold Dec '25 Futures Price - Barchart.com” (Dec 29, 2025)
- Barchart – “Gold Breaches 50-Day Moving Average: Real Rally or Bull Trap?” (Aug 5, 2026)
- Seeking Alpha – “Gold At The $4,000 Wedge: Central Banks, Real Rates And The Next Breakout” (Aug 10, 2026)
About this seasonal analysis
Seasonal pattern data is sourced from TradeWave.ai, which analyzes historical price behavior across annual calendar windows going back up to 30 years. Read the full data methodology or the book The 100-Year Pattern by Afshin Moshrefi (2026 edition). Past performance of seasonal patterns does not guarantee future results. This article is for informational purposes only and does not constitute investment advice.