Midterm August Lull: Short Trades in CBOE Volatility Index (VIX) Averaged 9.47% Profits
CBOE Volatility Index is entering a historically soft Aug 11–17 stretch in midterm years just as it trades in the mid-teens and equity volatility remains contained.
Price as of Aug 10, 2026: $15.46 (last close).

What is the seasonal pattern for CBOE Volatility Index (VIX)?
CBOE Volatility Index has fallen in 8 of 8 midterm-year Aug 11–17 windows, with an average 9.47% gain for short positions in winning years.
- 8 for 8 in this window, with short positions averaging 9.47% profit across the last eight midterm election years.
- Trade Direction: Short, meaning the historical edge has come from VIX drifting lower rather than spiking higher.
- Percent Profitable is 100%, with 8 winners and 0 losers across the sample.
- Average profit of 9.47% in winning years compounds to a 102% cumulative gain when the window is repeated over all eight cycles.
- The TradeWave Ratio (TWR) of 2.09 signals that VIX typically travels meaningfully in the trade direction within the 7-day window.
- A Sharpe ratio of 1.18 for this slice of the calendar points to a historically favorable risk‑adjusted profile for short volatility exposure.
According to historical data from TradeWave.ai, this specific August week in midterm election years has behaved very differently from an average summer stretch for volatility, and the next iteration is underway now.
How has CBOE Volatility Index (VIX) traded in the Aug 11–17 midterm window?
CBOE Volatility Index has closed lower in every single Aug 11–17 window across the last eight midterm election years, with short positions averaging 9.47% gains and no losing years. The index opened Tuesday’s session at 15.40 and last traded near 15.46, sitting well below its 52‑week high of 35.30 and modestly above the 52‑week low of 13.38. In the presidential cycle, that puts this week squarely in the midterm election year, a phase where policy noise often builds but, in this particular window, implied volatility has tended to bleed rather than explode.
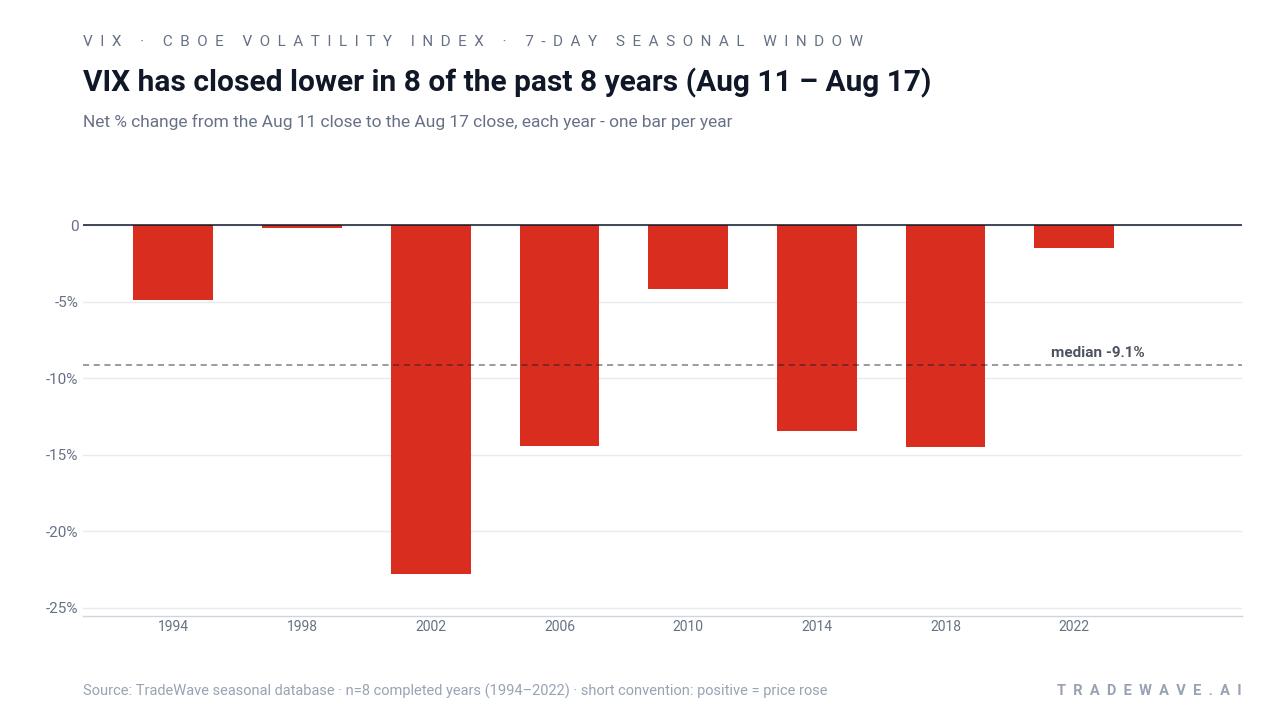
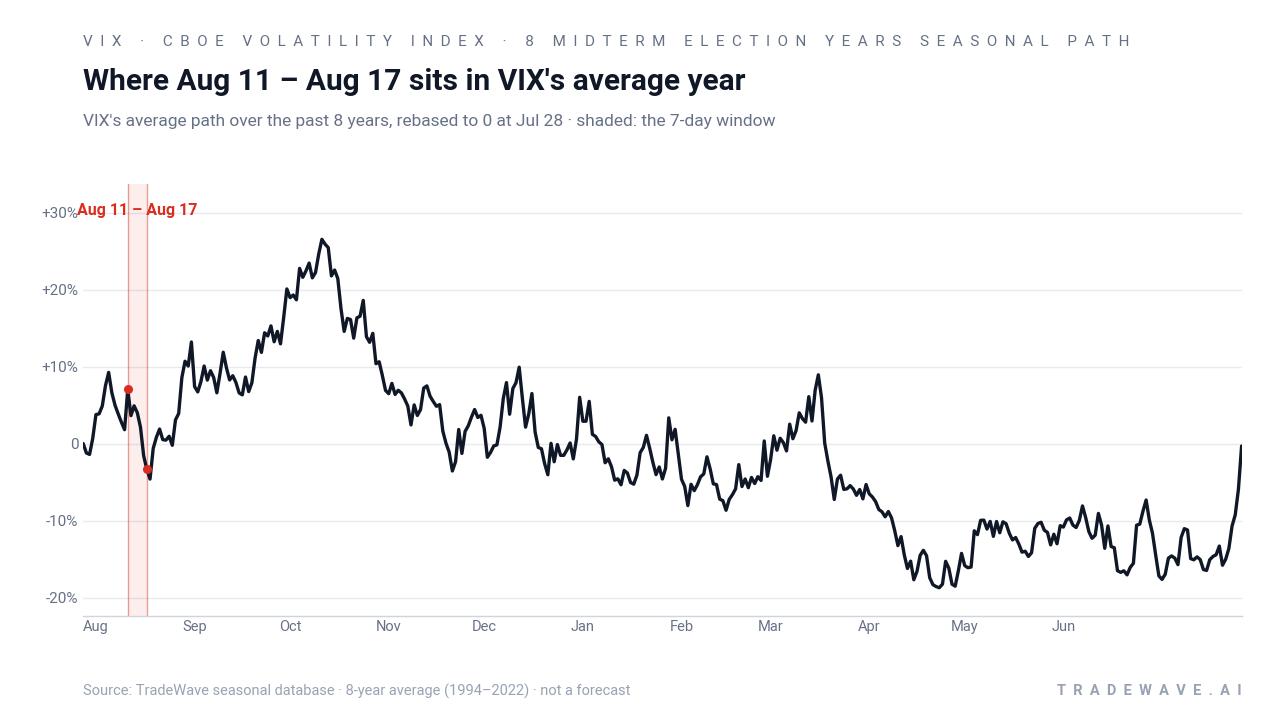
Grouping the data by the presidential election cycle matters here because the midterm year often brings a distinct mix of policy uncertainty and liquidity conditions that does not look like the election year or the year after. In this case, the Aug 11–17 VIX seasonal trend is drawn only from the last eight midterm election years, so the pattern reflects how volatility has behaved at this exact point in the political and policy calendar rather than in a generic August.
Across those eight midterm years, the average short profit of 9.47% comes with a median profit of 9.14%, which tells you the wins have been relatively consistent rather than driven by a single outlier. The cumulative return chart for repeatedly running this 7‑day window compounds to roughly 102% over the sample, which is what you get when a modest edge shows up again and again.
A closer look at yearly ranges shows how far VIX has tended to swing inside the window before settling lower.
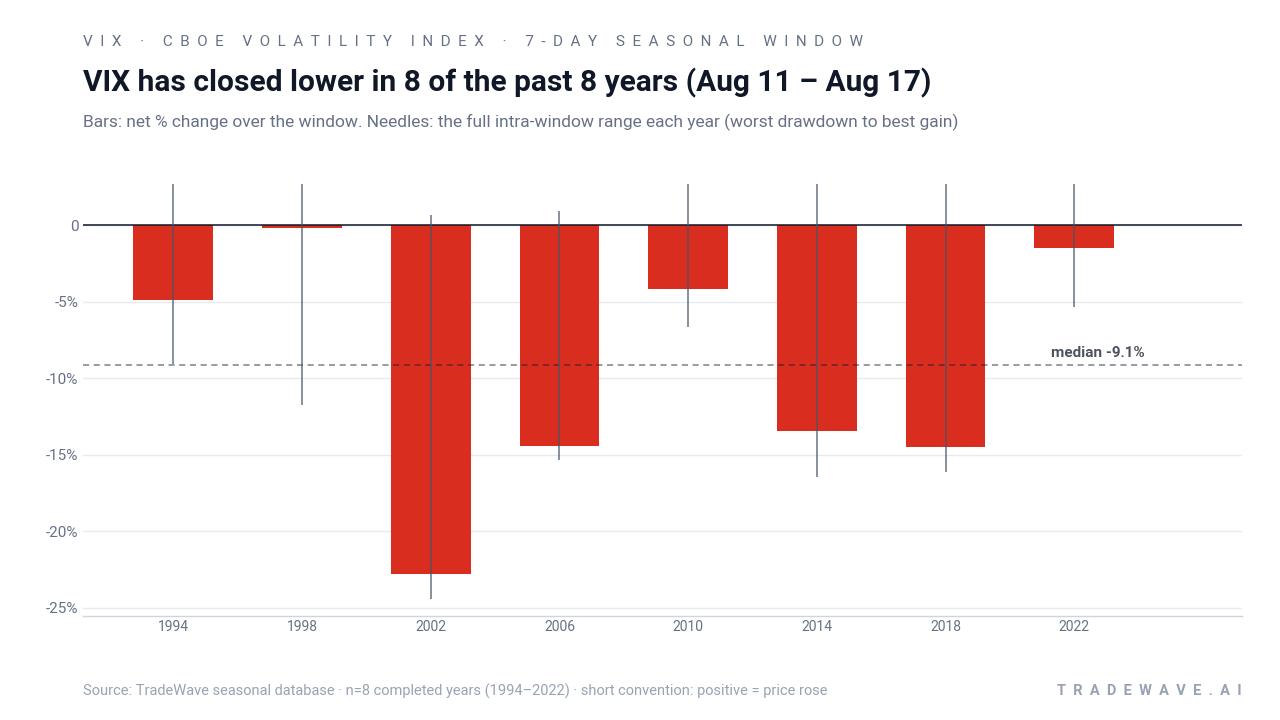
The per‑year breakdown shows why this is a short‑volatility pattern rather than a story of quiet markets. In 2002, for example, VIX fell 22.78% over the window, with the worst intraperiod drawdown against the short position reaching about 24.4% and the best favorable move only 0.7%. In 2018, the index still finished the week down 14.48%, but the best intraperiod spike against shorts reached 14.07%, underscoring that volatility can pop sharply before fading.
Across the sample, the maximum favorable move within each window has often been smaller than the maximum adverse move, which is typical for a volatility index that can spike quickly and then grind lower. That is where the TradeWave Ratio of 2.09 comes in: it captures how far VIX has tended to travel in the trade direction within the week, even when the final close does not fully reflect the intraday swings.
Put together, the pattern is clear: in the last eight midterm election years, this 7‑day August window has consistently rewarded short volatility exposure, but the path has rarely been smooth. History does not guarantee a repeat, yet eight for eight is a record that volatility traders will not ignore.
Why does CBOE Volatility Index (VIX) follow this seasonal pattern?
This midterm‑year August pattern may reflect a lull between early‑summer macro headlines and the heavier policy and earnings calendar that tends to build into September. Analysts have pointed to institutional portfolio rebalancing and options‑expiration dynamics that can suppress implied volatility when equity markets grind higher without fresh shocks.[7] In midterm years, that quiet often arrives just before the more volatile autumn stretch, which helps explain why this specific week has repeatedly seen VIX drift lower even as the broader year remains eventful.
History does not guarantee future results, and intraperiod swings in VIX can be large even in windows that have historically finished lower.
What is driving CBOE Volatility Index (VIX) today?
CBOE Volatility Index rose about 3.8% on Tuesday to 15.46, bouncing from the prior close of 14.90 but still trading in the lower half of its 2026 range between roughly 14.43 and 35.30.[7] That keeps VIX closer to its 52‑week low of 13.38 than its 52‑week high of 35.30, consistent with a backdrop where equity indices have pushed to or near record levels and implied volatility has stayed subdued.[7] In 2026, volatility spikes have tended to be episodic and tied to geopolitical headlines, while more recent weeks have seen the index “sleep” in the mid‑teens even as Nasdaq‑focused volatility gauges such as VXN run hotter, pointing to more concentrated stress in tech than in the broader market.[6]
The chart below shows how that mid‑teens reading fits into the past year of VIX moves and the typical seasonal path from here.
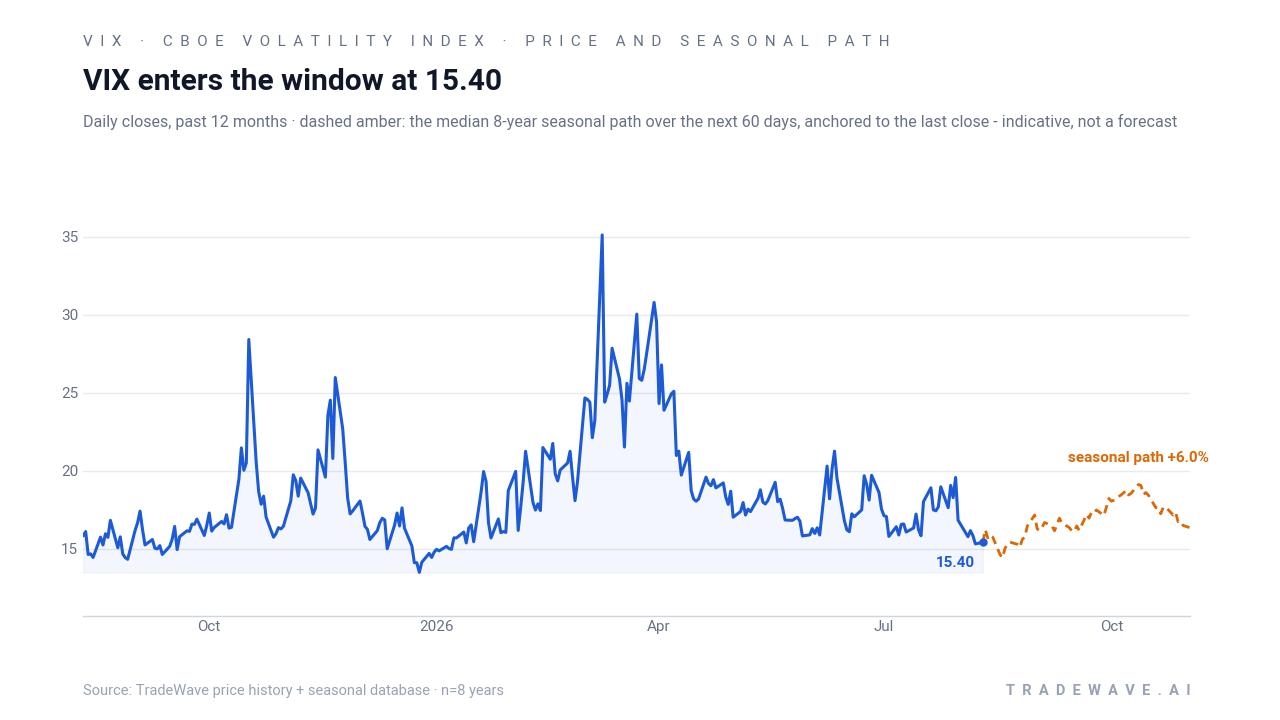
For equity traders, a mid‑teens VIX typically signals a market that is calm but not complacent, with options pricing in modest daily swings rather than crisis‑level moves. The divergence between VIX and Nasdaq‑focused VXN means index‑level volatility hedges may look cheap relative to single‑sector risk, which has supported option‑income strategies that lean on selling index volatility while being more selective in tech.[6] Because implied volatility tends to spike when equities sell off and compress when stocks grind higher, this week’s historically soft VIX window is one more reason traders are watching whether the calm holds or gives way to a late‑summer shock.
What should traders watch in this Aug 11–17 VIX window?
First, watch whether VIX respects the historical pattern of drifting lower through the Aug 11–17 midterm window or instead breaks higher against the seasonal grain. A sustained move back toward the high teens or low 20s would contradict the eight‑for‑eight record and signal that macro or policy shocks are overwhelming the usual late‑summer calm.
Second, monitor how the divergence between VIX and Nasdaq volatility evolves. If VXN remains elevated while VIX stays pinned near the mid‑teens, it would reinforce the idea that stress is concentrated in tech rather than broad risk‑off, which historically has been compatible with a soft VIX seasonal trend.[6] If both gauges start to climb together, that would be an early sign that the market is transitioning out of this historically benign window into a more volatile pre‑autumn regime.
Third, keep an eye on the policy and data calendar into late August and September. The midterm election year often sees volatility pick up as investors digest fiscal debates, regulatory headlines, and central‑bank messaging, even if this particular week has usually been quiet.[7] A VIX that stays contained through Aug 17 would be consistent with the historical seasonality, while an early break higher would suggest that the 2026 macro backdrop is rewriting the script.
Sources
About this seasonal analysis
Seasonal pattern data is sourced from TradeWave.ai, which analyzes historical price behavior across annual calendar windows going back up to 30 years. Read the full data methodology or the book The 100-Year Pattern by Afshin Moshrefi (2026 edition). Past performance of seasonal patterns does not guarantee future results. This article is for informational purposes only and does not constitute investment advice.