CBOE Volatility Index (VIX) Has Risen in 7 of 8 Midterm Sep 13-Oct 3 Windows
CBOE Volatility Index is hovering near 15 as it heads toward a late-September window that has historically delivered sharp volatility spikes during midterm election years.
Price as of Aug 17, 2026: $15.19 (last close).

What is the seasonal pattern for CBOE Volatility Index (VIX)?
CBOE Volatility Index has risen in 7 of 8 midterm-year Sep 13–Oct 3 windows, with an average gain of 8.73% in winning years.
- 7 for 8 in this window, with winning years averaging 8.73% gains and a 68% cumulative return across the sample.
- Percent Profitable is 88%, with 7 winners and 1 loser across the last 8 midterm election years in this 21-day stretch.
- Avg Profit - All, which includes the lone losing year, still comes in at 7%, pointing to a strong upside bias for long volatility exposure.
- The upcoming window runs from Sep 13 to Oct 3 and has historically seen VIX jump as much as 27% inside the period in strong years.
- Adverse moves have also been meaningful, with worst intraperiod drawdowns in some years approaching the mid-teens in % terms before VIX recovered.
- Sharpe ratio of 1.07 and a TradeWave Ratio of 3.39 suggest a historically favorable but jumpy VIX seasonal trend into late September.
According to historical data from TradeWave.ai, this late-September stretch has behaved very differently from an average month for volatility. The next section walks through how that pattern has played out in prior midterm election years and what it means for the coming window.
How has CBOE Volatility Index (VIX) behaved in the Sep 13–Oct 3 window?
CBOE Volatility Index has closed higher in 7 of the last 8 midterm-year windows from Sep 13 to Oct 3, making this one of the most consistently bullish stretches for long volatility in the election cycle. VIX finished the prior session at 15.19, up 6.6% on the day and sitting well below its 52-week high of 35.30 but above the 52-week low of 13.38. That leaves the index about 57.0% under its 52-week high and roughly 13.5% above its 52-week low, a pocket where even modest seasonal spikes can feel outsized against a calm equity backdrop.
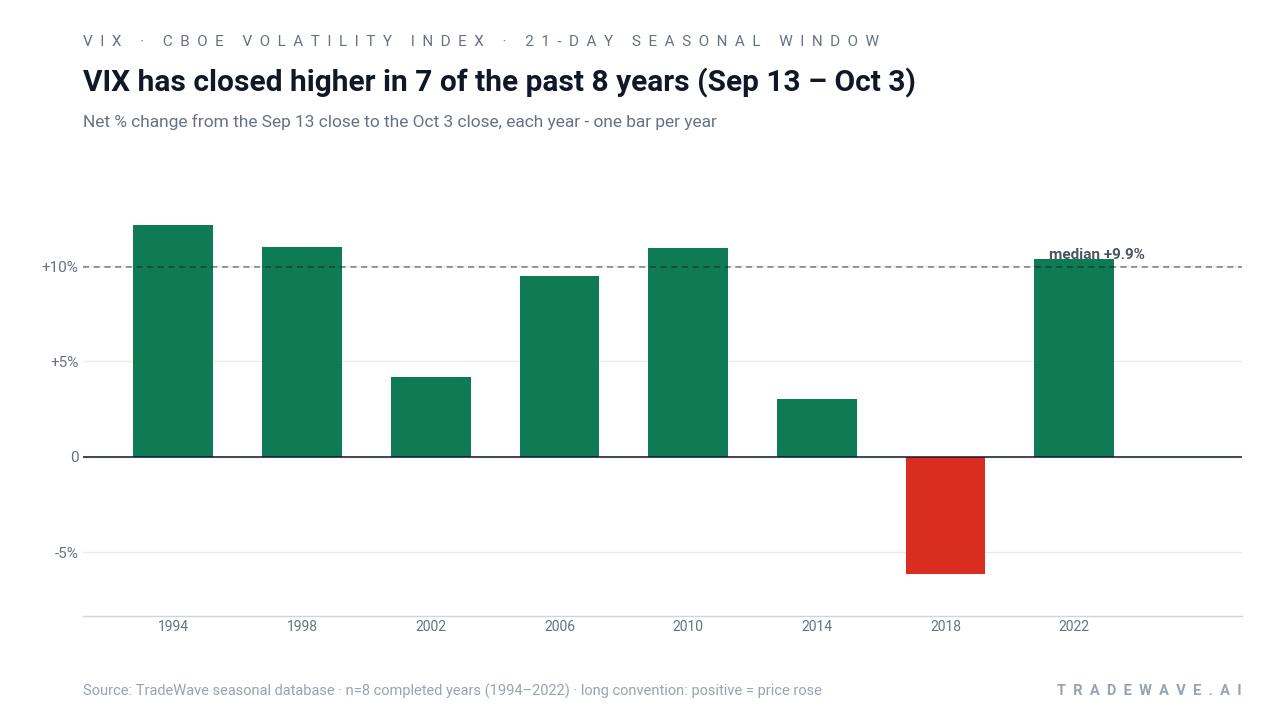
Because this pattern is grouped by the presidential election cycle, it reflects how volatility has behaved specifically in the last eight midterm election years rather than in a run of consecutive calendar years. Midterm years often feature policy uncertainty around fiscal debates and regulation, and this late-September slot sits just as markets start to look ahead to the stronger risk-on tendencies that have historically shown up in the following pre-election year.
Historically, the trade direction for this window has been long, meaning the pattern is defined around VIX rising rather than compressing. Percent Profitable of 88% with 7 winners and 1 loser is a strong record for any volatility index, especially given that the sample spans very different macro regimes. Average profit in winning years is 8.73%, while including the losing year pulls Avg Profit - All down only slightly to 7%, which still points to a meaningful upside tilt for implied volatility during this slice of the calendar.
The per-year breakdown shows how that upside has arrived. In 1994, VIX gained 12.13% over the window, with a maximum favorable move of 19.10% and a maximum adverse move of -16.99% from the entry. In 2014, the net gain was a modest 3.05%, but the index swung as high as 27.34% above the entry at one point and as low as -18.41% below it before settling, underscoring how choppy this period can be even when the final result is positive.
The lone losing year in the sample, 2018, saw VIX finish the window down 6.14% despite a maximum favorable move of 11.16% and a worst drawdown of -10.27%. That profile is a reminder that even in a historically strong seasonal window, volatility spikes can fade quickly if the equity market stabilizes. For long volatility positioning, those reversals matter as much as the final close.
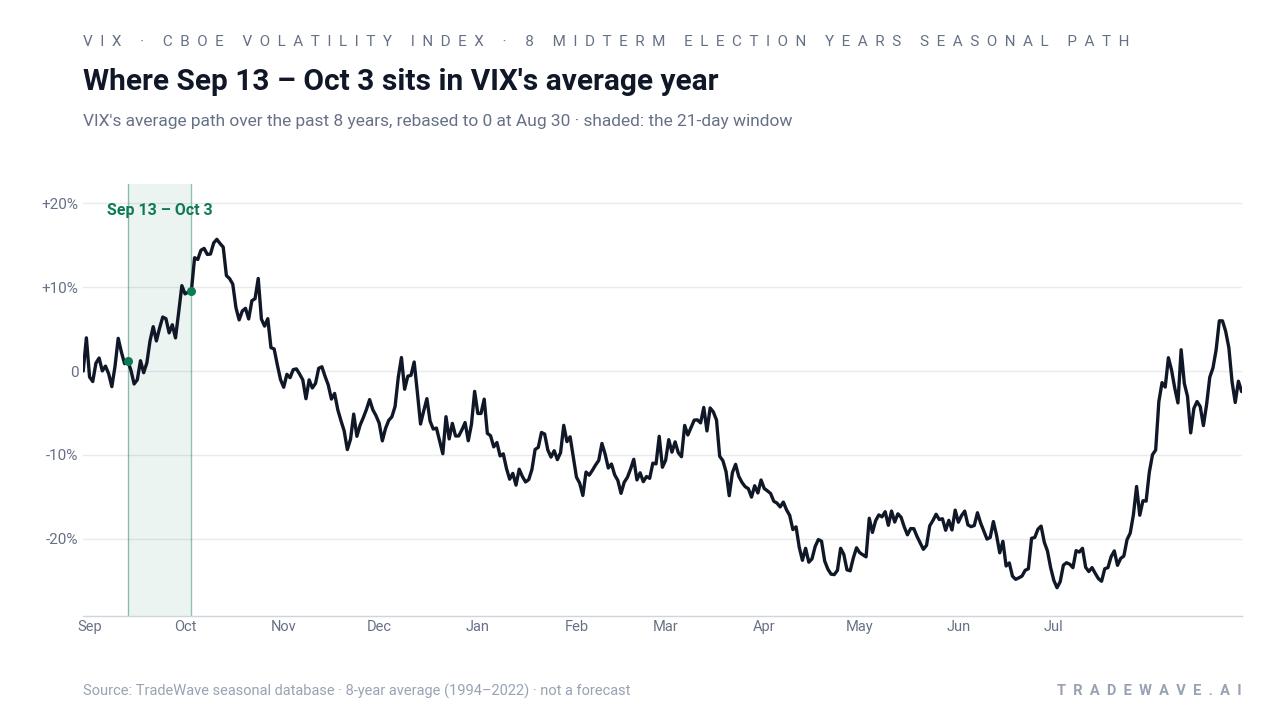
A second view, combining net returns with intraperiod ranges, shows how far VIX has typically swung inside this window.
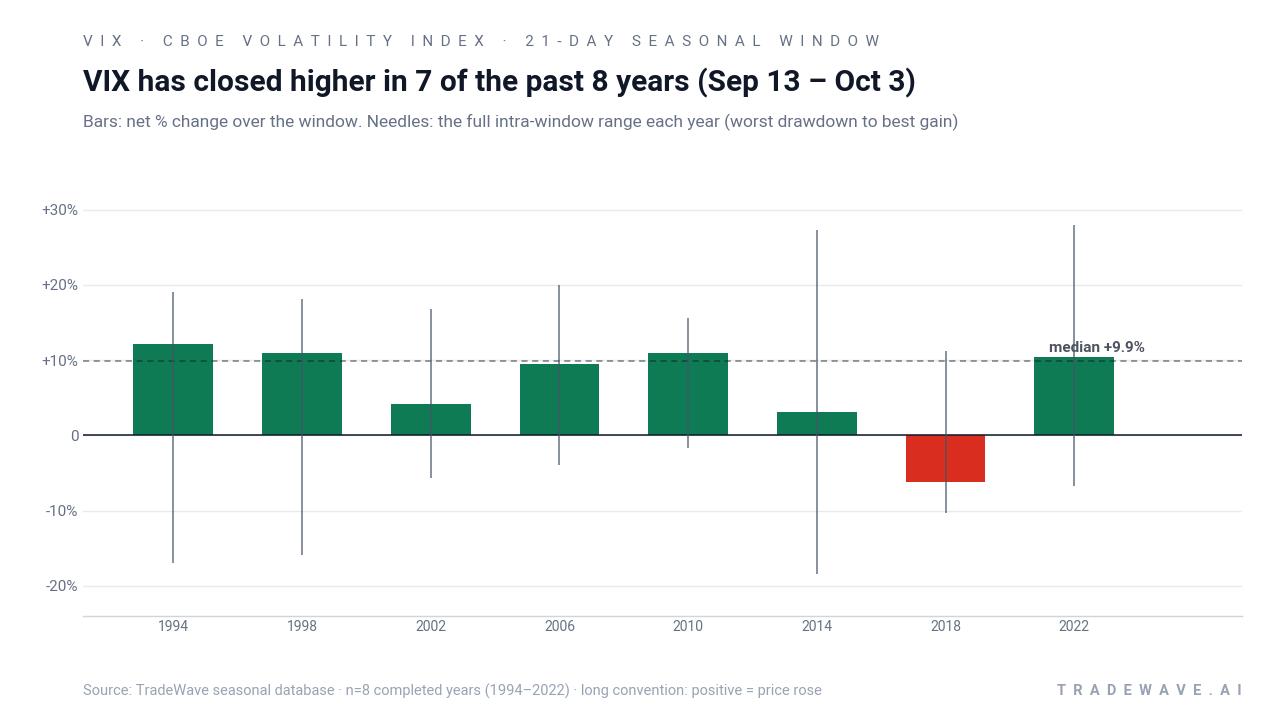
The stacked net, maximum favorable move and maximum adverse move profile shows that in most years VIX has enjoyed double-digit intraperiod rallies even when the final close was more muted. Large maximum favorable excursions alongside sizable maximum adverse excursions point to a high-variance window where volatility can both surge and retrace quickly. Add it up: across eight midterm election years, repeatedly stacking this 21-day stretch would have compounded to roughly 68% cumulative gains for long volatility exposure.
History does not guarantee future results, and the worst intraperiod drawdowns in this window have been large enough that even winning years carried meaningful downside risk along the way.
Why does CBOE Volatility Index (VIX) follow this seasonal pattern?
One likely driver is the clustering of policy and macro catalysts into late September of midterm election years, when Congress returns from recess and budget, debt ceiling or regulatory debates often come back into focus. Analysts have also pointed to institutional portfolio repositioning ahead of the fourth quarter, which can amplify hedging flows in index options and lift implied volatility. This pattern may also reflect the approach of major options expirations and earnings pre-announcement season, both of which can nudge investors to pay up for protection just as liquidity thins after the summer.
What is driving CBOE Volatility Index (VIX) today?
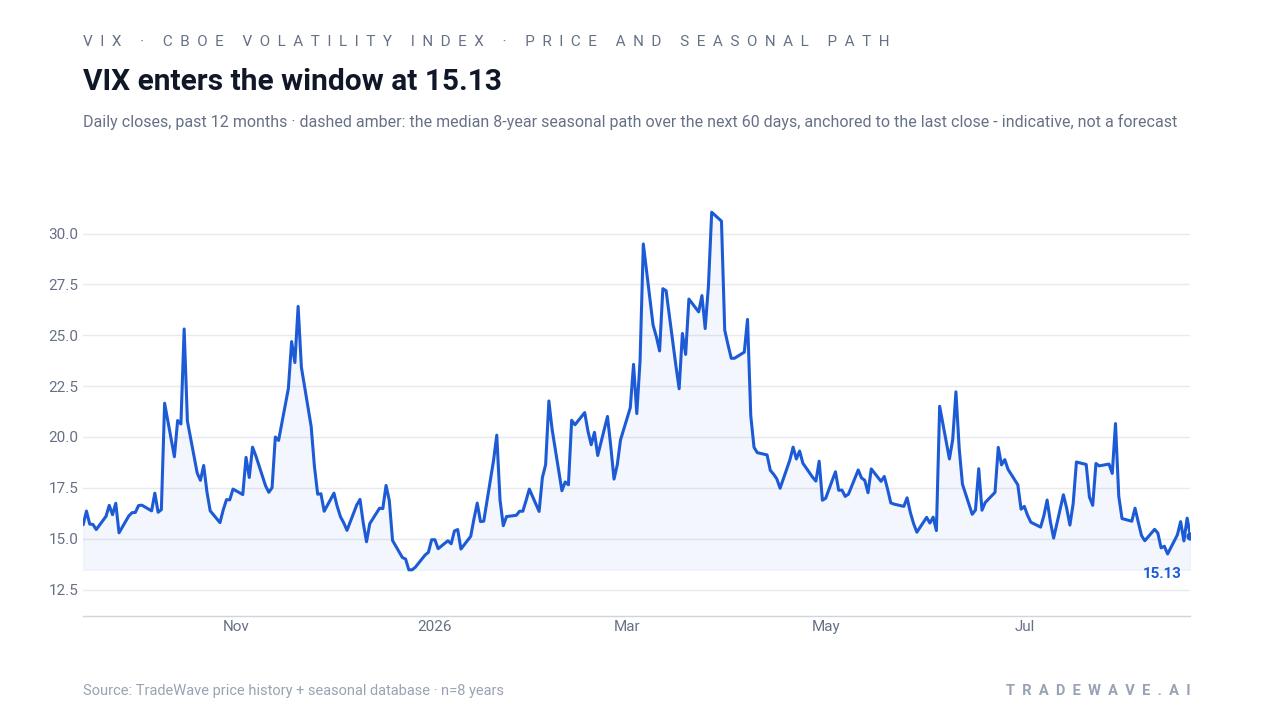
CBOE Volatility Index ended the prior session at 15.19, up 0.94 points or 6.6% on the day, after trading between 14.89 and 15.47. That leaves VIX well below its 50-day moving average of 17.02, suggesting implied volatility remains subdued compared with early-summer levels even after Monday’s pop. In simple terms, equity markets are still pricing a relatively calm near-term environment, which is exactly the kind of backdrop where a historically jumpy seasonal window can catch investors leaning the wrong way.
The chart below shows how the latest move fits into the past year of VIX action, alongside the median seasonal path for the next two months.
What should traders watch as the Sep 13 window approaches?
First, the calendar. The Sep 13 start date is less than a month away, and it lands in the concluding phase of the midterm election year, when Washington’s fiscal and regulatory agenda often heats up again. Any shift in the policy calendar that pulls contentious votes or hearings into late September could reinforce the historical pattern of higher implied volatility in this stretch.
Second, levels. On the downside, the 13–14 zone has been the recent floor; if VIX drifts back toward that band before the window opens, the gap between spot and its historical seasonal tendency will widen. On the upside, prior midterm-year windows have seen intraperiod spikes in the mid-teens to high-20s in % terms, so traders will be watching whether any move above the 50-day moving average near 17 starts to accelerate or stalls out quickly.
Third, behavior inside the window. A VIX that grinds sideways or fades lower through late September would contradict the historical seasonality and suggest that macro and policy risks are being absorbed more smoothly than in past midterm cycles. By contrast, a pattern of sharp, intraday volatility spikes that hold into the close would be more in line with the 7-for-8 record and the large maximum favorable excursions seen in prior years.
Finally, cross-asset context matters. VIX typically rises when equities sell off or when investors rush to buy index options as protection, so any pickup in downside pressure on major indices or in put buying around key macro events would be a tell that the seasonal script is starting to play out. The key for traders over this 21-day window will be whether volatility spikes are quickly sold or whether they persist, which has historically separated the strongest years in this pattern from the lone loser.
Sources
About this seasonal analysis
Seasonal pattern data is sourced from TradeWave.ai, which analyzes historical price behavior across annual calendar windows going back up to 30 years. Read the full data methodology or the book The 100-Year Pattern by Afshin Moshrefi (2026 edition). Past performance of seasonal patterns does not guarantee future results. This article is for informational purposes only and does not constitute investment advice.