15-for-15: Merck & Co. (MRK) Has Never Lost in This 139-Day Midterm Fall Rally Window
Merck & Co. is hovering near a 52-week high just as it approaches a 139-day midterm-year seasonal window that has never produced a loss in the past 15 cycles.
Price as of Aug 17, 2026: $135.97 (last close).

What is the seasonal pattern for Merck & Co. (MRK)?
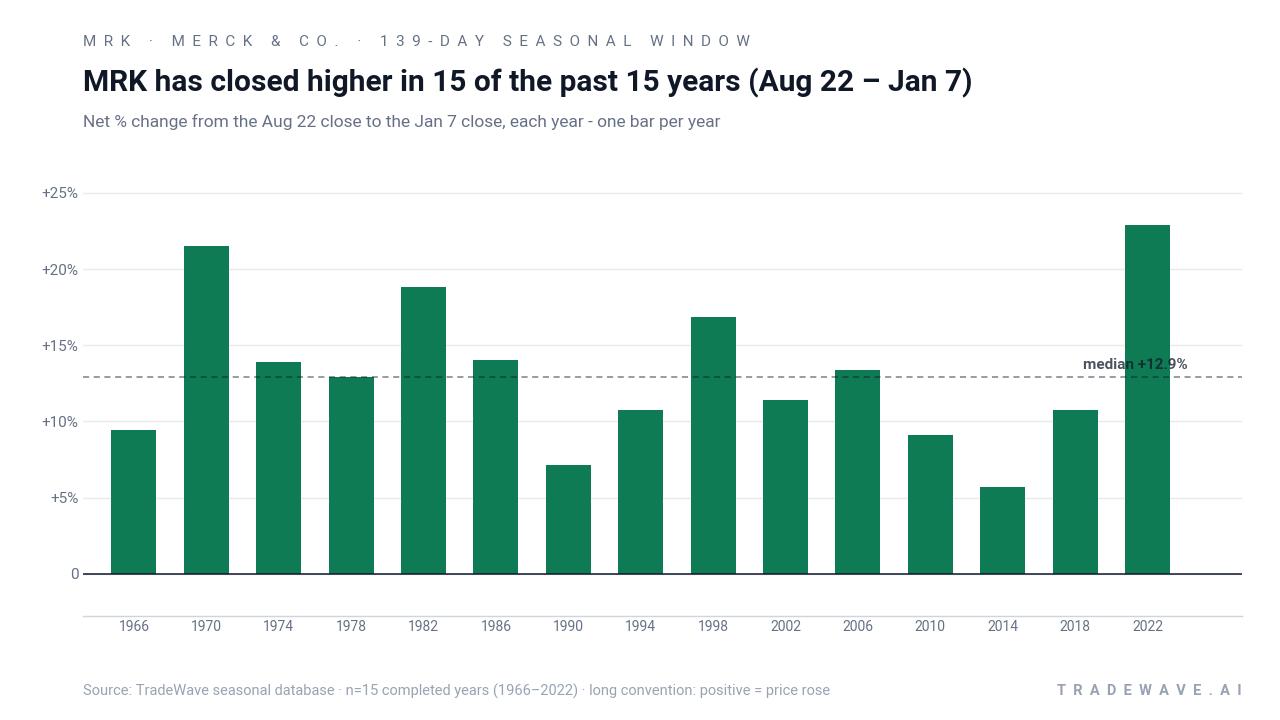
Merck & Co. has risen in 15 of 15 midterm-year Aug 22–Jan 7 windows, with an average gain of 13.24% in winning years.
- 15 for 15 in this window, averaging 13.24% gains in winning years across the last 15 midterm election cycles.
- Seasonal window runs from Aug 22 through Jan 7, spanning 139 calendar days in the heart of the midterm election year.
- Percent Profitable is 100%, with 15 winners and 0 losers for the long trade setup in this MRK seasonal trend.
- Avg Profit of 13.24% reflects all years in the sample, since every historical window finished positive for Merck & Co.
- TradeWave Ratio of 2.64 indicates price has typically traveled meaningfully in the trade direction within the window, while a Sharpe ratio of 2.35 points to strong risk-adjusted returns.
- Intraperiod swings have included sizable drawdowns in some years, so the historical seasonality comes with real volatility even in a perfect win record.
According to historical data from TradeWave.ai, this midterm-year stretch has behaved very differently from an average few months on the calendar for Merck & Co. The next section walks through how that pattern has played out and what it means as the 2026 window approaches.
How has Merck & Co. (MRK) traded in past midterm-year fall windows?
Merck & Co. has finished higher in every single Aug 22 to Jan 7 window across the last 15 midterm election years, averaging a 13.24% gain for the long side. Shares closed Monday at 135.97, essentially at a fresh 52-week high of 137.17 and about 83.5% above the 52-week low of 74.08, after climbing 5.6% year to date. That combination of a clean seasonal record and a stock pressing new highs gives this upcoming 139-day Merck & Co. trading window unusual weight for investors watching the healthcare sector’s seasonal outlook.
Because this pattern is grouped by the presidential election cycle, it only looks at midterm election years, not a simple run of consecutive calendar years. That matters for a large healthcare stock like Merck & Co., since policy risk, drug pricing debates and fiscal priorities tend to flare in midterm seasons, shaping how big pharma trades around the turn of the year.
The trade direction for this setup is explicitly long. Across the 15 completed midterm-year windows, Percent Profitable is 100%, with 15 winners and 0 losers, and an Avg Profit of 13.24% that already bakes in the softer years. The median outcome of 12.93% sits close to the average, which suggests the gains have been fairly clustered rather than driven by a single outlier year.
Individual years still show a wide range of paths. In 2022, Merck & Co. gained 22.87% from the Aug 22 entry to the Jan 7 exit, with a maximum favorable move of 28.56% at the best point in the window and a worst drawdown of 6.68% from entry along the way. At the other end of the spectrum, 2014 delivered a modest 5.68% net gain, but the stock was down as much as 10.64% at one point before recovering into the close of the window.
The maximum favorable move and maximum adverse move profiles underline that this has been a “grind higher with real dips” pattern rather than a straight line. Years like 2002 saw a net gain of 11.38% but endured an intraperiod drawdown of 18.81% from the starting level, while 1998 posted a 16.85% net return with a 24.09% best run-up and a 12.46% worst pullback. For traders, that mix means the historical seasonality has rewarded patience but has not spared volatility.
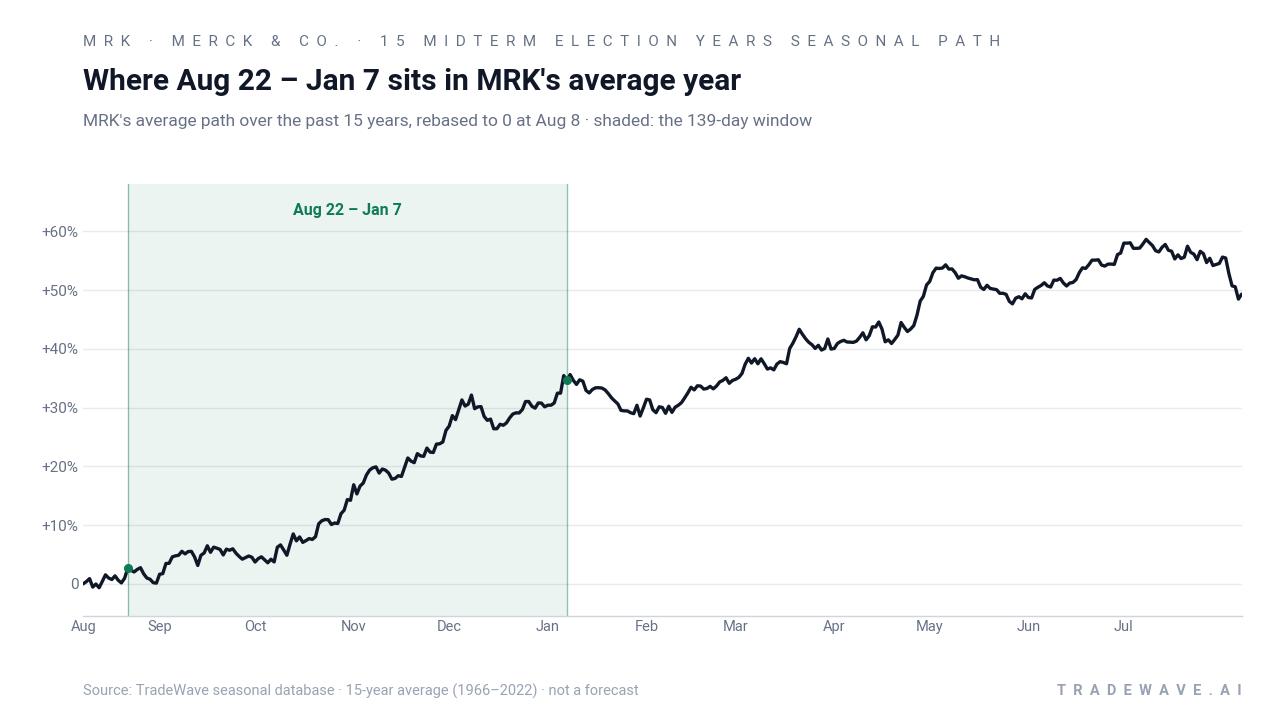
The historical seasonal average shows Merck & Co. typically firming into late August, then building gains through the fall and into early January, with the steepest part of the climb often occurring in the middle of the window. That pattern lines up with a period that captures late-year portfolio repositioning, year-end healthcare budget flush and early positioning for the pre-election year.
Yearly net and intraperiod swings show how consistently MRK has finished higher while still experiencing meaningful drawdowns inside the window.
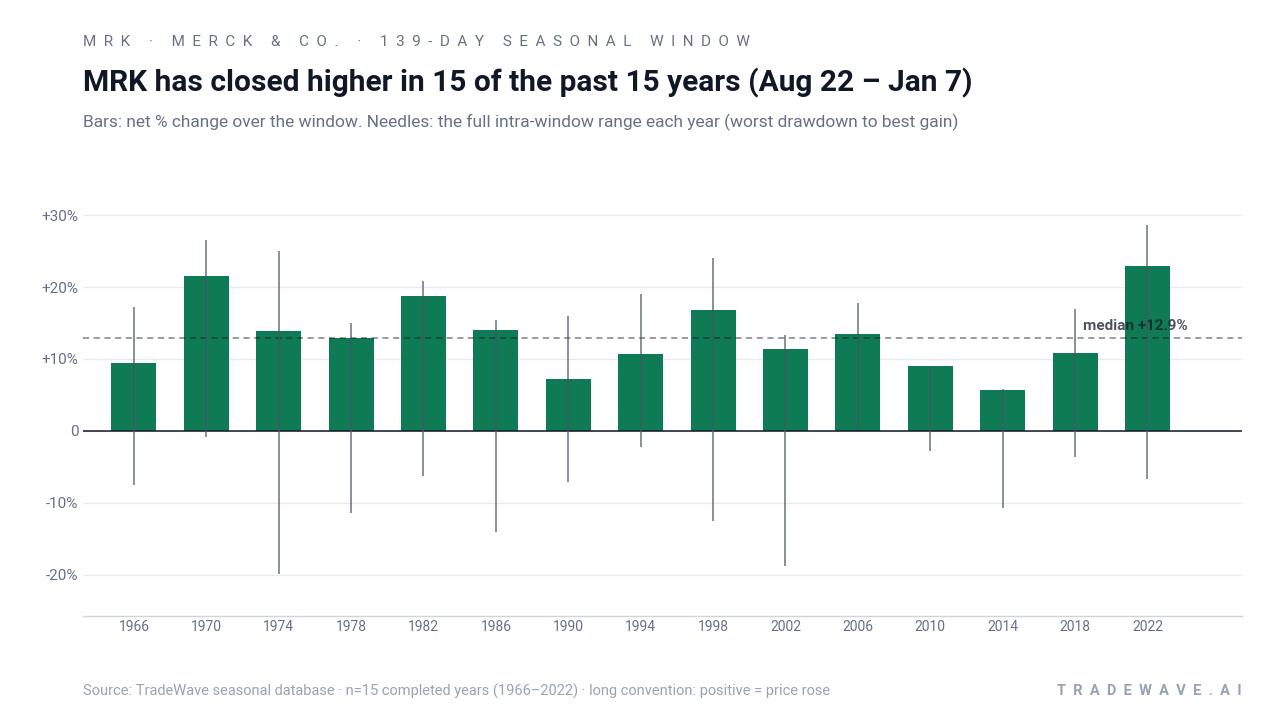
The combined net-return and range chart makes the pattern clear: every bar ends above zero, but the needles show that Merck & Co. has often swung several percentage points both up and down before finishing the window in the green. Add it up and stacking this 139-day window across the 15 midterm election years compounds to roughly 536% cumulative gains, a rare clean streak for a large-cap stock.
History does not guarantee future results; even in a perfect win record, the worst intraperiod drawdowns have been large enough to test conviction.
Why does Merck & Co. (MRK) follow this seasonal pattern?
One likely driver is the way healthcare and big pharma sit at the center of midterm-year policy debates, which can front-load uncertainty early in the year and clear the way for risk-taking into the fall. Analysts have also pointed to year-end portfolio rebalancing and sector rotation, as institutions add defensive growth names like Merck & Co. ahead of the pre-election year. The pattern may also reflect the clustering of major oncology data readouts and regulatory decisions in the back half of the year, which can concentrate stock-moving news inside this window.
What is driving Merck & Co. (MRK) today?
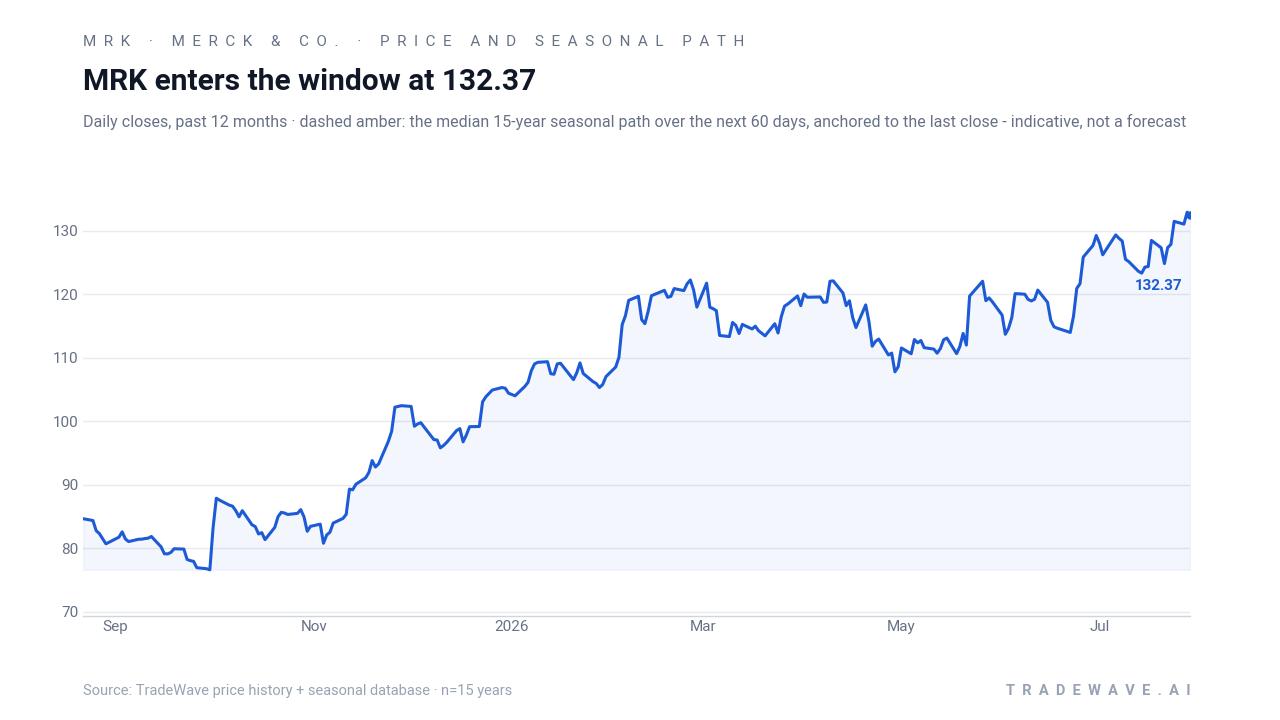
Merck & Co. ended the prior session at 135.97, up 0.1% on the day, leaving the stock about 0.9% below its 52-week intraday high of 137.17 and roughly 83.5% above its 52-week low of 74.08. The move caps a 9.3% gain over the past month on 20-day average volume of about 8.25 million shares, with the stock trading comfortably above its 50-day moving average near 125.59. Short interest data updated on Aug 15, 2026 shows Merck & Co.’s short position fluctuating through 2025 and into early 2026, with shares sold short rising from 32.57 million at Dec 31, 2025 to 33.65 million by mid-January 2026, a reminder that some investors continue to lean against the rally even as the stock grinds higher.[5]
In January 2026, Merck outlined a long-term plan to generate about $70 billion in revenue from new growth drivers by the mid-2030s, highlighting cardiometabolic, respiratory and infectious disease franchises as key pillars alongside oncology.[3] That strategic message followed a 2025 stretch in which Keytruda remained the blockbuster engine, with Q3 2025 revenue of $17.28 billion and adjusted EPS of $2.58 beating estimates as Keytruda sales grew around 10% to $8.1 billion while Gardasil declined.[2] In late 2025, regulators in the United States and Europe also expanded the Keytruda franchise, including an FDA approval for a Keytruda plus Padcev regimen in muscle-invasive bladder cancer and the EU launch of subcutaneous Keytruda (QLEX), both of which reinforced Merck & Co.’s oncology leadership story.[1]
That backdrop helped fuel a powerful run into the turn of the year. In Dec 2025, Forbes highlighted a five-day winning streak that added roughly 6.9% to the share price and about $17 billion in market value, alongside a BMO upgrade tied to positive Phase 3 KEYNOTE-B15 trial results that strengthened confidence in the oncology pipeline.[4] While those headlines are months old, they frame why Merck & Co. remains a favored large-cap healthcare name as investors weigh the next leg of the cycle.
The chart below shows how Merck & Co.’s latest push toward new highs lines up with its recent trading range and the typical seasonal path over the next two months.
What should traders watch as this Merck & Co. seasonal window opens?
First, the calendar. The 139-day window begins on Aug 22 and runs through Jan 7, overlapping the late stages of the midterm election year and the handoff into the pre-election year. Historically, that has been a sweet spot for Merck & Co. in this election-cycle grouping, with the stock tending to build gains through the fall and into early January rather than peaking early.
Second, price levels. With Merck & Co. trading just below its 52-week high and well above its 50-day moving average, traders will be watching whether any early-window pullbacks resemble the deeper drawdowns seen in years like 2002 and 2014 or stay closer to the milder dips of the stronger cycles. A pattern of higher lows into October and November would rhyme with the historical seasonality, while a sharp break below the recent range would mark a clear departure from the past 15 midterm-year windows.
Third, policy and pipeline catalysts. Midterm-year autumns often bring renewed focus on drug pricing, Medicare negotiations and regulatory scrutiny, all of which can swing sentiment around big pharma. Against that backdrop, any fresh data from Merck & Co.’s oncology and cardiometabolic pipelines, or updates tied to its long-term $70 billion growth target, could either reinforce or challenge the stock’s typical late-year strength.[3]
Finally, positioning and sentiment. Short interest trends into and through the window will be important to monitor, given the history of fluctuating short interest levels around Merck & Co. in 2025 and early 2026.[5] If shorts continue to build into a seasonally strong stretch and the stock follows its historical pattern, any upside follow-through could force covering and add fuel to the move. If, instead, the stock stalls near highs while short interest rises, that would be an early sign that this midterm-year window may not repeat the clean 15-for-15 record.
Sources
- Forbes (Great Speculations) - Why Is Merck Stock Surging?
- Reuters - Merck posts higher third-quarter sales as Keytruda growth offsets drop from Gardasil
- Reuters - Merck says new growth opportunities to drive revenue of $70 billion by mid-2030s
- Forbes (Great Speculations) - Is Merck Stock’s Run Legitimate?
- MarketBeat - Merck & Co., Inc. (MRK) Short Interest & Short Float | Updated Aug 2026
About this seasonal analysis
Seasonal pattern data is sourced from TradeWave.ai, which analyzes historical price behavior across annual calendar windows going back up to 30 years. Read the full data methodology or the book The 100-Year Pattern by Afshin Moshrefi (2026 edition). Past performance of seasonal patterns does not guarantee future results. This article is for informational purposes only and does not constitute investment advice.