Nasdaq QQQ Invesco ETF (QQQ) Faces Breakout Debate as 6-for-6 Midterm Run Nears
Nasdaq QQQ Invesco ETF is approaching an Oct 11 seasonal window that has never been negative in past midterm election years, just as traders debate whether tech is closer to a breakout or a pullback.
What is the seasonal pattern for Nasdaq QQQ Invesco ETF (QQQ)?
Nasdaq QQQ Invesco ETF has risen in 6 of 6 midterm election years during the Oct 11 to Apr 24 window, with an average gain of 17.42% in winning years.
- 6 for 6 in this window, with QQQ posting gains every time from Oct 11 to Apr 24 across the last six midterm election years.
- Percent Profitable is 100%, with 6 winners and 0 losers over the 196-day Nasdaq QQQ Invesco ETF trading window.
- Average profit in winning years is 17.42%, compounding to a 160% cumulative return when the window is stacked across all six cycles.
- The TradeWave Ratio of 2.16 indicates that price has typically traveled meaningfully in the long direction within the window, beyond just the final close.
- A Sharpe ratio of 2.97 for this slice of the calendar points to unusually strong risk-adjusted returns compared with typical ETF behavior.
- Even in winning years, intra-window drawdowns have at times been sharp, with the 2018 midterm year showing a double-digit pullback before finishing higher.
According to historical data from TradeWave.ai, this specific midterm-year fall–spring stretch has behaved very differently from an average six-month period for QQQ, and the next iteration is less than a month away.
How has Nasdaq QQQ Invesco ETF (QQQ) traded in the Oct 11 to Apr 24 window?
Nasdaq QQQ Invesco ETF has closed higher in every single Oct 11 to Apr 24 window across the last six midterm election years, averaging 17.42% gains for long positions. The upcoming window begins on Oct 11 and runs 196 days into late April, covering the handoff from the concluding midterm election year into the year before the presidential election, a phase that has often been friendly to growth and technology exposure.
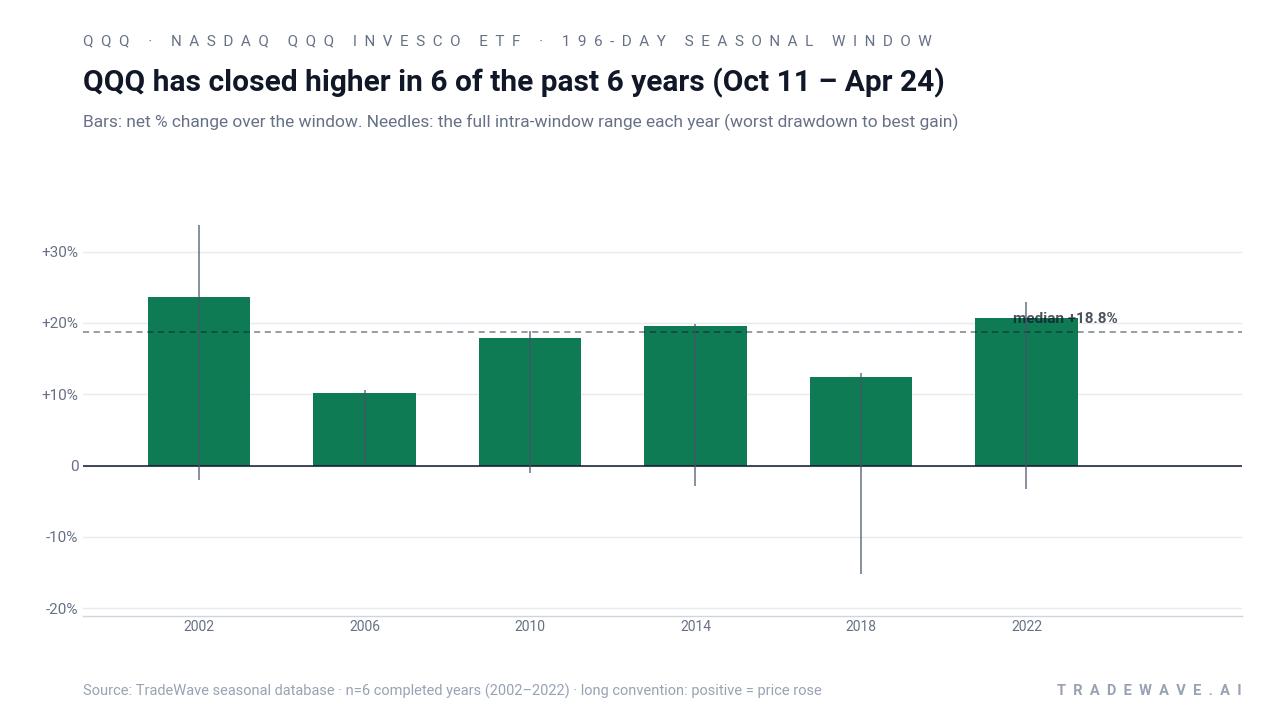
The presidential election cycle matters here because this pattern only looks at midterm election years, then follows QQQ through the transition into the year before the presidential election, a phase that has historically seen easier financial conditions and stronger risk appetite in many cycles. Grouping by this cycle strips out noise from other years and focuses on how tech-heavy benchmarks behave when Washington is shifting from midterm gridlock toward the next presidential race.
The trade direction for this setup is explicitly long. Across the six completed midterm-year windows since 2002, QQQ’s net returns ranged from a gain of 10.22% in 2006 to 23.67% in 2002, with no losing years in the sample. Average profit across all six windows is 17.42%, while the median outcome is slightly higher at 18.77%, which points to a fairly tight cluster of strong results rather than a pattern driven by a single outlier year.
Looking at individual years, 2018 stands out as the most stressful ride for bulls even though it still finished with a 12.38% gain. During that window, QQQ’s best point-to-peak move, or maximum favorable excursion, reached 12.97%, but the worst drawdown from the entry, or maximum adverse excursion, hit -15.17% before the ETF recovered into April. By contrast, 2006 delivered a smoother path, with a 10.22% net gain, a 10.53% peak run-up and only a 0.12% worst drawdown, showing that not every midterm-year window has required investors to sit through deep volatility.
The MAE and MFE profile across all six years shows a consistent pattern of upside potential paired with manageable but sometimes sharp setbacks. In the strongest years such as 2002 and 2022, QQQ’s best intra-window gains reached 33.66% and 22.89% respectively, while the worst drawdowns stayed contained at -1.98% and -3.23%. That combination of large favorable moves and relatively limited adverse excursions is what underpins the high Sharpe ratio of 2.97 for this window.
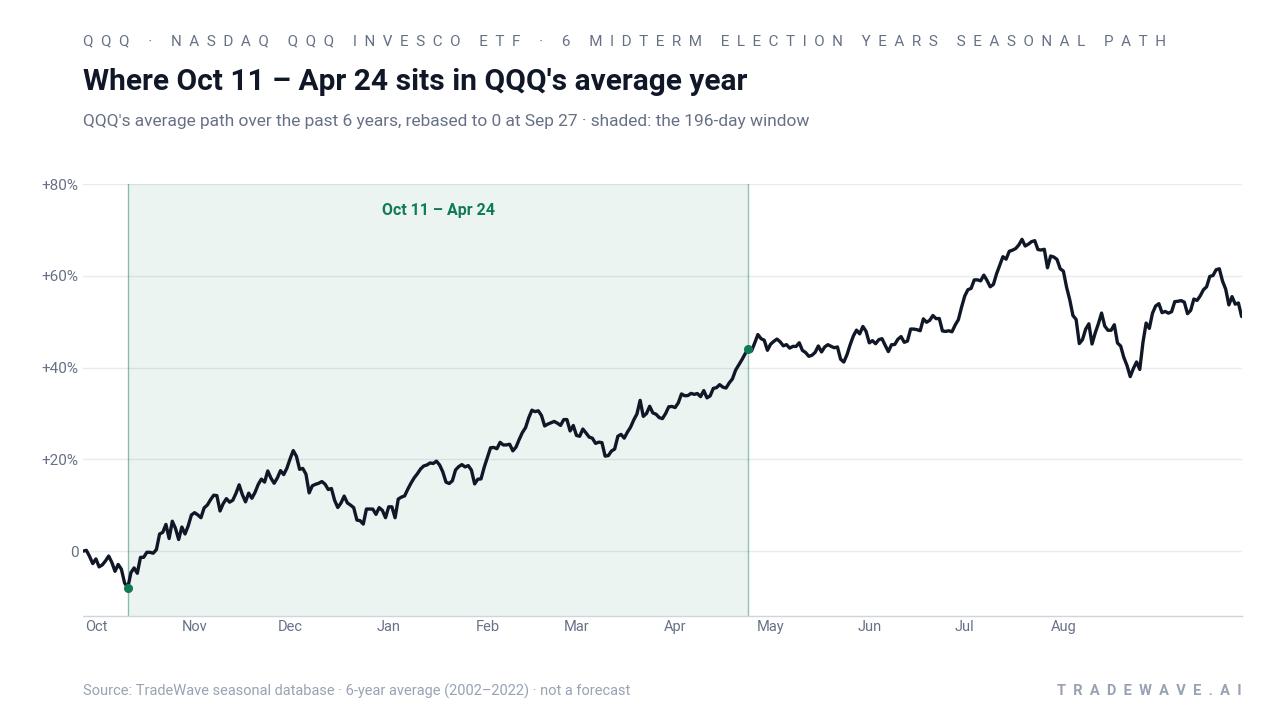
A second view stacks each year’s net return with its full intra-window range, from worst drawdown to best rally.
Put together, the pattern is straightforward: six for six, with double-digit average gains and a history of sizable upside moves that have usually outweighed the drawdowns along the way. History does not guarantee a repeat, but the consistency across two decades of midterm election years is hard to ignore.
Why does Nasdaq QQQ Invesco ETF (QQQ) follow this seasonal pattern?
One likely driver is the way the tech-heavy Nasdaq responds to the policy and liquidity backdrop as markets move from midterm election uncertainty into the year before the presidential election, when fiscal and monetary conditions have often been more supportive. Analysts have also pointed to the clustering of big-cap tech earnings, year-end portfolio rebalancing and new-year risk-on positioning as forces that can funnel flows into QQQ between October and April. This pattern may reflect that combination of political calendar, institutional repositioning and the growth sector’s tendency to lead when investors are willing to take more risk.
History does not guarantee future results, and even in a window with a perfect win record, adverse excursions within the period can be large enough to challenge long positions.
What is driving Nasdaq QQQ Invesco ETF (QQQ) today?
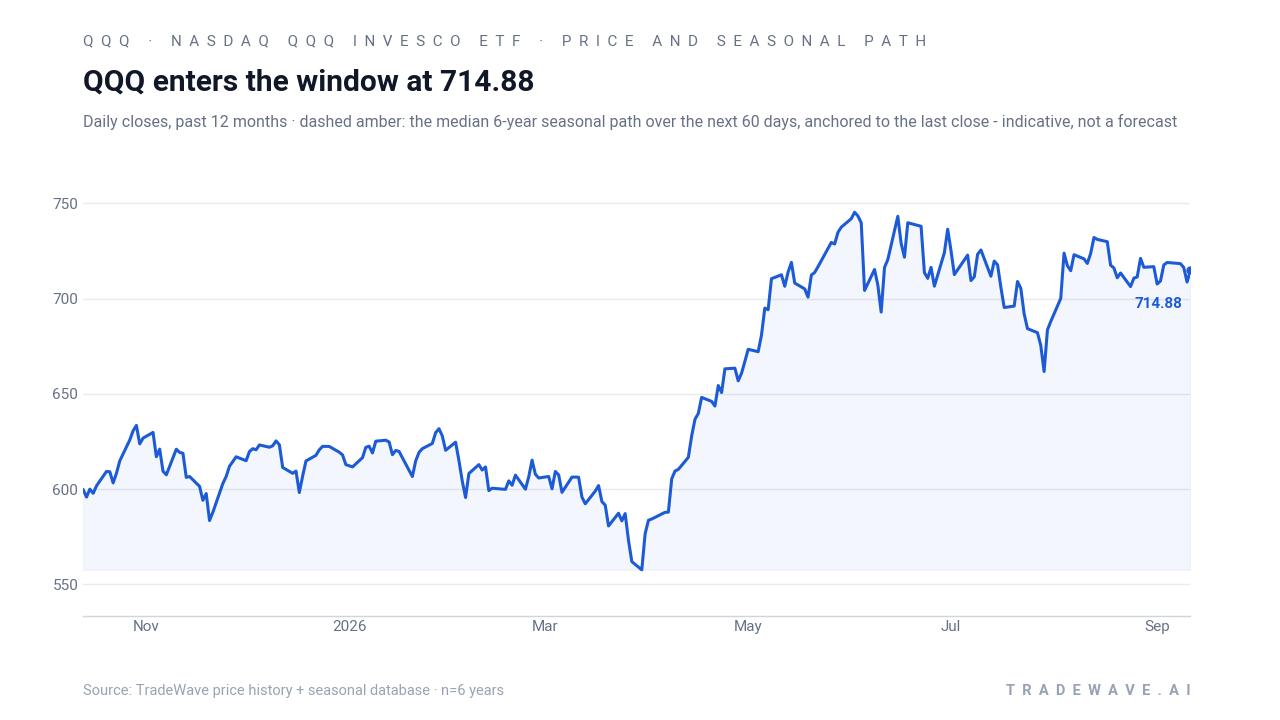
QQQ is trading near the upper end of its 52-week range, with the prior year’s high at 747.00 and the low at 554.38, after a modest -2.35% pullback over the past month that has left the ETF hovering around its 50-day moving average of 710.41.[2][3] That keeps the Nasdaq-heavy fund in a firmly bullish long-term trend even as short-term traders debate whether the latest consolidation is a pause before another leg higher or the start of a deeper correction.
In April 2026, a Barchart column framed the QQQ chart as sitting between two extremes, arguing that the setup could resolve either in a dot-com-style unwind or a powerful breakout to new highs, underscoring how stretched the tech trade had become by that point.[5] Earlier coverage in April 2026 also highlighted how new competing products were challenging QQQ’s dominance while still reinforcing its role as the core vehicle for Nasdaq and technology exposure in many portfolios.[4] Together, those pieces capture the tension facing investors heading into this fall: QQQ remains the go-to proxy for mega-cap growth, but positioning and valuations leave less margin for error if macro or policy surprises hit.
The chart below shows QQQ’s past year of trading alongside a 60-day seasonal projection based on prior midterm election years.
What should traders watch as the Oct 11 seasonal window approaches?
First, the calendar: this 196-day window starts on Oct 11, so any pickup in volatility or trend change as QQQ exits September and enters October will be watched closely against the historical pattern. Second, levels: the 52-week high near 747 and the 50-day moving average around 710 are the key reference points; how QQQ behaves around those bands into early October will shape how traders interpret any move once the seasonal window opens.[2][3]
Third, macro and policy catalysts: as the midterm election year wraps up and the year before the presidential election begins, markets will be parsing every signal on rates, regulation and fiscal policy that could affect mega-cap tech leadership. If QQQ continues to respect support on pullbacks and buyers step in on dips during the window, that would rhyme with the historical midterm-year seasonal trend. A break of support with sustained selling, by contrast, would mark a clear departure from the six-for-six record and signal that this cycle is behaving differently from the past.
Sources
- Barchart - I’m Preparing for a ‘Bang’ When the Nasdaq Crashes. Here’s How I’m Trading the QQQ ETF First.
- Barchart - QQQ - Invesco QQQ Trust ETF Price - Barchart.com
- Barchart - QQQ Trader's Cheat Sheet for Invesco QQQ Trust ETF - Barchart.com
- Barchart - QQQ Just Met Its Match With This New ETF. Here's Why It's a Win for Investors.
- Barchart - The QQQ Chart Hints at 2 Extremes: Either a Dot-Com Bubble Burst or a Technical Breakout Ahead
About this seasonal analysis
Seasonal pattern data is sourced from TradeWave.ai, which analyzes historical price behavior across annual calendar windows going back up to 30 years. Read the full data methodology or the book The 100-Year Pattern by Afshin Moshrefi (2026 edition). Past performance of seasonal patterns does not guarantee future results. This article is for informational purposes only and does not constitute investment advice.