Central Bank Buying and ETF Inflows Lift Gold (COMEX) (GC) Into 118-Day Election Rally Window
Gold (COMEX) futures are edging higher ahead of a 118-day election-cycle seasonal window that has delivered gains in every late midterm year in the dataset.
Price as of Sep 18, 2026: $4,391.50 (intraday).

What is the seasonal pattern for Gold (COMEX) (GC)?
Gold (COMEX) has risen in 6 of 6 late midterm-election-year Sep 21–Jan 16 windows, with an average gain of 8.84% in winning years.
- 6 for 6 in this window, averaging 8.84% gains in winning years across the last six midterm election years.
- Seasonal window runs from Sep 21 to Jan 16, spanning 118 days as the midterm election year wraps and the pre-election year approaches.
- Percent Profitable is 100.0%, with 6 winners and 0 losers in the TradeWave.ai historical sample.
- Median profit clocks in at 7.75%, with a cumulative return of 65.83% when stacking all six windows.
- TradeWave Ratio of 2.63 and a Sharpe ratio of 2.25 point to strong, relatively efficient upside in this Gold (COMEX) trading window.
- Intraperiod swings have still mattered, with individual years seeing several percentage points of downside before finishing higher.
According to historical data from TradeWave.ai, this late midterm-election stretch in gold has behaved very differently from an average calendar quarter. The next section walks through how that pattern has played out and what it means for the coming Sep 21–Jan 16 window.
How has Gold (COMEX) (GC) traded in the late midterm-year Sep–Jan window?
Gold (COMEX) has finished higher in all 6 late midterm-election-year windows from Sep 21 to Jan 16, averaging an 8.84% gain with no losing years in the sample. Futures settled at 4,392.30 in the prior session, up 0.3% on the day and sitting between a 52-week low of 3,754.80 and a high of 5,586.20, a range that underlines how volatile this contract has been over the past year.
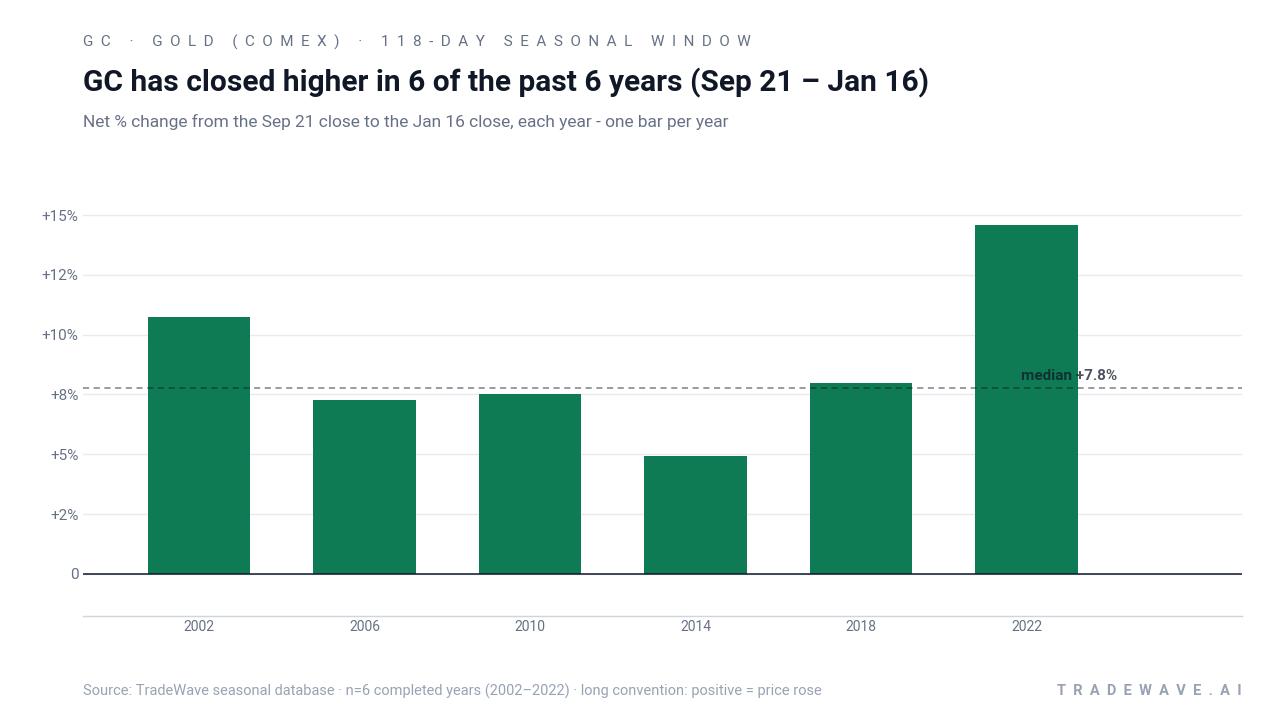
The pattern is grouped by the presidential election cycle, focusing on the last six midterm election years rather than consecutive calendar years. That matters because midterm years often bring a distinct mix of policy uncertainty, fiscal debates and geopolitical noise that can amplify safe-haven flows into gold compared with quieter parts of the cycle.
The trade direction for this window is long, and every completed year in the sample has been a favorable one for that stance. Average profit of 8.84% and a median gain of 7.75% show that the wins have not been driven by a single outlier year. Add it up and stacking the six windows compounds to a 65.83% cumulative return, which is a meaningful chunk of gold’s long-run advance across those cycles.
Looking at individual years, 2022 stands out as the strongest, with a 14.57% net gain between the Sep 21 entry and the Jan 16 exit as gold rallied from 1,664.60 to 1,907.20. On the softer side, 2014 still finished up 4.94%, but that year also saw one of the deeper dips inside the window, with a worst drawdown of about 6.89% from the entry before the contract recovered.
The intraperiod path has not been a straight line. Maximum favorable excursions have ranged from roughly 5% to more than 15% in individual years, while maximum adverse moves have often been in the low to mid single digits. That mix lines up with the TradeWave Ratio of 2.63 and a Sharpe ratio of 2.25, which together describe a window where upside has historically outweighed downside, but where traders still had to sit through meaningful swings.
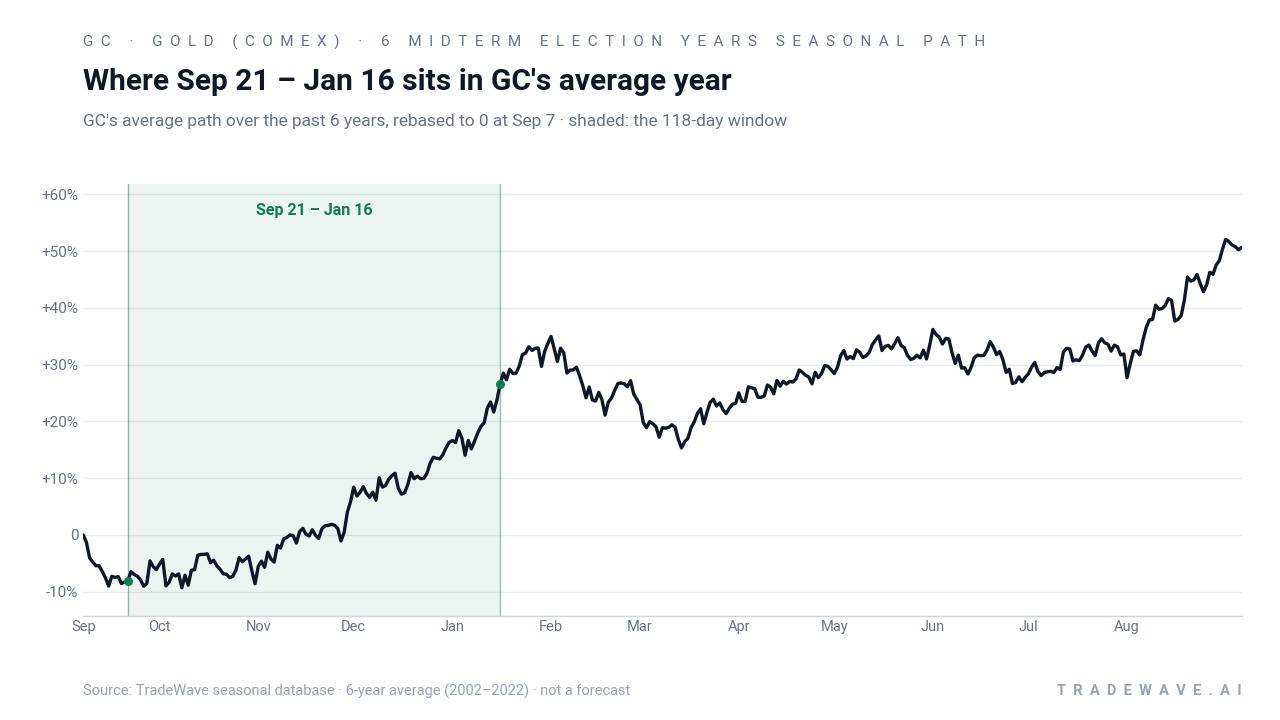
Year-by-year bars with intraperiod ranges show how much gold has typically swung inside this window before settling at its final gain.
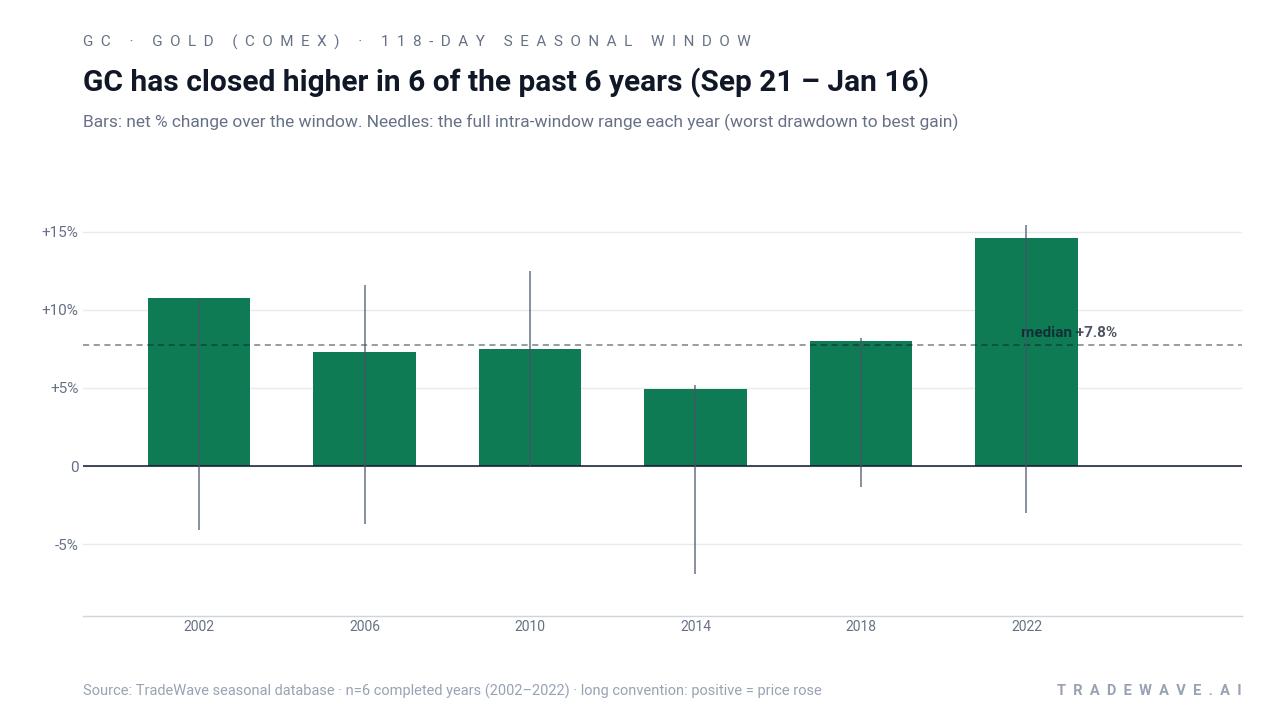
History does not guarantee future results; adverse excursions can still be sizable even in windows where every historical year finished higher.
Why does Gold (COMEX) (GC) follow this seasonal pattern?
One likely driver is the way policy and macro risk cluster late in the midterm election year, from budget showdowns to geopolitical flare-ups that tend to support safe-haven demand for gold. Analysts have also pointed to year-end portfolio rebalancing and central bank reserve decisions, which can concentrate buying interest into the final quarter and early January. This Sep–Jan seasonal pattern may reflect that combination of political uncertainty, fiscal negotiations and institutional repositioning that repeats each midterm cycle.
What is driving Gold (COMEX) (GC) today?
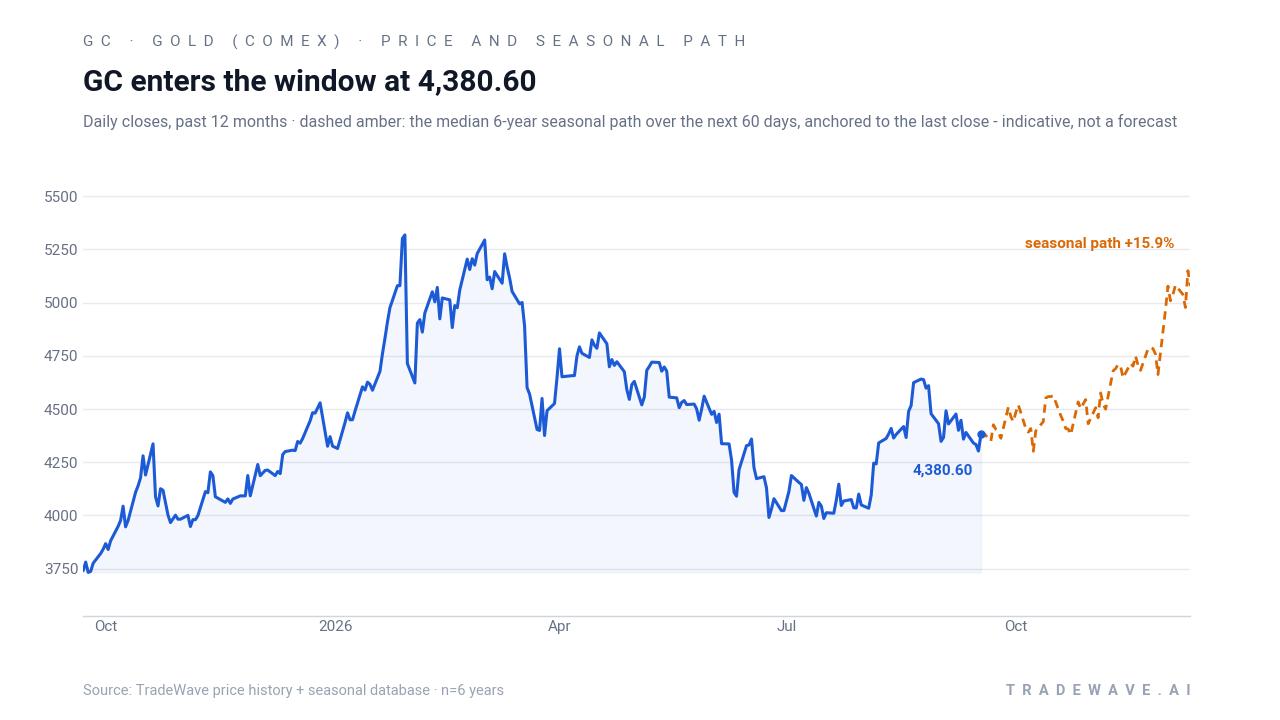
Gold (COMEX) futures closed at 4,392.30 in the prior session, up 11.70 points or 0.3% on the day, with trading confined to a 4,378.30–4,404.60 range on relatively light volume of 18,124 contracts. That level leaves GC well below its 52-week high of 5,586.20 and above the 52-week low of 3,754.80, while the contract trades modestly above its 50-day moving average of 4,291.42 on one-month performance of about -3.0%.
In March 2026, Wells Fargo projected that gold could reach $6,100–$6,300 per ounce by year-end, citing continued central bank demand and an eventual moderation in yields as key supports for the metal.[1] In October 2025, Goldman Sachs lifted its December 2026 gold forecast to $4,900 per ounce, pointing to strong Western ETF inflows and ongoing central bank buying, with risks described as skewed to the upside as private investors diversify into bullion.[2] In January 2026, The Wall Street Journal reported that gold futures briefly spiked toward $5,000 per ounce amid geopolitical tensions and market jitters, underscoring how quickly safe-haven flows can push prices to new records when fear spikes.[3]
The chart below places the latest move in the context of the past year and overlays the historical 60-day seasonal path as a reference.
What should traders watch as this Gold (COMEX) seasonal window opens?
First, the calendar: the 118-day window begins on Sep 21 and runs through Jan 16, covering the final stretch of the midterm election year and the handoff into the pre-election year. Historically, that has been a supportive backdrop for gold, with 6 winners and 0 losers in this specific GC seasonal trend.
Second, macro catalysts. The same forces that drove prior late-year rallies in gold, such as central bank reserve accumulation, ETF inflows and bouts of geopolitical stress, will be key tells again.[2][3] If those themes reappear into year-end, they would rhyme with the historical seasonality that has favored long exposure in this Gold (COMEX) trading window.
Third, levels and volatility. Traders will be watching how GC behaves around its 50-day moving average and whether pullbacks inside the window resemble the low- to mid-single-digit drawdowns seen in prior years or something larger. A pattern of shallow dips followed by renewed buying would be consistent with the historical record, while a deep and persistent break would mark a clear departure from the last six midterm cycles.
Finally, behavior relative to the election cycle. As the market concludes the midterm election year and edges toward the historically more risk-on pre-election year, gold’s response to policy headlines and fiscal negotiations will help confirm whether this midterm-year seasonal pattern is still in force. If safe-haven demand builds into that transition, it would align with the 6-for-6 track record; if instead investors rotate aggressively out of gold into risk assets, this could be the cycle that breaks an otherwise clean seasonal streak.
Sources
About this seasonal analysis
Seasonal pattern data is sourced from TradeWave.ai, which analyzes historical price behavior across annual calendar windows going back up to 30 years. Read the full data methodology or the book The 100-Year Pattern by Afshin Moshrefi (2026 edition). Past performance of seasonal patterns does not guarantee future results. This article is for informational purposes only and does not constitute investment advice.