S&P 500 Technology Sector SPDR (XLK) Averages 16.94% Gains in This 196-Day Midterm Run
S&P 500 Technology Sector SPDR is heading toward an Oct 11 seasonal window that has never lost in the last six midterm election years, even as the ETF already posts a strong 2026 YTD gain.

What is the seasonal pattern for S&P 500 Technology Sector SPDR (XLK)?
S&P 500 Technology Sector SPDR has risen in 6 of 6 midterm-election-year Oct 11–Apr 24 windows, with an average gain of 16.94% in winning years.
- 6 for 6 in this window, with XLK averaging 16.94% gains across all six midterm-election-year runs.
- The upcoming seasonal window starts Oct 11 and spans 196 days into late April, covering the handoff from the midterm election year into the pre-election year.
- Percent Profitable is 100.0%, with 6 winners and 0 losers across the historical sample.
- Average winner profit of 16.94% comes with a TradeWave Ratio of 1.81 and a Sharpe ratio of 2.49, pointing to strong risk-adjusted returns.
- Intraperiod swings have been meaningful, including a year where XLK suffered a worst drawdown of -15.75% before finishing higher.
- Stacking this 196-day window across the six midterm-election years compounds to a cumulative gain of 154.17%.
According to historical data from TradeWave.ai, this specific Oct 11–Apr 24 stretch has behaved very differently from an average tech-market year. The next section walks through how that pattern has played out in past midterm election cycles and what it means for XLK’s upcoming window.
How has S&P 500 Technology Sector SPDR (XLK) traded in the Oct 11–Apr 24 window?
S&P 500 Technology Sector SPDR has closed higher in every single Oct 11–Apr 24 window across the last six midterm election years, averaging a 16.94% gain for long positions. The ETF last finished at 183.93, up 0.1% on the day and 27.93% year to date, so it is already coming into this historically strong stretch with a solid 2026 advance.[1]
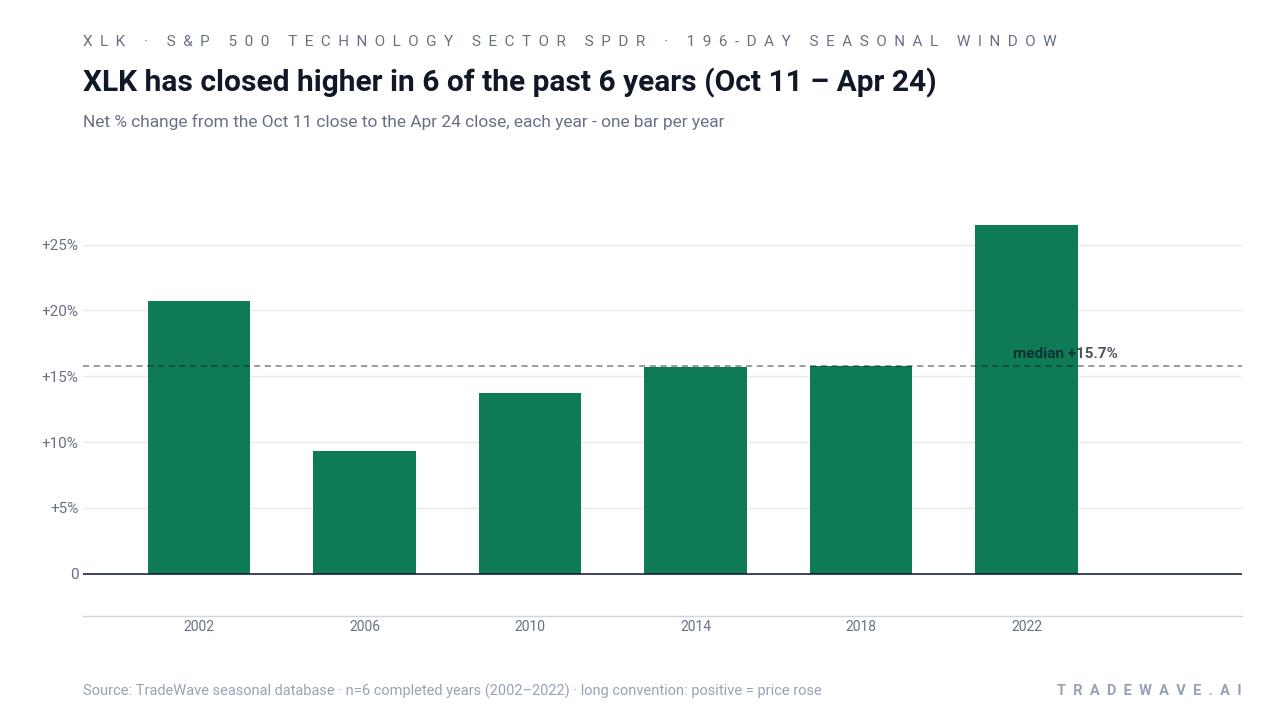
The presidential election cycle matters here because this pattern only looks at the last six midterm election years, then tracks XLK from Oct 11 of the midterm year through Apr 24 of the following pre-election year. That means the window sits inside the broader midterm-to-pre-election regime that has often favored risk assets, but it isolates how large-cap U.S. technology has behaved during that specific handoff.
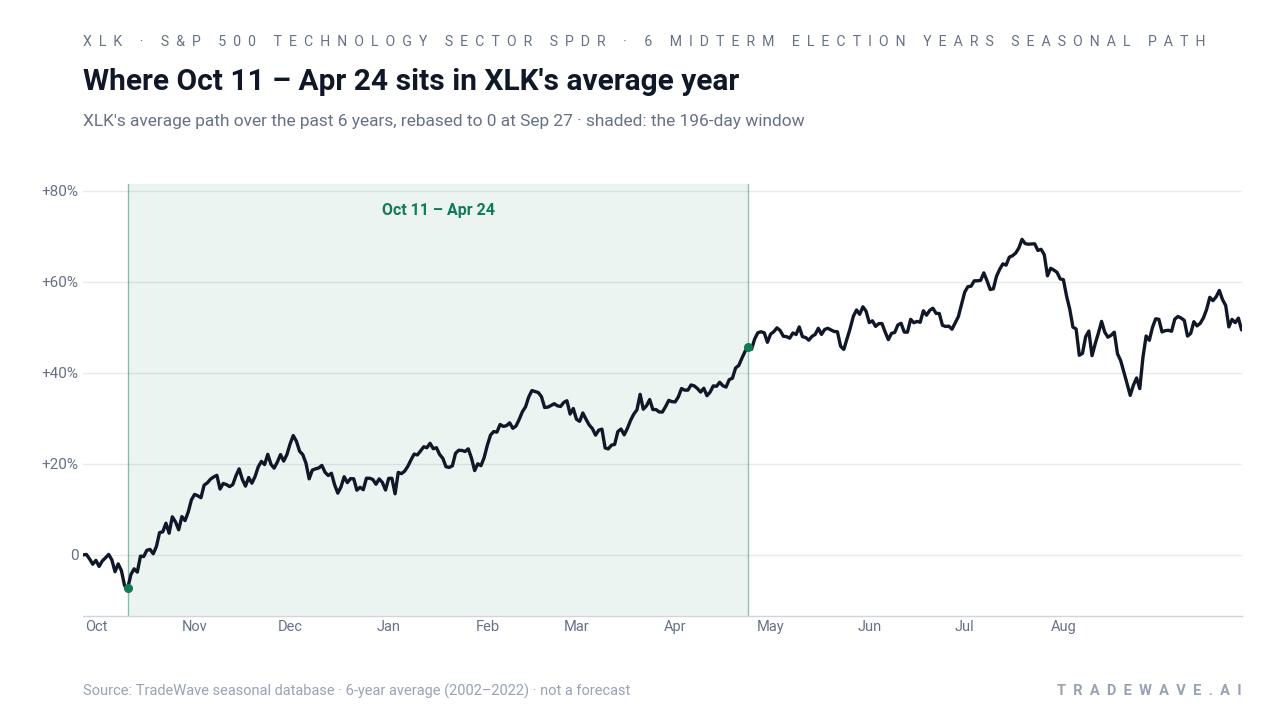
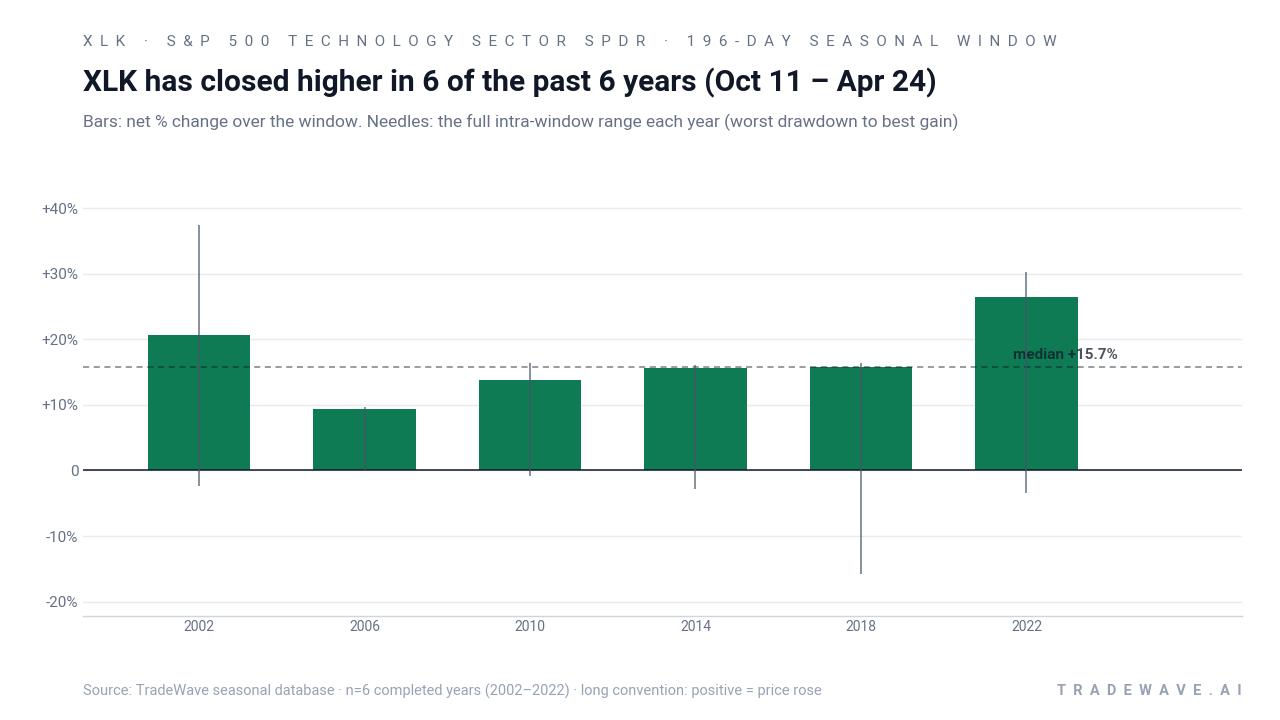
A second view shows how much XLK has typically swung inside the window before finishing higher.
Across the six midterm-election-year samples, XLK’s long trade direction has been rewarded every time, with 6 winners and 0 losers and a median profit of 15.74%. Average gains of 16.94% mask some dispersion, from a 9.3% rise in 2006 to a 26.46% surge in 2022, but the bias has been consistently positive for longs. The annualized return for repeatedly holding only this 196-day slice clocks in at 16.82%, while the Sharpe ratio of 2.49 points to unusually strong risk-adjusted performance for a sector ETF.
The intraperiod path has not been a straight line. Maximum favorable moves have ranged from 9.7% in 2006 to 37.35% in 2002, showing that in strong years XLK has often pushed well beyond its final close at some point in the window. On the downside, the worst drawdowns from entry have usually been modest, such as -0.88% in 2010 and -3.38% in 2022, but 2018 stands out with a -15.75% adverse move before the ETF still finished the window up 15.81%. That combination of sizable maximum favorable excursion and occasionally deep maximum adverse excursion is what the TradeWave Ratio of 1.81 is capturing: price has tended to travel meaningfully in the trade direction within the window, even when the final close understates the ride.
Looking at the per-year table, 2022 is the strongest example, with XLK entering around 56.90 and exiting near 71.96 for a 26.46% gain, after reaching a best intraperiod rally of 30.24%. At the other end, 2006 delivered the smallest net gain at 9.3%, with almost no drawdown recorded, which shows that not every midterm-year window has been explosive, but all have been positive. When those six slices are compounded, the cumulative return of 154.17% illustrates how powerful this single recurring window has been for technology exposure.
Put together, the pattern is clear: in the last six midterm election years, the Oct 11–Apr 24 window has favored long XLK exposure every time, with strong average gains and only one year showing a truly sharp intraperiod drawdown.
Why does S&P 500 Technology Sector SPDR (XLK) follow this seasonal pattern?
One likely driver is the way the tech earnings calendar and guidance cycle cluster around late October, January and April, which often resets expectations and can fuel multi-month trends in large-cap names. Analysts have also pointed to institutional portfolio repositioning around the midterm election year, as investors lean back into growth and AI themes once policy uncertainty starts to clear and the pre-election year historically brings a more supportive risk backdrop.[2][3] For a concentrated technology ETF like XLK, those flows can translate into a repeatable midterm-to-pre-election seasonal tailwind.
History does not guarantee future results; even in a 100% winning window, adverse excursions inside the period can be large and fast.
What is driving S&P 500 Technology Sector SPDR (XLK) today?
S&P 500 Technology Sector SPDR last traded at 183.93, edging 0.1% higher on the day and leaving the ETF up 27.93% so far in 2026, a performance that keeps it firmly in the market’s leadership tier.[1] The fund remains heavily concentrated in mega-cap technology, with roughly 99.9% of its weight in the sector and top positions in names like NVIDIA, Apple and Microsoft, so AI-driven semiconductor demand and cloud spending trends continue to dominate its narrative.[2][3] Sector commentary this year has highlighted strong semiconductor revenue growth tied to AI infrastructure build-outs, which has supported large-cap tech valuations and helped pull XLK higher.
The chart below shows XLK’s past year of trading alongside a 60-day seasonal projection based on prior midterm-election-year behavior.
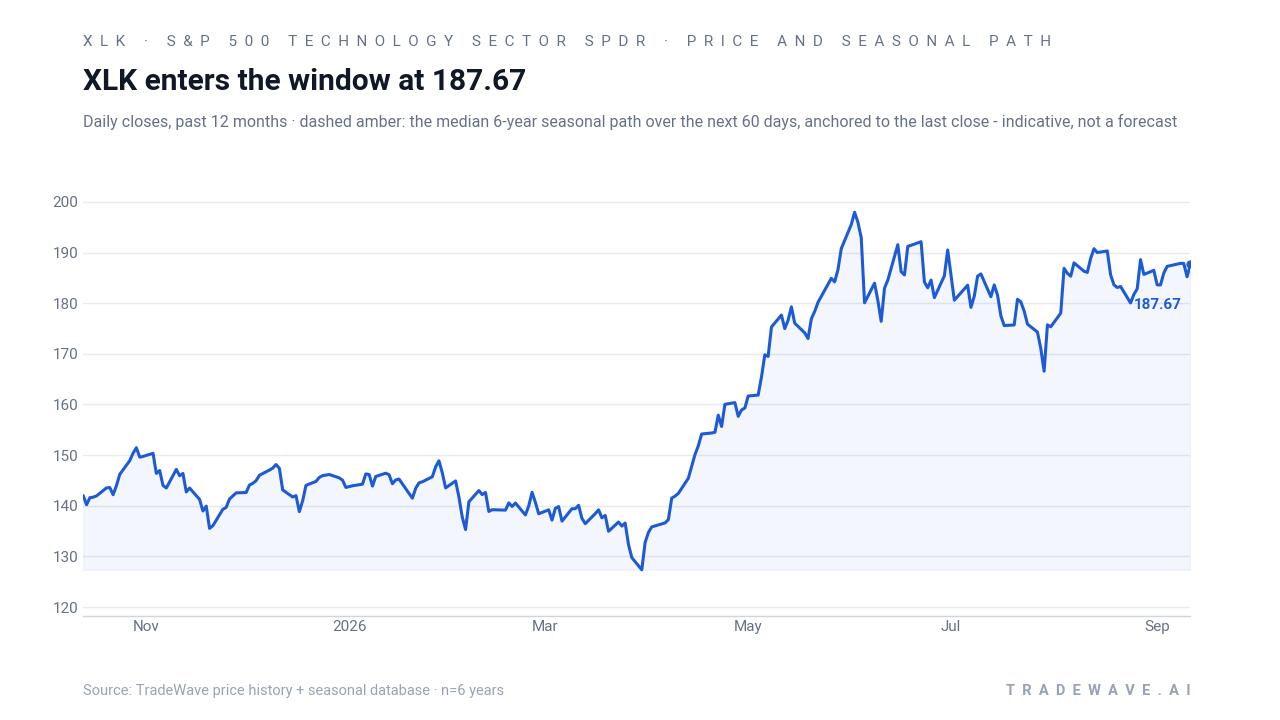
Fund-level data show active trading and sizable assets under management, but without a single flagged “volume spike” event, suggesting that flows have been steady rather than manic.[3] Short-interest figures compiled in late July 2026 show elevated and variable positioning over time, with tens of millions of shares sold short at points, which can add fuel to rallies when seasonal strength and macro tailwinds line up.[4] At the same time, reports in 2026 have pointed to a record pace of open-market insider buying at companies held inside XLK, a signal of internal confidence that aligns with the ETF’s strong year-to-date run.
Sources
- Yahoo Finance - State Street Technology Select Sector SPDR ETF (XLK) Performance History
- Financial Times Markets - State Street® Technology Select Sector SPDR® ETF, XLK:PCQ:USD summary - FT.com
- MarketWatch - XLK | State Street Technology Select Sector SPDR ETF Overview | MarketWatch
- MarketBeat - Technology Select Sector SPDR Fund (XLK) Short Interest & Short Float | Updated Aug 2026
About this seasonal analysis
Seasonal pattern data is sourced from TradeWave.ai, which analyzes historical price behavior across annual calendar windows going back up to 30 years. Read the full data methodology or the book The 100-Year Pattern by Afshin Moshrefi (2026 edition). Past performance of seasonal patterns does not guarantee future results. This article is for informational purposes only and does not constitute investment advice.