Wells Fargo’s $6,300 Call Meets a 6-for-6 Midterm Winter Streak for Gold (COMEX) (GC)
Gold (COMEX) futures have just moved into a 118-day midterm-election-year seasonal window that has never finished lower in this sample, even as prices sit well below record highs.
Price as of Sep 22, 2026: $4,378.80 (intraday).

What is the seasonal pattern for Gold (COMEX) (GC)?
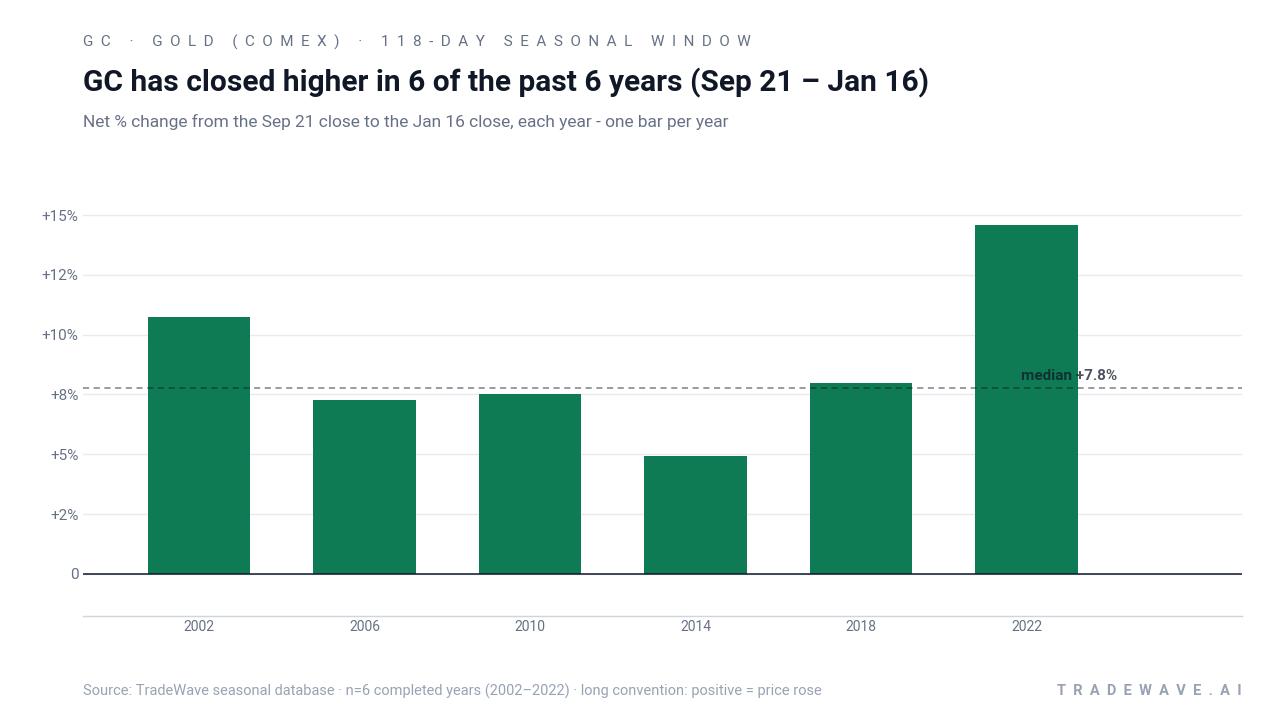
Gold (COMEX) has risen in 6 of 6 midterm-election-year Sep 21 to Jan 16 windows, with an average gain of 8.84% in winning years.
- 6 for 6 in this window, with Gold (COMEX) averaging 8.84% gains across all completed midterm-election-year cycles.
- Seasonal window runs 118 calendar days from Sep 21 to Jan 16, aligned with the late part of the midterm election year.
- Percent Profitable is 100.0%, with 6 winners and 0 losers in the TradeWave sample.
- Average winner gain of 8.84% comes with a TradeWave Ratio of 2.63 and a Sharpe ratio of 2.25, pointing to a historically efficient long setup.
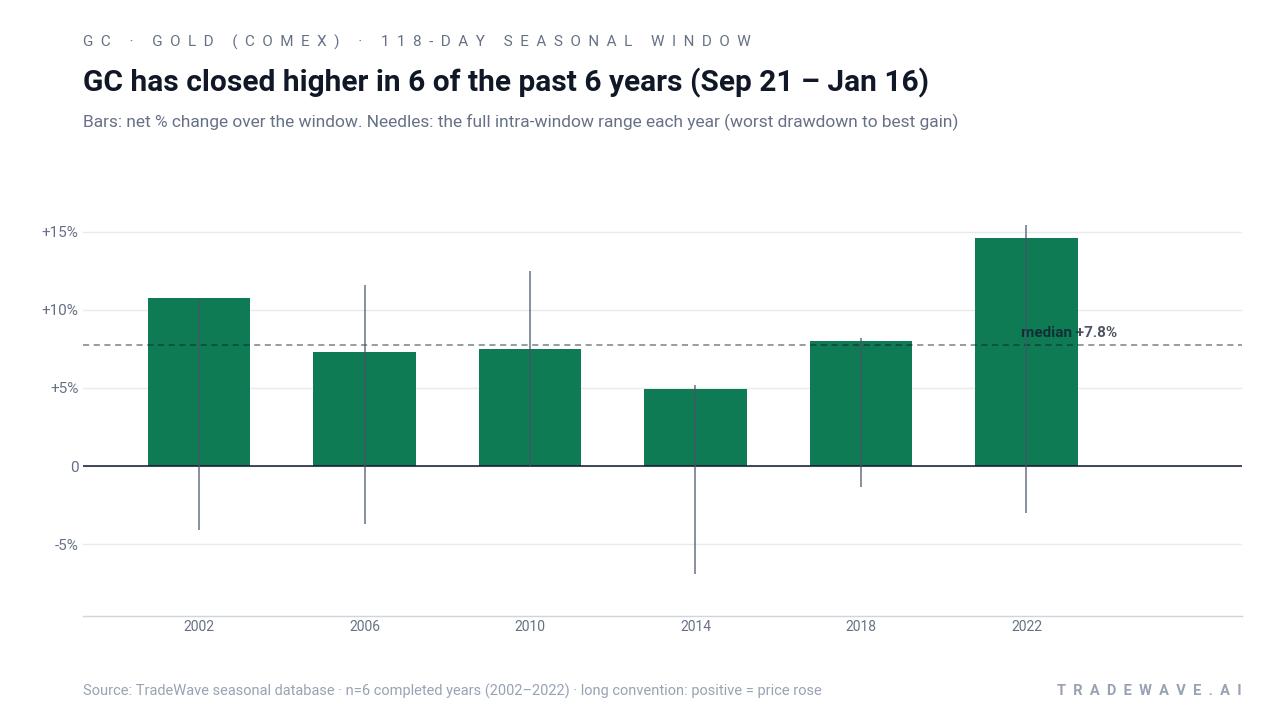
- Individual years have seen worst intraperiod drawdowns between roughly 1% and 7%, while best run-ups have reached about 5% to 15% before the window closed.
- Cumulative stacking of this specific Sep 21 to Jan 16 window across the six midterm-election-year samples compounds to a total return of 65.83%.
According to historical data from TradeWave.ai, this late midterm-election-year stretch in Gold (COMEX) has behaved very differently from an average quarter on the calendar. The next section walks through how that pattern has played out in prior cycles and what it implies for the current window.
How strong is the current seasonal window for Gold (COMEX) (GC)?
Gold (COMEX) has finished higher in every Sep 21 to Jan 16 midterm-election-year window in the last six cycles, averaging an 8.84% gain for long positions. The contract settled the prior session at 4,380.10, leaving it about 21.6% below its 52-week high of 5,586.20 and still well above the 52-week low of 3,823.70. That combination of a strong historical tailwind and a market trading off its highs gives this 118-day stretch unusual weight for traders watching the GC seasonal trend.
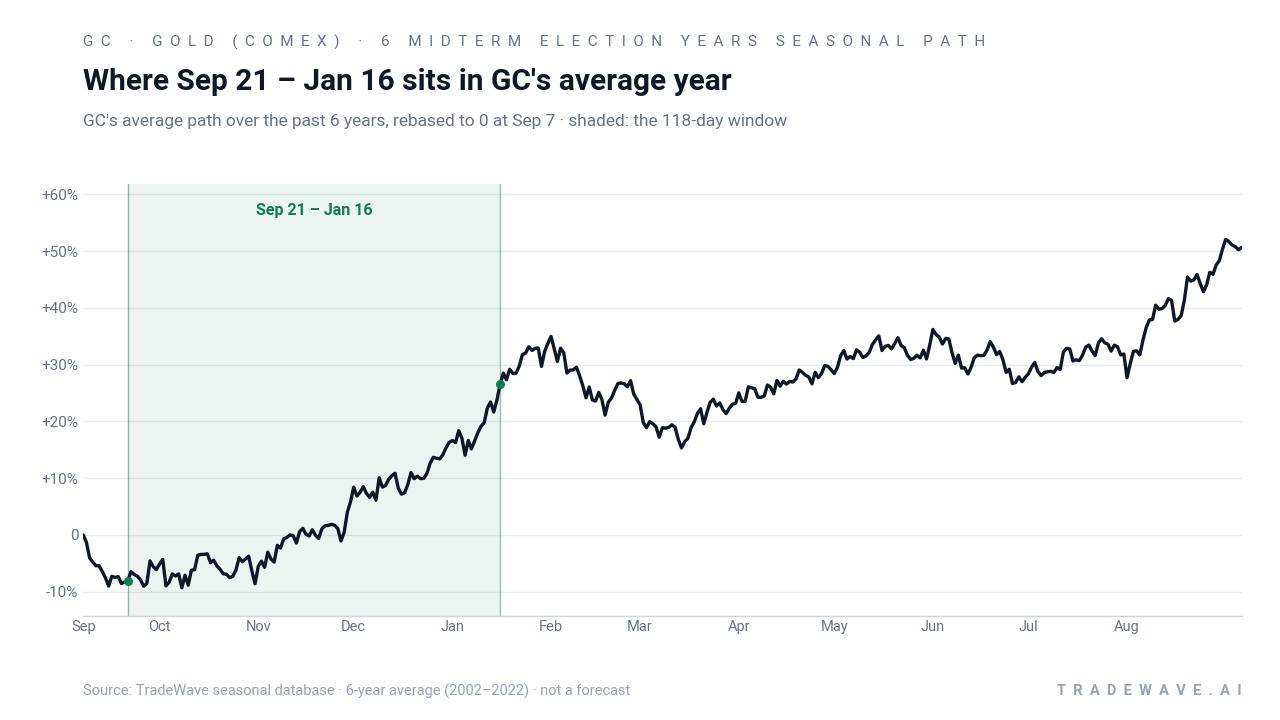
Because this pattern is grouped by the presidential election cycle, it only looks at the last six midterm election years, a phase where fiscal debates, rate expectations and policy uncertainty often peak before easing into the pre-election year. For a macro hedge like gold, that clustering of political and policy risk can matter more than the simple calendar month, which is why the election-cycle lens is central to this GC seasonal outlook.
Historically, the trade direction for this window has been long, and every one of the six sampled midterm-election-year runs from Sep 21 to Jan 16 ended with a positive net return. Average profit across those years is 8.84%, with a median gain of 7.75%, and the annualized return for the window clocks in at 8.8%, which is high for a roughly four-month slice of the year. The Sharpe ratio of 2.25 signals that, on an end-of-window basis, returns have been strong relative to volatility, not just noisy upside.
The per-year breakdown shows how that plays out in practice. The weakest net outcome in the sample was still a 4.94% gain in 2014, while the strongest was a 14.57% rally in 2022, when gold climbed from 1,664.60 to 1,907.20 over the window. In several years, including 2006 and 2010, the maximum favorable move inside the window ran into double digits, with best point-to-peak gains of 11.59% and 12.47% respectively before settling back to smaller but still positive closes.
On the downside, the maximum adverse excursions have been manageable but not trivial. The worst intraperiod drawdown in the sample was a 6.89% slide in 2014 before the contract recovered to finish higher, while other years saw adverse moves in the 3% to 4% range and one year, 2010, recorded essentially no drawdown from the entry. That mix lines up with the TradeWave Ratio of 2.63, which captures how far price typically travels in the trade direction within the window regardless of where it finishes.
A second view stacks each year’s net result with its full intraperiod range, highlighting how upside and downside have coexisted.
The cumulative chart for this pattern compounds each Sep 21 to Jan 16 result across the six midterm-election-year samples and reaches a total gain of 65.83%. That steady climb, without a single losing point on the curve, is what makes this particular GC trading window stand out compared with many other commodity seasonal patterns that look far choppier.
History does not guarantee future results; adverse excursions can still be sizable inside the window, and even a pattern with six winners out of six can eventually produce a losing year.
Why does Gold (COMEX) (GC) follow this seasonal pattern?
This midterm-election-year pattern for Gold (COMEX) likely reflects a mix of policy and macro seasonality. One likely driver is that late in the midterm year, fiscal debates, central bank signaling and geopolitical risk often cluster, which can boost demand for safe-haven assets and inflation hedges. The window also spans year-end portfolio rebalancing and central bank reserve decisions, periods when institutional flows into or out of bullion can be larger than usual.
What is driving Gold (COMEX) (GC) today?
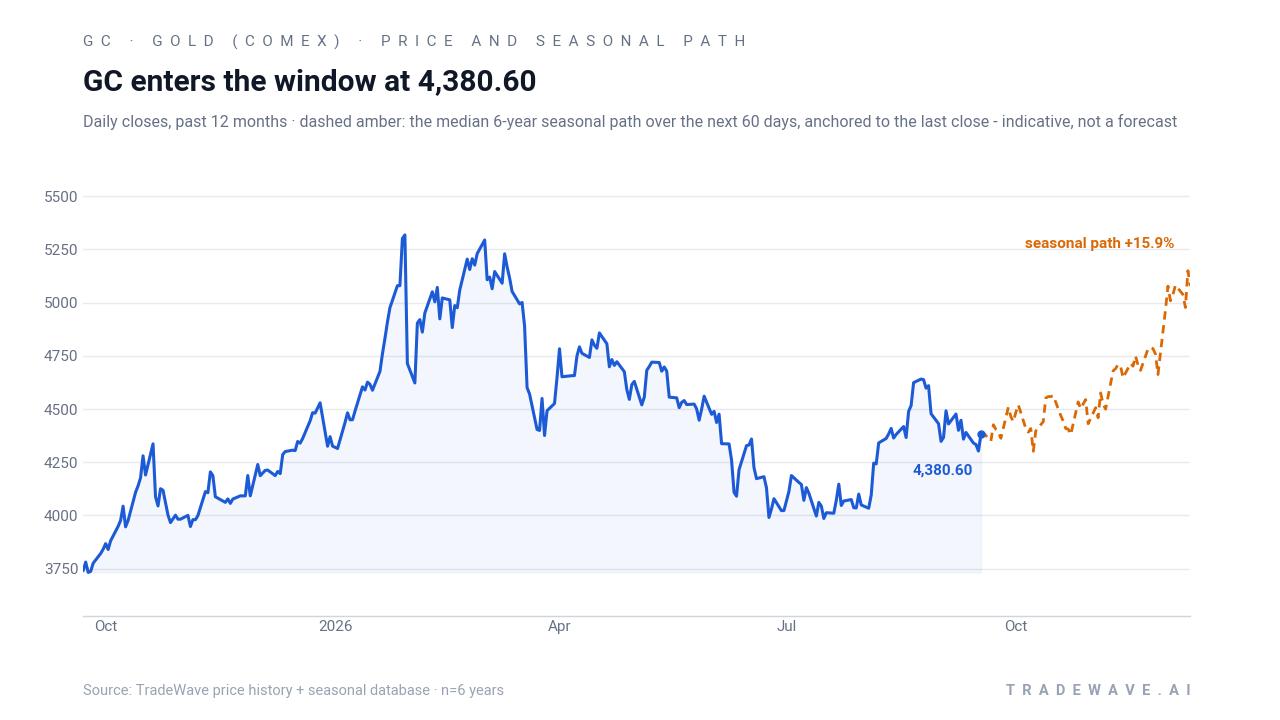
Front-month Gold (COMEX) futures ended the prior session at 4,380.10, down 0.02% on the day, extending a roughly 5.6% pullback over the past month even as the contract holds above its 50-day moving average around 4,308.44. That leaves GC trading well below the 52-week peak of 5,586.20 but still comfortably above the 52-week low of 3,823.70, with 20-day average volume near 74,954 contracts pointing to a liquid but not frenzied tape.
The chart below shows how that pullback fits into the past year of trading, along with the median 60-day seasonal path for this window.
In early 2026, gold’s surge toward $5,000 an ounce was driven by safe-haven demand as geopolitical tensions flared and volatility spiked across risk assets.[1] Subsequent sessions in late January and early February saw further sharp moves in both gold and silver, with precious-metals miners and related ETFs reacting in tandem.[2] By late March, Wells Fargo analysts were still calling for bullion to reach the $6,100 to $6,300 range by year-end, citing ongoing central bank buying and expectations for yields to moderate over time.[3]
More recently, contract-level data from Barchart shows active trading across key GC maturities, with detailed support, resistance and pivot levels watched closely by futures desks.[4] The same data set highlights steady day volumes in contracts such as GCJ26, reinforcing that liquidity remains deep even as prices consolidate below the highs seen earlier in the year.[5] For traders, that backdrop of strong macro narratives, robust liquidity and a clear historical seasonality creates a dense information mix heading into the heart of this midterm-year window.
What should traders watch in this Gold (COMEX) seasonal window?
First, the election-cycle context matters. The current pattern phase is the late part of the midterm election year, and the window runs straight into Jan 16, when markets will already be looking ahead to the pre-election year, a phase that has often been friendlier to risk assets and can shift the balance between safe-haven demand and growth trades. How gold behaves as fiscal debates, rate expectations and geopolitical headlines evolve into year-end will show whether this cycle rhymes with the prior six midterm years in the TradeWave sample.
Second, price levels and ranges inside the window are key. On the upside, traders will be watching whether GC can reclaim the 4,500 to 4,700 zone that has acted as a pivot in prior months, and whether any approach toward the 5,000 area attracts renewed hedging interest. On the downside, the 50-day moving average near 4,308 and the 3,800s band that marked the 52-week low are natural reference points for judging whether any intraperiod drawdown is tracking the historical MAE profile or breaking below it.
Third, macro catalysts will shape how this historical seasonality plays out. Central bank commentary on rates and balance sheets, fresh inflation prints and any flare-up in geopolitical risk can all swing safe-haven flows, just as they did when gold spiked toward $5,000 in January and February.[1][2] If those catalysts line up with the traditional late-year bid for bullion, the pattern of positive midterm-year winter windows could remain intact; if they do not, this could be the cycle that finally breaks the six-for-six streak.
Finally, traders should monitor futures liquidity and positioning through tools such as Barchart’s contract pages, which surface contract-specific prices, ranges and volume for GC maturities.[4][5] A pickup in volume and open interest as the window progresses would suggest that more participants are leaning into the move, while a fade in activity could signal skepticism about the historical pattern. Add it up: the next 118 days will test whether Gold (COMEX) can extend a perfect midterm-year record or whether this unusually consistent seasonal window is due for a reset.
Sources
- The Wall Street Journal - Gold Prices Climb Closer to $5,000 an Ounce
- The Wall Street Journal - Gold and Silver Prices Jump
- Seeking Alpha - Gold seen well above $6,000 by year-end despite recent struggles, Wells Fargo says (GLD:NYSEARCA)
- Barchart - Gold Dec '26 Futures Trader's Cheat Sheet
- Barchart - Gold Apr '26 Futures Price - Barchart.com
About this seasonal analysis
Seasonal pattern data is sourced from TradeWave.ai, which analyzes historical price behavior across annual calendar windows going back up to 30 years. Read the full data methodology or the book The 100-Year Pattern by Afshin Moshrefi (2026 edition). Past performance of seasonal patterns does not guarantee future results. This article is for informational purposes only and does not constitute investment advice.