Seven-for-Seven Midterm Run: S&P 500 SPDR (SPY) Averages 12.24% Gains From Oct 22
S&P 500 SPDR is hovering near its 52-week high as it approaches an Oct 22 seasonal window that has never been negative across the last seven midterm election cycles.

What is the seasonal pattern for S&P 500 SPDR (SPY)?
S&P 500 SPDR has risen in 7 of 7 midterm-to-pre-election year windows starting Oct 22, with an average gain of 12.24% in winning years.
- 7 for 7 in this window, with S&P 500 SPDR averaging 12.24% gains in winning years across the last seven midterm election cycles.
- Seasonal window runs from Oct 22 for 235 days, carrying through the end of the midterm election year into the heart of the pre-election year.
- Percent Profitable is 100.0%, with 7 winners and 0 losers in the historical sample.
- Avg Profit of 12.24% reflects all years in the sample, since every window finished positive.
- TradeWave Ratio of 2.1 indicates price has typically traveled meaningfully in the long direction within the window, while a Sharpe ratio of 2.0 points to strong risk-adjusted returns.
- Individual years have still seen notable drawdowns inside the window, with some episodes experiencing double-digit adverse moves before finishing higher.
According to historical data from TradeWave.ai, this upcoming stretch has behaved very differently from an average year for the S&P 500 SPDR. The next section walks through how that pattern has played out across past midterm election cycles and what it means for the window that opens on Oct 22.
How has S&P 500 SPDR (SPY) traded in the Oct 22 to Jun 13 window?
S&P 500 SPDR has closed higher in every single Oct 22 to Jun 13 window across the last seven midterm election years, averaging a 12.24% gain for long exposure. The ETF finished the prior session at 747.03, leaving it about 3.7% below its 52-week high and roughly 19.9% above its 52-week low. That combination of a strong historical seasonal trend and a price sitting near the top of its one-year range gives this midterm-to-pre-election window unusual weight for index traders.
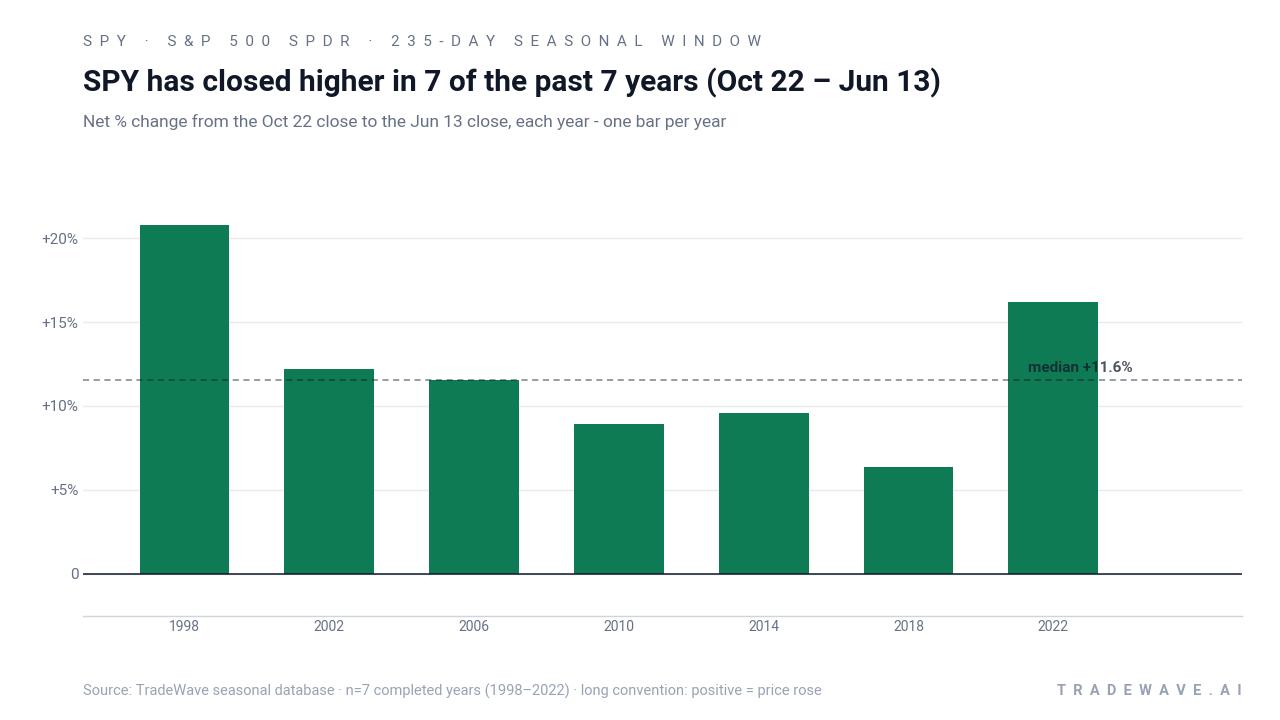
The pattern is built specifically on the presidential election cycle, grouping only midterm election years and then following the same Oct 22 entry through 235 days into the following pre-election year. That matters because policy, fiscal stance and risk appetite often shift in predictable ways between the midterm vote and the run-up to the next presidential election, and SPY sits at the center of that macro story.
Across the seven completed windows since 1998, the trade direction is long and every instance finished positive, with Percent Profitable at 100.0%, 7 winners and 0 losers. Average profit across all years is 12.24%, with a median outcome of 11.55%, so the typical result has been a double-digit gain rather than a one-off outlier. The strongest year in the sample was 1998, when SPY returned 20.76% between the Oct 22 entry and the Jun 13 exit, while the softest still-delivered year was 2018 at 6.38%.
Inside those windows, the path has not been a straight line. In 2002, SPY ultimately gained 12.21% but first saw a worst drawdown of 10.89% from the entry, illustrating how maximum adverse excursion can bite even in a winning year. By contrast, 2014 delivered a 9.61% net gain with essentially no meaningful downside from the starting point, showing that some cycles have been unusually smooth. Maximum favorable moves have also been sizable, with years like 1998 and 2010 seeing peak run-ups of 28.25% and 17.03% respectively before settling back toward their final gains.
The trend profile across the 235-day window tilts bullish but not parabolic. The historical average path shows SPY grinding higher from late October through the first half of the following year, with gains tending to build as the pre-election year gets underway rather than spiking only at the start. That fits the broader narrative that pre-election years have often been supportive for equities as policy uncertainty clears and fiscal and monetary settings stabilize.
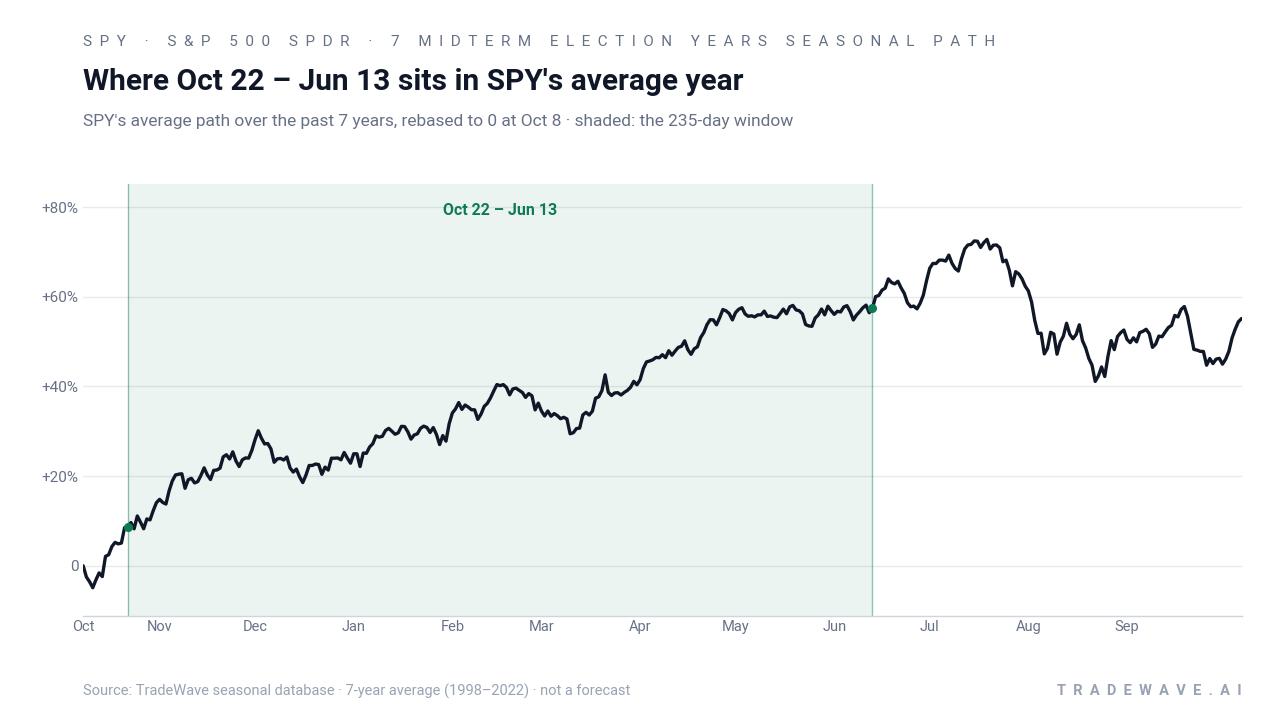
Year-by-year ranges highlight how much SPY has typically swung inside this window before locking in those gains.
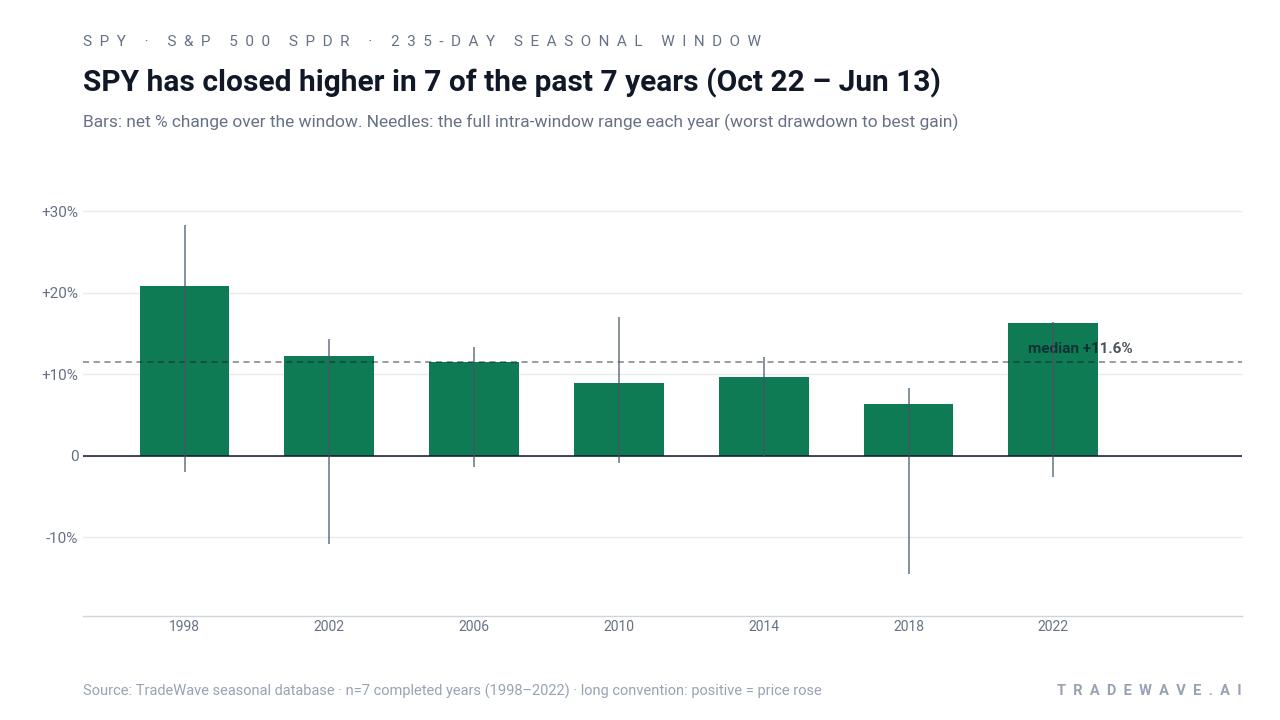
The stacked net, best-case and worst-case excursions underline the key message: this has been a consistently positive long window for SPY, but not a low-volatility one. Years like 2018 combined a respectable 6.38% gain with a 14.5% worst drawdown, while others such as 2006 and 2014 saw much shallower downside. Add it up and the cumulative return from repeatedly holding only this 235-day slice across the seven midterm election years compounds to 123.15%, a powerful result for a single recurring window.
History does not guarantee future results, and even in this all-winner sample, adverse excursions inside the window have at times been large.
Why does S&P 500 SPDR (SPY) follow this seasonal pattern?
One likely driver is the way the policy calendar and investor positioning shift between the midterm election and the following pre-election year. Analysts often point to reduced political uncertainty, more predictable fiscal policy and a tendency for central banks to avoid major shocks ahead of presidential races, all of which can support risk assets. This pattern may also reflect institutional portfolio rebalancing and sector rotation into cyclicals and growth as earnings visibility improves into the pre-election year.
What is driving S&P 500 SPDR (SPY) today?
S&P 500 SPDR ended the prior session at 747.03, up 0.72% on the day, leaving it about 3.7% below its 52-week high of 775.51 and roughly 19.9% above its 52-week low of 622.95. The ETF’s leadership remains heavily tied to large-cap technology and AI-linked names, with recent coverage of continued hyperscaler investment reinforcing the idea that the AI trade is still a core pillar of the index’s strength.[1] At the same time, macro commentary heading into 2026 has flagged a mix of tailwinds and risks, from a recovery in U.S. manufacturing to lingering concerns about valuations, interest rates and the possibility that the economy could slow more sharply than equity prices imply.[1]
The chart below places that latest move in the context of the past year and overlays the historical 60-day seasonal path.
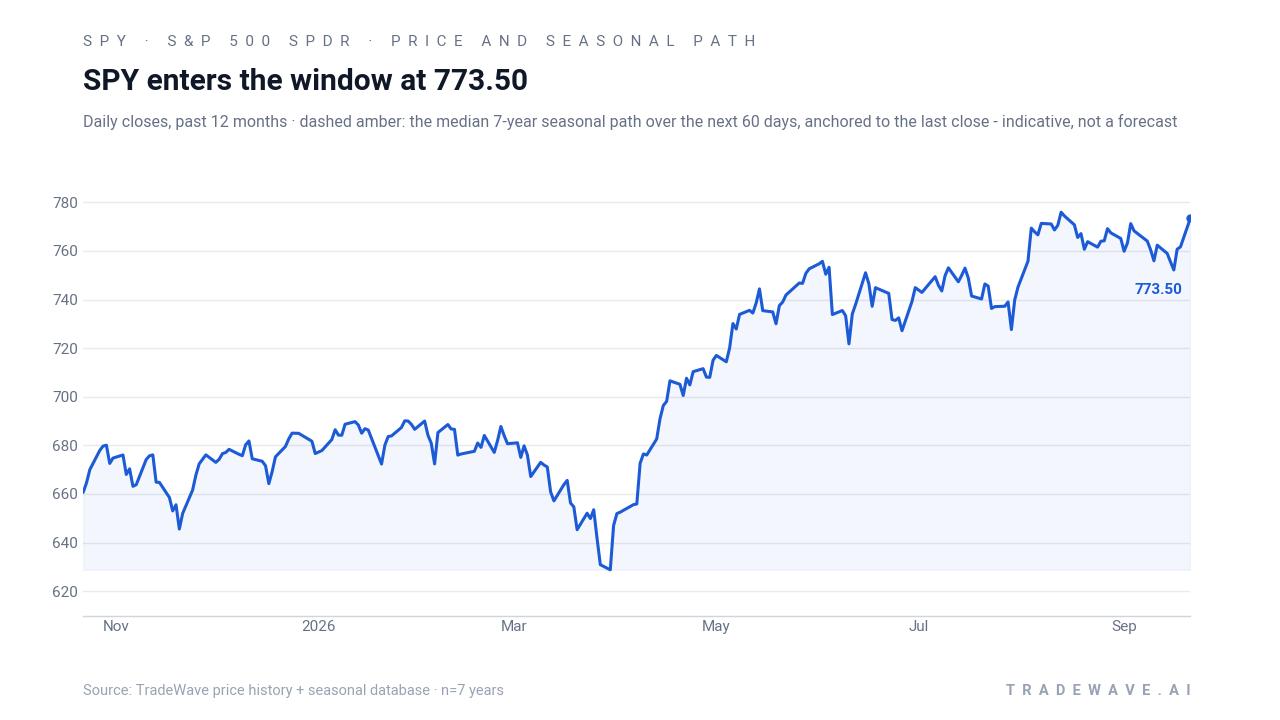
In the background, technical work on the S&P 500 earlier this year highlighted that the index had already logged a powerful run and was approaching key resistance zones, a reminder that even strong seasonal regimes can encounter turbulence when valuations are stretched.[1] For traders, the tension is clear: SPY is near the top of its one-year range, macro narratives are mixed, yet the calendar is about to flip into a window that has historically rewarded long exposure across every midterm election cycle in the sample.
What should traders watch as the Oct 22 window approaches?
First, the calendar itself matters. The Oct 22 start date drops SPY into the late part of the midterm election year and then carries through much of the pre-election year, a phase that has often coincided with friendlier policy and stronger risk appetite. How the ETF behaves around that handoff will be an early tell on whether this cycle is tracking the historical midterm-to-pre-election script or breaking away from it.
Second, levels near the 52-week high around 775.51 are likely to be important reference points. A decisive break above that zone as the window opens would be consistent with prior years where gains built steadily from late October, while repeated failures there could signal that valuations and macro worries are starting to bite despite the supportive seasonal backdrop.
Third, volatility inside the window deserves attention. Past cycles show that even winning years have seen double-digit drawdowns at times, so traders may want to monitor how SPY reacts to macro headlines on growth, inflation and Fed policy as the window progresses.[1] A pattern of shallow pullbacks and quick recoveries would rhyme with smoother years like 2014, while deeper, more persistent dips would look more like 2002 or 2018.
Finally, leadership within SPY will be key. If AI-driven megacaps and cyclicals tied to the manufacturing rebound continue to carry the tape, the historical seasonal trend could again align with sector fundamentals.[1] If those pillars falter, the same window that has delivered 123.15% cumulative gains across seven cycles could still be positive but far choppier than the headline averages suggest.
Sources
About this seasonal analysis
Seasonal pattern data is sourced from TradeWave.ai, which analyzes historical price behavior across annual calendar windows going back up to 30 years. Read the full data methodology or the book The 100-Year Pattern by Afshin Moshrefi (2026 edition). Past performance of seasonal patterns does not guarantee future results. This article is for informational purposes only and does not constitute investment advice.