Geopolitical Jitters and Call Buying Drive Gold (COMEX) (GC) Toward Its Bullish Oct-Jan Stretch
Gold (COMEX) is treading water near $4,187 just as it approaches an Oct 3–Jan 16 window that has quietly delivered gains in every midterm election year in the past two decades.
Price as of Oct 1, 2026: $4,188.50 (intraday).
What is the seasonal pattern for Gold (COMEX) (GC)?
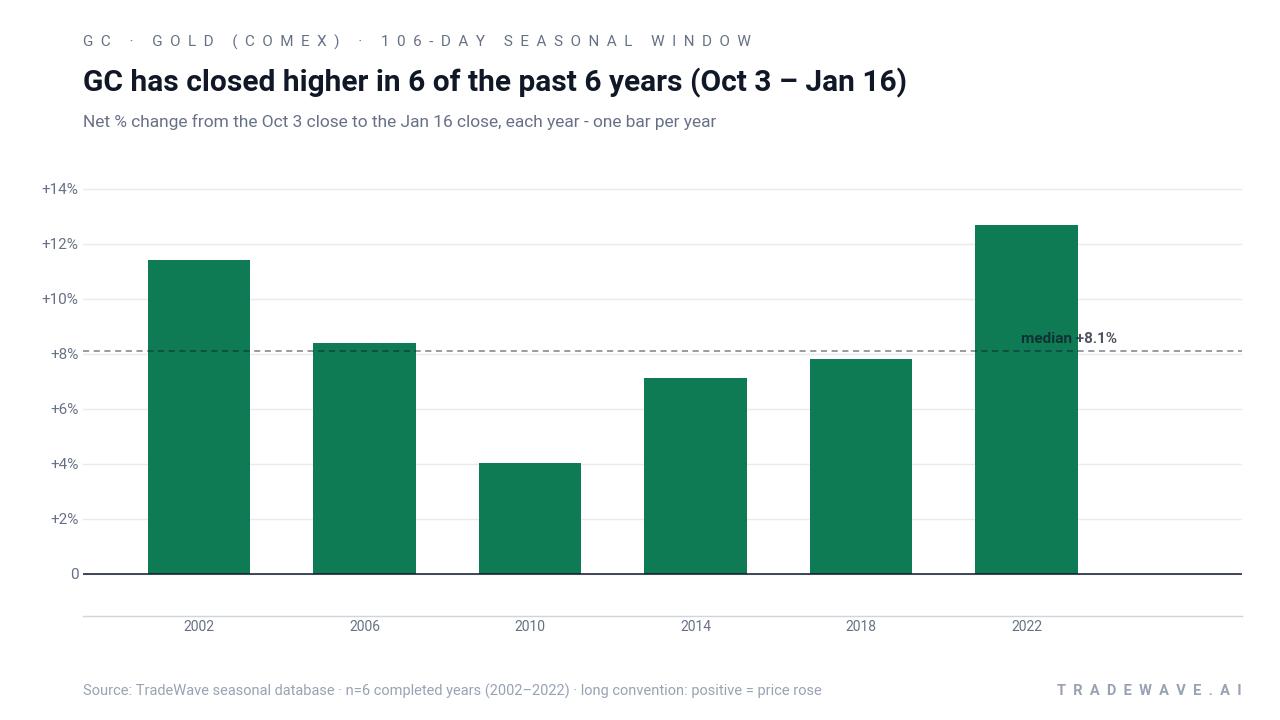
Gold (COMEX) has risen in 6 of 6 midterm election years during the Oct 3–Jan 16 window, with an average gain of 8.56% in winning years.
- 6 for 6 in this window, averaging 8.56% gains in winning years across the last 6 midterm election years.
- Seasonal window runs from Oct 3 through Jan 16, spanning 106 calendar days in the late part of the midterm election year.
- Percent Profitable is 100.0%, with 6 winners and 0 losers in the historical sample.
- Avg Profit of 8.56% reflects all years in the sample, since every window finished higher.
- TradeWave Ratio of 3.53 suggests price has typically traveled meaningfully in the long direction within the window.
- Sharpe ratio of 2.38 points to a historically strong risk-adjusted profile for this specific Gold (COMEX) trading window.
According to historical data from TradeWave.ai, this late midterm-year stretch has behaved very differently from an average quarter for Gold (COMEX), and the next iteration is about to open.
How strong is the upcoming seasonal window for Gold (COMEX) (GC)?
Gold (COMEX) has finished higher in every single Oct 3–Jan 16 window across the last six midterm election years, averaging an 8.56% gain for long positions. The contract heads into this regime at about $4,187 per ounce, well below its 52-week high near $5,586 and still above the $3,913 low that marked the bottom of the past year’s range.[2] That combination of a strong historical season and a market trading in the middle of a wide 52-week band gives this window more weight than a typical year-end drift.
The pattern is grouped by the presidential election cycle, focusing on the last six midterm election years rather than six consecutive calendar years. That matters because midterm years often bring a distinct policy mix, with Washington wrestling over budgets and the Federal Reserve managing inflation and growth concerns, which can change how gold trades compared with other phases of the cycle.[4]
Across those six midterm-year samples, the trade direction is long and the record is clean: 6 winners, 0 losers, for a Percent Profitable reading of 100.0%. Average profit across all years is 8.56%, with a median outcome of 8.09%, which tells you the gains have been fairly clustered rather than driven by a single outlier year. The strongest window in the sample came in 2022, when GC rallied 12.66% from an entry near $1,692.90 to an exit around $1,907.20, while the softest still delivered a 4.01% gain in 2010.
Intraperiod behavior has been directional but not one-way. In 2006, for example, gold’s best run-up within the window reached 12.74% before settling back to an 8.38% net gain, while the worst drawdown from entry was a relatively modest 2.74%. In 2014 and 2022, the contract still finished higher but endured deeper adverse moves of roughly 4.97% and 4.6% from the starting level before recovering, underscoring that even “all green” years have required sitting through some volatility.
Year-by-year ranges show how far GC has tended to swing inside the window before settling at its final result.
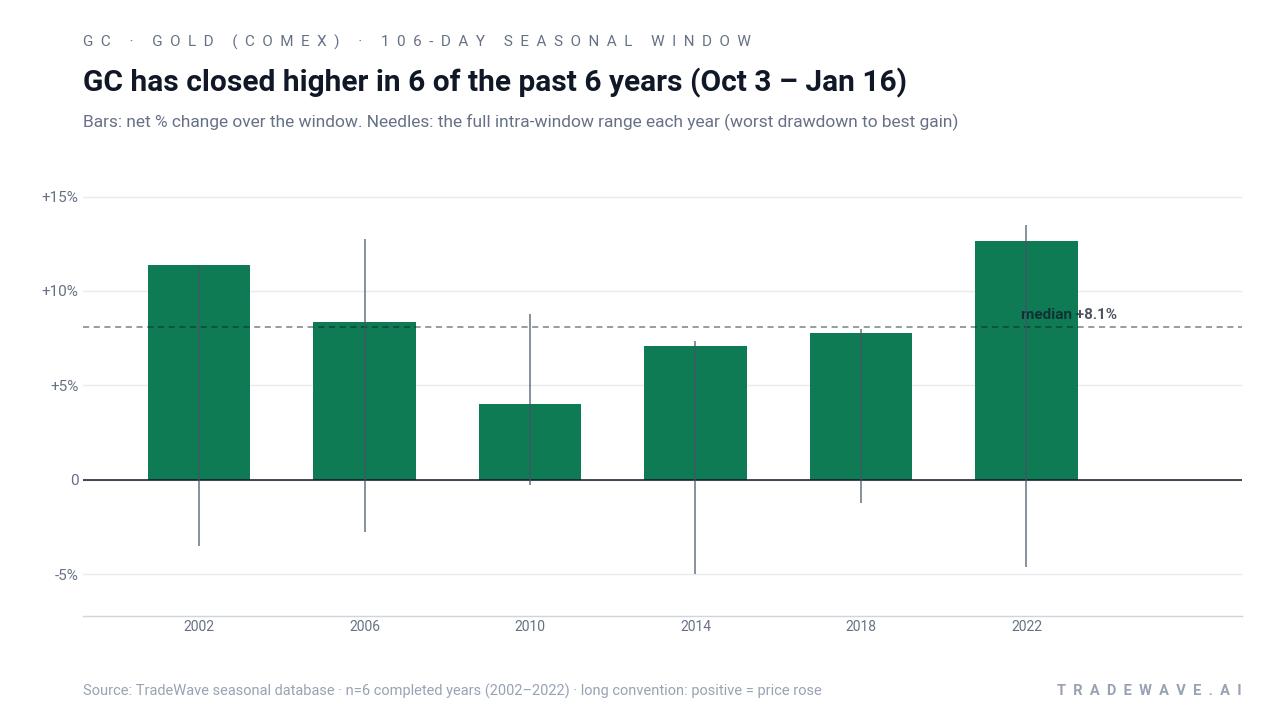
The bar-and-needle profile shows a consistent pattern: every bar is positive, but the needles extend both above and below, capturing the best and worst excursions from entry. In several years, the maximum favorable move within the window ran into low double digits, while the maximum adverse move stayed in the low to mid single digits, which lines up with the TradeWave Ratio of 3.53 and a Sharpe ratio of 2.38. Add it up: stacking this 106-day slice across the six midterm election years compounds to a 63.32% cumulative gain, a rare level of consistency for any commodity window.
History does not guarantee future results; adverse excursions can still be sizable even in windows where every historical sample finished higher.
Why does Gold (COMEX) (GC) follow this seasonal pattern?
One likely driver is the way midterm election years cluster fiscal debates, Fed decisions and geopolitical risk into the fourth quarter, which often boosts demand for perceived safe havens like gold.[4][5] The Oct–Jan stretch also captures year-end portfolio rebalancing and physical buying tied to holidays and festival seasons in key consuming regions, which can tighten supply in futures markets. This pattern may reflect that mix of policy uncertainty, dollar swings and seasonal demand rather than any single recurring headline.
What is driving Gold (COMEX) (GC) today?
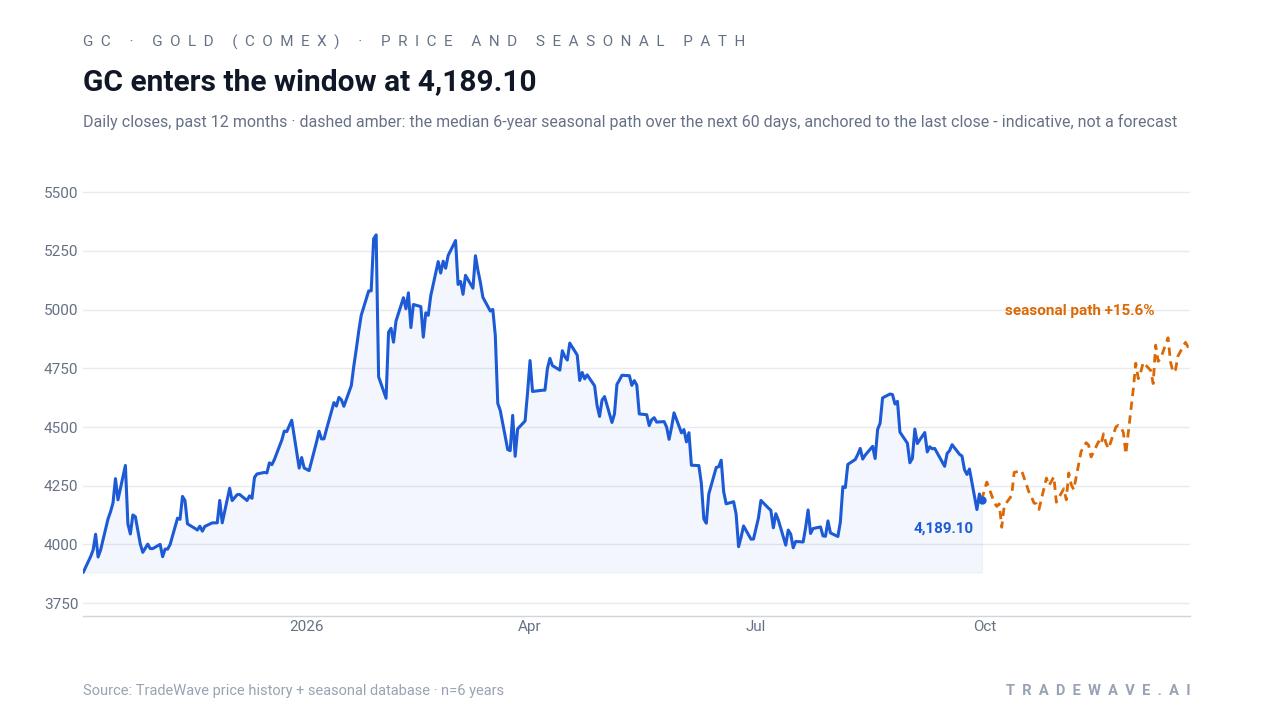
Gold (COMEX) front-month futures settled around $4,187.10 on Thursday, slipping about 0.05% on the day as traders weighed a firm dollar against lingering geopolitical and inflation worries.[2][3] The contract sits roughly 25.0% below its 52-week high near $5,586.20 and about 7.0% above the $3,913.70 low, leaving it in the middle of a wide one-year range with 20-day average volume near 132,000 contracts that dwarfs Thursday’s roughly 11,600-lot turnover.[2][9]
In late August, gold futures pushed to a three-month high as a softer U.S. dollar and lower Treasury yields revived interest in the metal, with technicians pointing to bullish breakouts and heavier call buying in gold-linked products.[5] That move followed a choppy first half of 2026, when firmer dollar and rate expectations at times pressured bullion even as geopolitical tensions in the Middle East periodically sent safe-haven flows back into the complex.[6] Earlier in the year, a broad rally across gold, silver and copper underscored how quickly sentiment can flip when investors refocus on inflation and macro risk, prompting some analysts to lift their medium-term gold outlooks.[8]
Options activity has also been part of the story. In late August, a large trade in a gold-linked ETF lit up the options tape, with traders flagging the size and structure as a potential sentiment tell for the broader gold market rather than a one-off hedge.[7] While that flow was not specific to COMEX futures, it underscored how quickly positioning can build when macro narratives shift, especially with open interest in some GC contracts already elevated compared with late 2025 levels.[1][7]
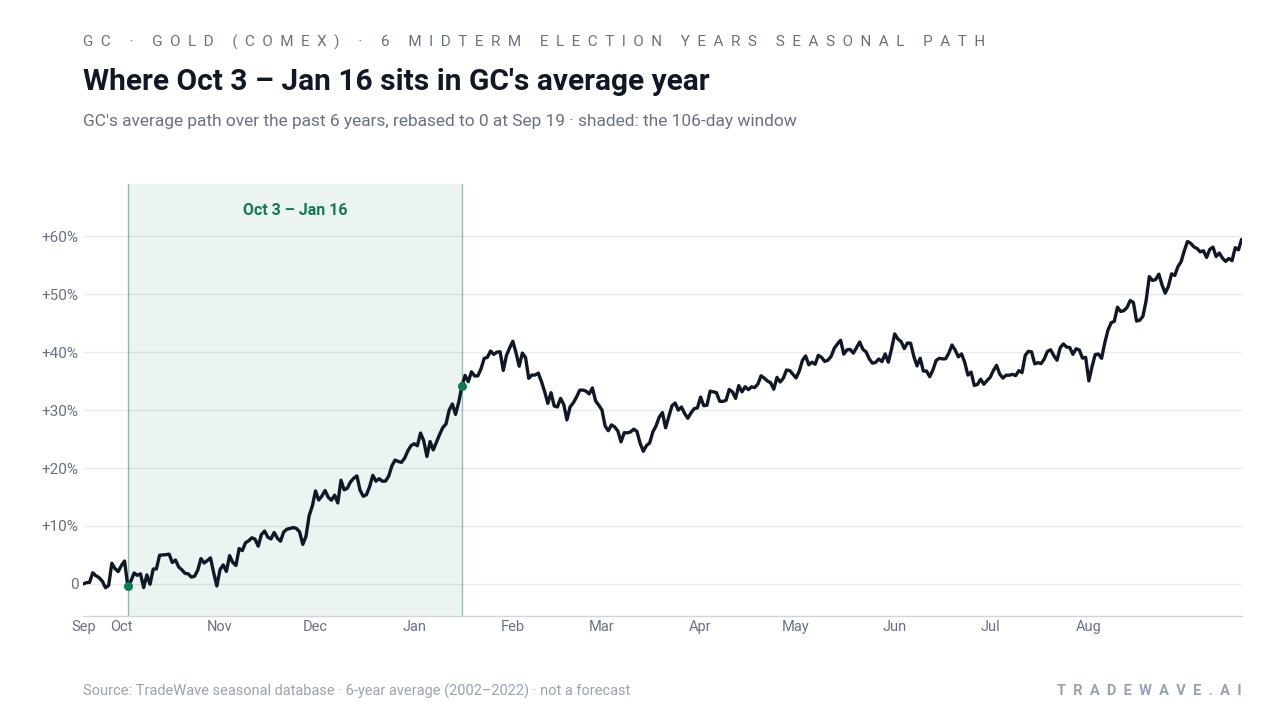
The chart below situates the latest move in its recent multi-month context alongside the median seasonal path.
What should traders watch as this Gold (COMEX) window opens?
First, the calendar. The Oct 3 start date drops gold into the final stretch of the midterm election year, just ahead of a pre-election year that has often been friendlier to risk assets and, at times, to inflation hedges.[4] How GC behaves into early January will show whether this midterm-year pattern is still in force or starting to fade.
Second, the dollar and rates backdrop. The August rally showed how quickly a softer greenback and lower yields can re-ignite gold buying, and a repeat of that macro mix during the window would rhyme with prior midterm-year gains.[5] A persistently firm dollar or renewed hawkish tone from the Federal Reserve would be a clear test of the historical seasonality.
Third, options and positioning. If large, directional call structures in gold-linked ETFs or futures reappear as the window opens, that would signal that August’s options buzz was the start of a broader build in bullish exposure rather than a one-off trade.[7] Traders will be watching whether open interest and options skew continue to lean long or flip back toward hedging, which could either reinforce or blunt the historical GC seasonal trend.
Finally, price levels. On the downside, the $3,900–$4,000 zone that marked the 52-week low is the obvious line in the sand, while on the upside, the $5,500 area near the prior high is the long-term ceiling to monitor.[2][9] If gold spends this Oct–Jan stretch grinding higher with typical mid-single-digit drawdowns, it would fit the six-for-six pattern; a sharp break below the recent range or a failure to hold rallies would be the clearest sign that this midterm-year window is starting to behave differently from the past.
Sources
- CNBC - Gold COMEX (Jan'27) - Stock Price, Quote and News - CNBC
- MarketWatch - GC.1 | Gold (NYM $/ozt) Front Month Overview | MarketWatch
- MarketWatch - GC.1 | Gold (NYM $/ozt) Front Month Overview | MarketWatch
- CME Group - Gold Overview - CME Group
- CNBC - Gold rallies to 3-month high on weaker dollar, bullish technicals
- CNBC - Gold falls as markets assess prospects of Iran ceasefire
- CNBC - A massive trade just happened in gold. The options market is buzzing
- Yahoo Finance - Gold, silver, copper surge as explosive rally sweeps over metals market
- Yahoo Finance - Gold Dec 26 (GC=F) Stock Price, News, Quote & History
About this seasonal analysis
Seasonal pattern data is sourced from TradeWave.ai, which analyzes historical price behavior across annual calendar windows going back up to 30 years. Read the full data methodology or the book The 100-Year Pattern by Afshin Moshrefi (2026 edition). Past performance of seasonal patterns does not guarantee future results. This article is for informational purposes only and does not constitute investment advice.