Nike, Inc. (NKE) Has Rallied in 10 of 10 Midterm Late-October Windows, Averaging 5.67% Gains
Nike, Inc. is sitting just above its 52-week low as it heads toward a late-October midterm election-year window that has never produced a losing 20-day stretch in the past 10 cycles.
Price as of Sep 30, 2026: $35.40 (last close).

What is the seasonal pattern for Nike, Inc. (NKE)?
Nike, Inc. has risen in 10 of 10 midterm-year late-October windows, with an average gain of 5.67% in winning years.
- 10 for 10 in this window, averaging 5.67% gains in winning years across the last 10 midterm election cycles.
- Seasonal window runs from Oct 18 through Nov 6, spanning 20 calendar days in the midterm election year.
- Percent Profitable is 100.0%, with 10 winners and 0 losers in the historical sample.
- Trade Direction is long, with a TradeWave Ratio of 1.26 and a Sharpe ratio of 1.21 for this specific window.
- Individual years have seen maximum favorable moves as high as 26.18% and adverse moves as deep as -6.49% inside the window.
- Cumulatively, repeating this Nike, Inc. trading window across the 10 midterm years would have compounded to a 72.2% gain.
According to historical data from TradeWave.ai, this late-October stretch for Nike, Inc. behaves very differently from an average month on the calendar. The next section walks through how that pattern has played out across past midterm election years.
How has Nike, Inc. (NKE) traded in the late-October midterm window?
Nike, Inc. has closed higher in every one of the last 10 midterm election years during the Oct 18 to Nov 6 window, averaging a 5.67% gain over those 20 days. Today the stock finished at 35.40, down 1.2% on the session and sitting about 51.9% below its 52-week high and roughly 0.5% above its 52-week low.
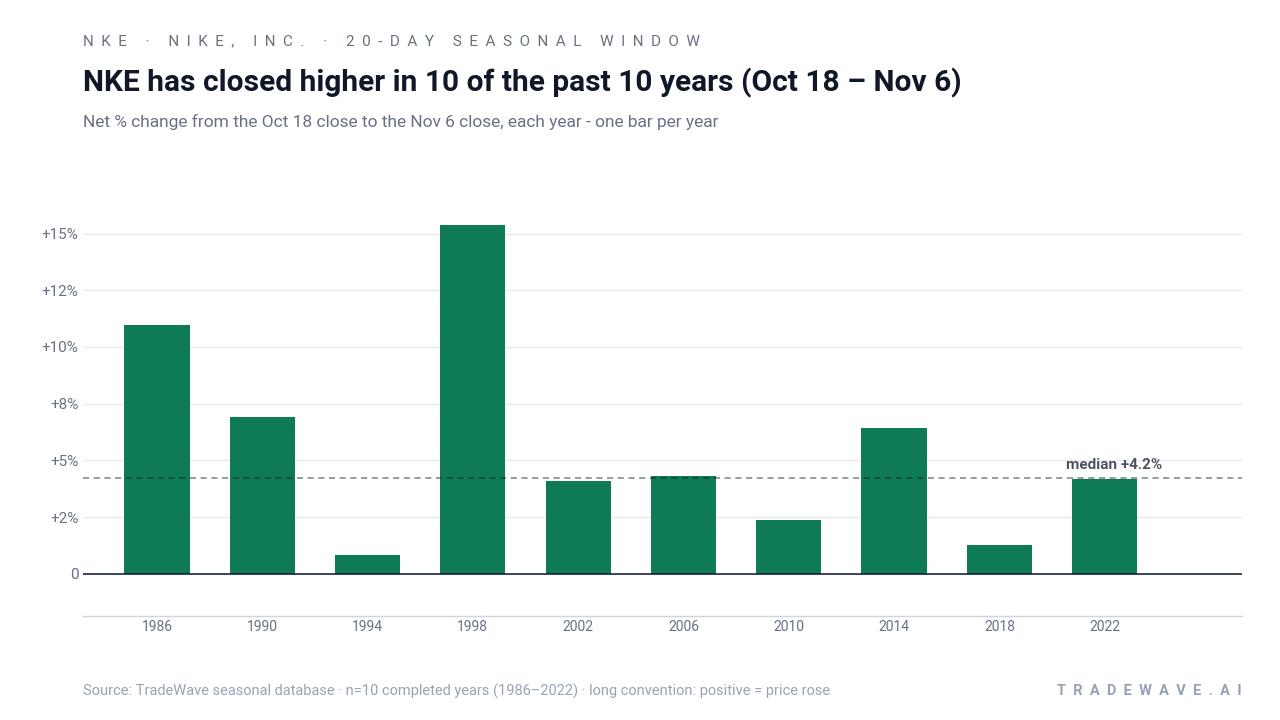
The presidential election cycle matters here because this pattern only looks at the last 10 midterm election years, a phase that often features policy uncertainty, tariff debates and shifting consumer sentiment before the typically stronger pre-election year. Grouping Nike, Inc.’s late-October behavior by this specific phase filters out noise from other parts of the four-year cycle and focuses on how the stock has traded as midterm years wrap up and investors start positioning for the year before the presidential election.
This seasonal window begins on Oct 18 and spans 20 days. Historically, during this period in midterm election years, Nike, Inc. has shown a strong upside tendency in the long direction, with every completed year finishing in the green. The average gain across all 10 years is 5.67%, with a median outcome of 4.24%, which means the typical result has been a mid-single-digit rally rather than a one-off outlier spike.
The per-year breakdown shows how consistent that NKE seasonal trend has been. The weakest year in the sample was 1994, when the stock still managed a 0.82% net gain over the window, while the strongest was 1998, when Nike, Inc. rallied 15.36% between Oct 18 and Nov 6. Add it up and stacking those 10 midterm-year windows would have produced a 72.2% cumulative return, even though each trade only lasted 20 calendar days.
Intraperiod swings have been meaningful. Maximum favorable moves inside the window have ranged from 2.05% in 1994 to 26.18% in 1986, showing that in strong years the stock has often pushed well beyond the final close before consolidating. On the downside, the worst drawdowns from entry have run as deep as -6.49% in 2018, while several years, such as 2014, saw almost no adverse move at all before finishing higher. That mix of sizable peak run-ups and occasional sharp dips is what drives the TradeWave Ratio of 1.26, which captures how far price typically travels in the trade direction within the window regardless of where it ends.
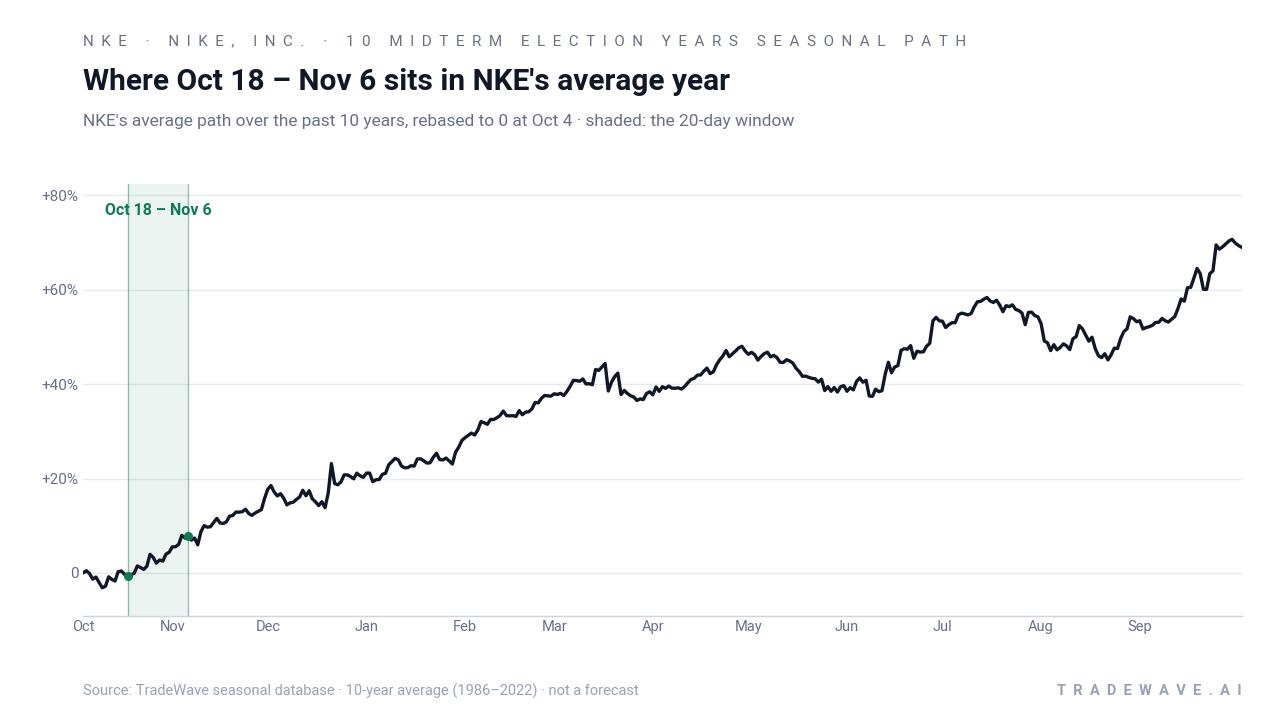
The next view combines yearly net results with the full intraperiod range, from worst drawdown to best rally.
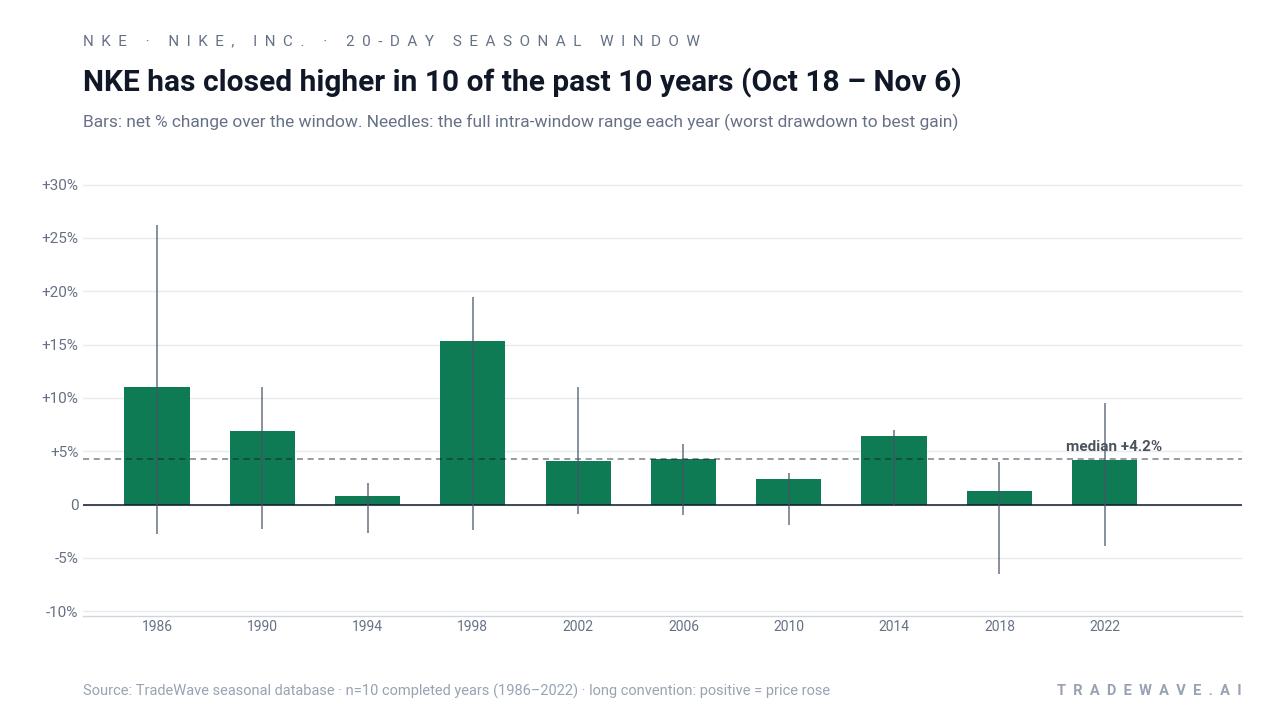
The combined net / maximum favorable / maximum adverse view shows a clear pattern. In most years, Nike, Inc. has spent part of the window in drawdown before finishing higher, with adverse excursions often in the -2% to -4% range and favorable spikes that can run into double digits. That profile lines up with the Sharpe ratio of 1.21, which reflects a solid risk-adjusted average return based on end-of-window outcomes rather than intraday noise.
History does not guarantee future results; adverse excursions can be large even in winning windows, and a 100% hit rate over 10 cycles does not mean the next iteration will automatically follow the same script.
Ten for ten with mid-single-digit average gains is the headline: this has been a remarkably consistent bullish window for Nike, Inc. in late October of midterm election years.
Why does Nike, Inc. (NKE) follow this seasonal pattern?
One likely driver is the clustering of Nike, Inc.’s fiscal-year communication and guidance resets around the fall, which can reset expectations just as investors reposition portfolios into year-end. This pattern may also reflect consumer spending cycles, with markets looking ahead to holiday demand for athletic footwear and apparel as midterm election uncertainty begins to fade. In midterm years specifically, analysts have pointed to sector rotation into quality consumer brands as policy visibility improves heading into the year before the presidential election.
What is driving Nike, Inc. (NKE) today?
Nike, Inc. closed Thursday at 35.40, down 0.44 on the day, leaving the stock roughly 51.9% below its 52-week high of 73.67 and only slightly above its 52-week low of 35.22. That slide follows a difficult stretch in fiscal 2026, when management guided for a 2% to 4% decline in fiscal fourth-quarter sales versus expectations for growth, a move that triggered a sharp postmarket drop at the time as investors questioned the growth story in key regions such as Greater China.[1]
The chart below situates the latest move in its recent multi-month context alongside the historical 60-day seasonal projection.
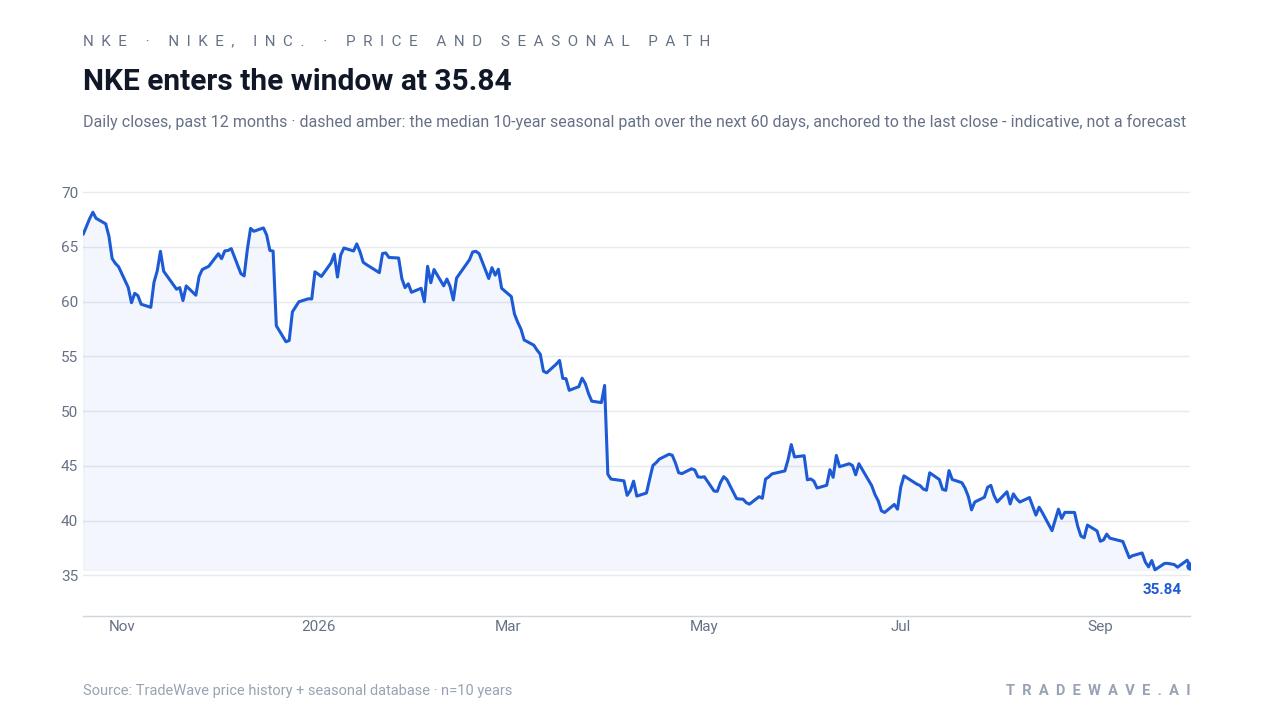
In early 2026, Nike, Inc. was still viewed as one of the more highly valued names in the footwear and retail space despite a sizable year-to-date drop, with commentary flagging weakness in Greater China and both direct and wholesale channels as pressure points.[1] At the same time, analysts were watching tariff policy and broader geopolitical risks, including conflict in the Middle East, as potential headwinds for input costs and global demand for discretionary goods like sneakers and apparel.[1]
Those macro and sector narratives form the backdrop as the market approaches a late-October window that has historically been kind to Nike, Inc. The stock is entering that period from a position of technical stress, with the 50-day moving average up at 39.38 and the 20-day average volume near 33 million shares, suggesting any shift in sentiment could show up quickly in trading activity.
What should traders watch in this Nike, Inc. seasonal window?
First, the calendar. The 20-day Nike, Inc. trading window tied to the midterm election cycle runs from Oct 18 through Nov 6, so price action in the days leading into that start date will shape how stretched or compressed the setup looks. A continued drift near the 52-week low would mean any historical late-October strength would be starting from a depressed base, while an early bounce could blunt some of the potential upside implied by past cycles.
Second, levels. On the downside, the 52-week low around 35.22 is the immediate line in the sand, while on the upside, the 50-day moving average near 39.38 is the first technical hurdle that has capped rallies in recent months. How Nike, Inc. behaves around those levels during the Oct 18 – Nov 6 window will tell traders whether this midterm-year seasonal pattern is repeating or breaking.
Third, macro and policy headlines. Any fresh developments on tariffs, trade policy or geopolitical risk that affect global consumer demand could either reinforce or overwhelm the historical seasonality for a global brand like Nike, Inc.[1] The transition from the concluding midterm election year into the year before the presidential election has often coincided with shifts in fiscal stance and risk appetite, which can amplify moves in consumer discretionary leaders.
Finally, behavior versus the historical script. In prior midterm cycles, Nike, Inc. has often seen some early-window chop followed by a stronger push higher, with intraperiod drawdowns that can still sting even when the final result is positive. If the stock spends this year’s window grinding sideways near the lows or breaking materially below the 52-week floor, that would be a clear departure from the 10-for-10 record and a sign that current fundamentals and macro forces are overpowering the usual NKE seasonal trend. If, instead, the stock quickly reclaims the 50-day moving average and starts to track the historical late-October upswing, traders will have fresh evidence that this election-cycle pattern is still in play.
Sources
About this seasonal analysis
Seasonal pattern data is sourced from TradeWave.ai, which analyzes historical price behavior across annual calendar windows going back up to 30 years. Read the full data methodology or the book The 100-Year Pattern by Afshin Moshrefi (2026 edition). Past performance of seasonal patterns does not guarantee future results. This article is for informational purposes only and does not constitute investment advice.