Nvidia (NVDA) Rides $1.2T AI Spending Wave Into a 6-for-6 Late-October Midterm Rally Window
Nvidia is heading toward a late-October trading window that has never been down in past midterm election years, just as the AI chip leader trades near record territory after blockbuster data center results and aggressive growth guidance.
Price as of Sep 30, 2026: $228.38 (last close).
What is the seasonal pattern for Nvidia (NVDA)?
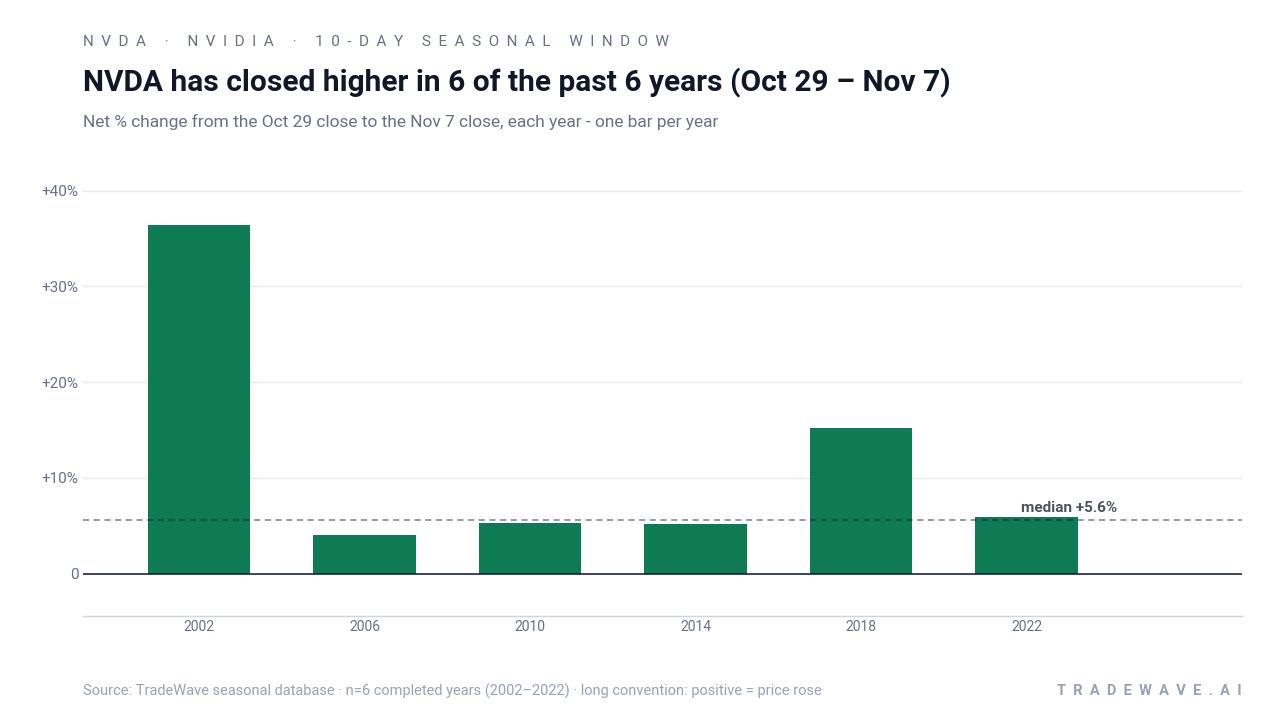
Nvidia has risen in 6 of 6 midterm election years during the Oct 29 to Nov 7 window, with an average gain of 12.02% in winning years.
- 6 for 6 in this window, averaging 12.02% gains in winning years across the last 6 midterm election years.
- The upcoming Oct 29 to Nov 7 trading window has been a bullish NVDA seasonal trend, with 100.0% Percent Profitable, 6 Winners and 0 Losers.
- Average profit of 12.02% over the 10-day stretch reflects a strong upside skew for long positions in prior cycles.
- The TradeWave Ratio (TWR) of 0.9 suggests price has typically traveled meaningfully in the trade direction within the window, independent of the final close.
- A Sharpe ratio of 0.95 for this window points to favorable risk-adjusted returns compared with typical short-term swings.
- Individual years have still seen intraperiod drawdowns, so traders have needed to sit through volatility even when the final result was positive.
According to historical data from TradeWave.ai, this late-October stretch for Nvidia behaves very differently from an average month on the calendar. The next section walks through how that pattern has played out across past midterm election years and what it means as 2026 wraps up the current midterm cycle.
How has Nvidia (NVDA) traded in the late-October midterm-year window?
Nvidia has risen in 6 of 6 midterm election years during the Oct 29 to Nov 7 window, averaging 12.02% gains for long positions as the market wraps up the midterm election year phase. Shares finished the prior session at $228.38, up 0.5% on the day and sitting just below their 52-week high around $235.99, keeping the stock in a tight band near record levels.
Grouping the data by the presidential election cycle matters here because Nvidia’s strongest late-October behavior has shown up specifically in midterm election years, not in a generic calendar-average. The current market is concluding the midterm election year and about to roll into the pre-election year, a phase that has often coincided with more supportive policy tone and risk-on positioning in large-cap growth stocks.
Historically, this 10-day Nvidia trading window has been a clean long setup. Percent Profitable sits at 100.0%, with 6 Winners and 0 Losers across the last six midterm election years, and the average profit of 12.02% means the typical gain has been double-digit over just a week and a half. The median profit of 5.64% shows that while one or two outsized years lift the average, even the middle-of-the-pack outcomes have been meaningfully positive.
The per-year breakdown shows how wide that range can be. In 2002, Nvidia logged a 36.36% net return in the window, with a maximum favorable move of 54.77% and no meaningful drawdown from entry, while 2018 delivered a 15.18% gain with a 19.6% best intraperiod rally and essentially zero adverse move. At the other end of the spectrum, 2006 still finished up 4.06% but saw a worst intraperiod drawdown of -3.82%, and 2022 posted a 5.96% gain after sitting through a -4.01% dip at one point.
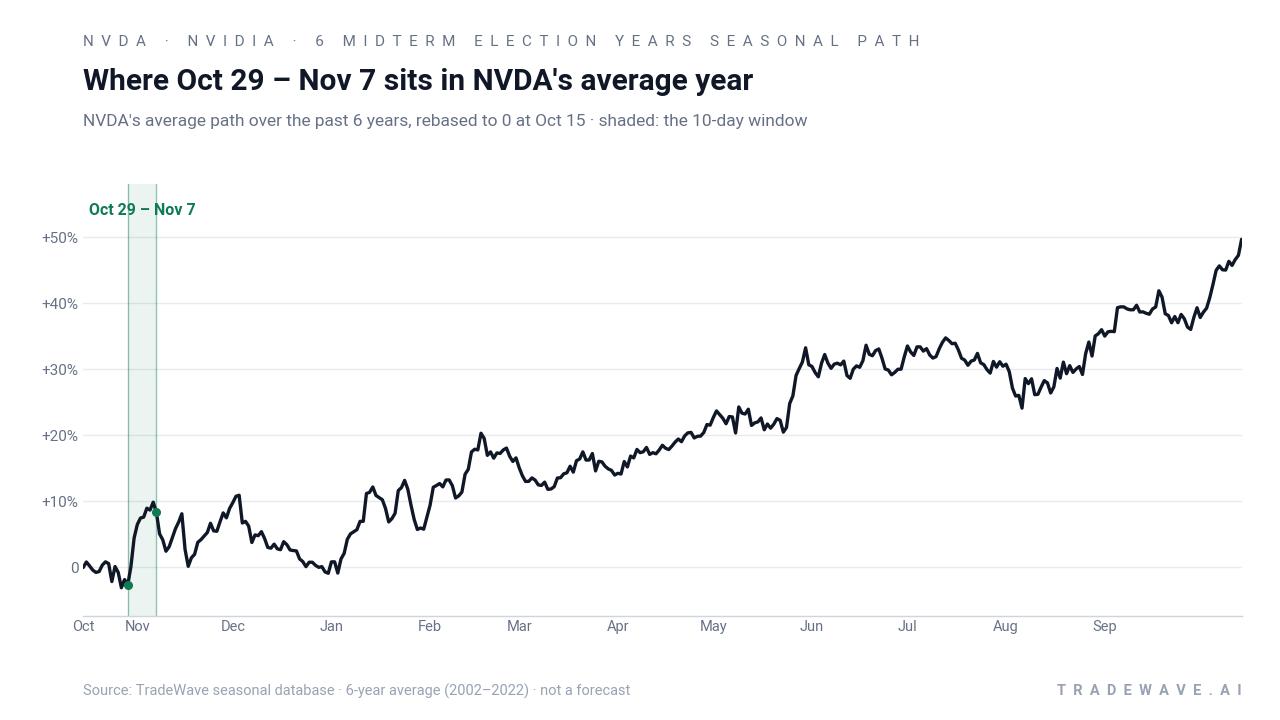
The historical seasonal average trend line suggests that strength in this window tends to build fairly quickly once the period starts. Trend statistics show 53 long-biased days versus 0 short-biased days across the broader pattern context, and within the 10-day slice the average path slopes higher rather than grinding sideways. That fits with the idea that when this window works, it often does so by lifting early and then consolidating rather than waiting until the final days to move.
A second view shows how each year’s best rally and worst drawdown have stacked up inside this 10-day stretch.
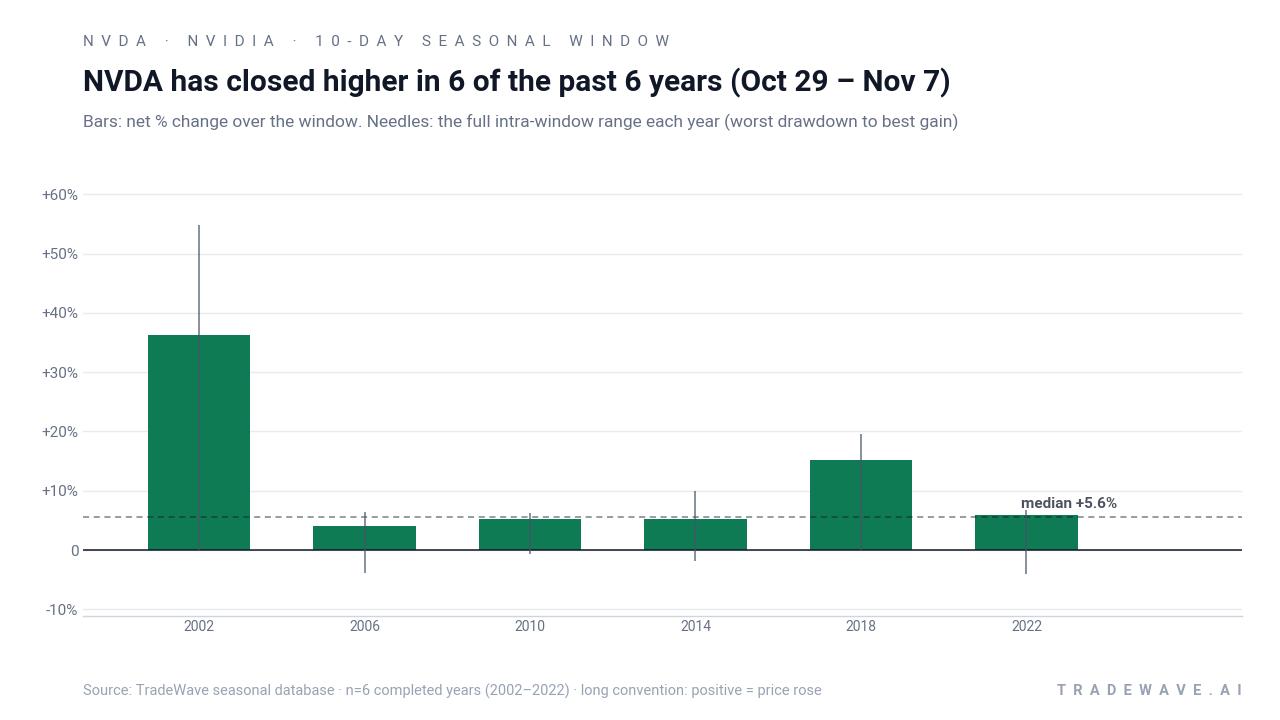
The combined net / maximum favorable / maximum adverse profile shows a clear upside bias but not a free ride. Maximum favorable excursions have ranged from mid-single digits to more than 50%, while maximum adverse excursions have typically stayed in the low single digits, with a few years dipping around -4%. That mix is what drives the 0.9 TradeWave Ratio and a 0.95 Sharpe ratio, signaling that historically the upside has outweighed the downside in this specific slice of the calendar.
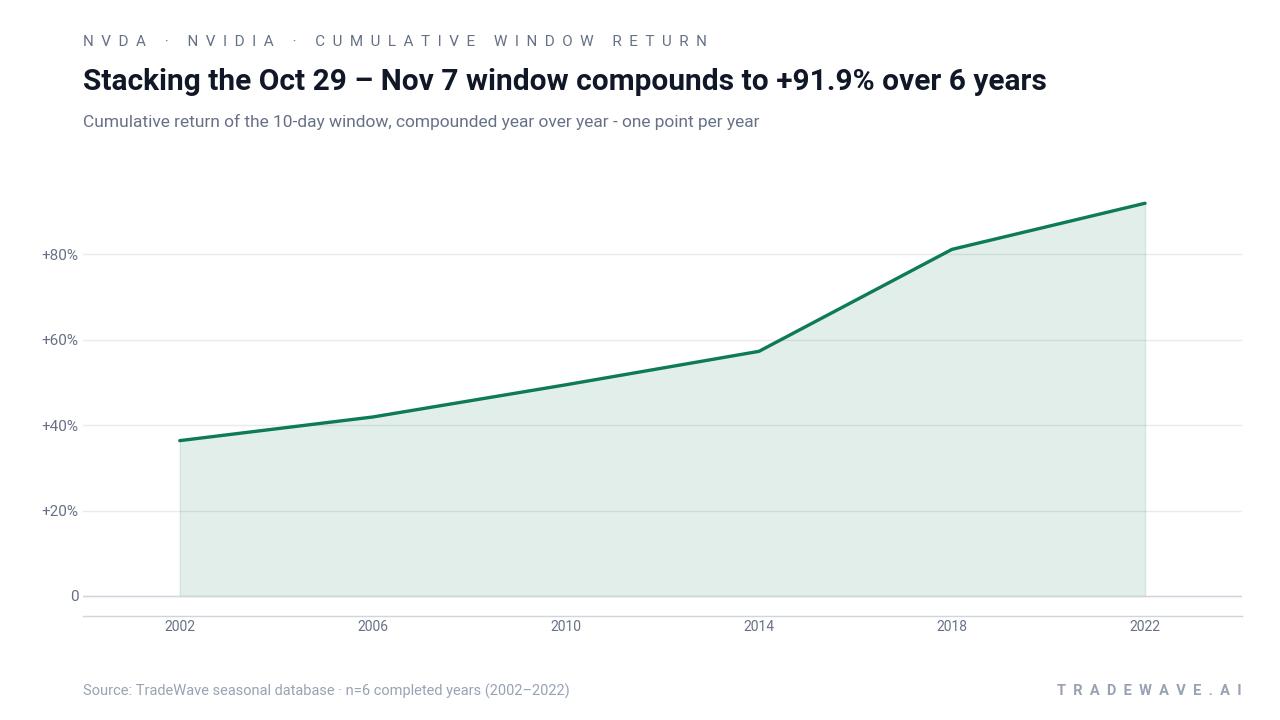
Stacking those 10-day trades year after year compounds to a 91.93% cumulative return across the six midterm election years in the sample. Add it up: a trader who only held Nvidia during this narrow late-October window in those years would have nearly doubled their money on that slice alone, even before considering the rest of the calendar.
History does not guarantee future results; adverse excursions can still be meaningful even in windows where every historical instance finished higher.
Why does Nvidia (NVDA) follow this seasonal pattern?
One likely driver is the way Nvidia’s earnings calendar and guidance cadence line up with the broader presidential election cycle. Late October in midterm election years often finds investors repositioning into large-cap growth and AI leaders ahead of the stronger pre-election year, while digesting fiscal and regulatory signals that can favor data center and semiconductor spending. This pattern may also reflect institutional portfolio rebalancing and options positioning around Nvidia’s fall earnings and year-end benchmarks, which can concentrate buying interest into a short, repeatable window.
What is driving Nvidia (NVDA) today?
Nvidia closed Thursday at $228.38, up 0.5% on the session and about 3.2% below its 52-week high near $235.99, extending a modest 2.91% gain over the past month as traders digest a massive AI-driven earnings upgrade cycle. In late August, the company reported Q2 FY2027 revenue of $96.2 billion, with roughly 92% coming from its data center segment, and net income more than doubling to $53.95 billion, even as earnings per share came in below LSEG’s consensus forecast because of heavy investment and mix effects.[2][3][5] Management guided current-quarter sales to $108 billion plus or minus 2% and flagged that the outlook excludes China data center revenue, a reminder that export controls and geopolitical risk still hang over the story even as hyperscalers race to build AI infrastructure.[2][3]
Analysts remain broadly constructive, with MarketWatch’s aggregated estimates showing a Buy consensus rating and a consensus price target of $333.47, which sits well above the current share price and reflects expectations formed in a higher-volatility regime earlier this year.[1] CNBC’s coverage of the August report highlighted intense investor focus on Nvidia’s data center backlog and the company’s comment that fiscal 2028 revenue could grow about 70%, a figure that has helped anchor the broader AI and semiconductor sector seasonal outlook as investors look past near-term export headwinds.[2][5] Against that backdrop, Nvidia’s role as a key weight in major indices means any sharp move during the upcoming late-October seasonal window could ripple through AI-heavy ETFs and the wider S&P 500, especially as the market transitions from the midterm election year into the historically more supportive pre-election year.
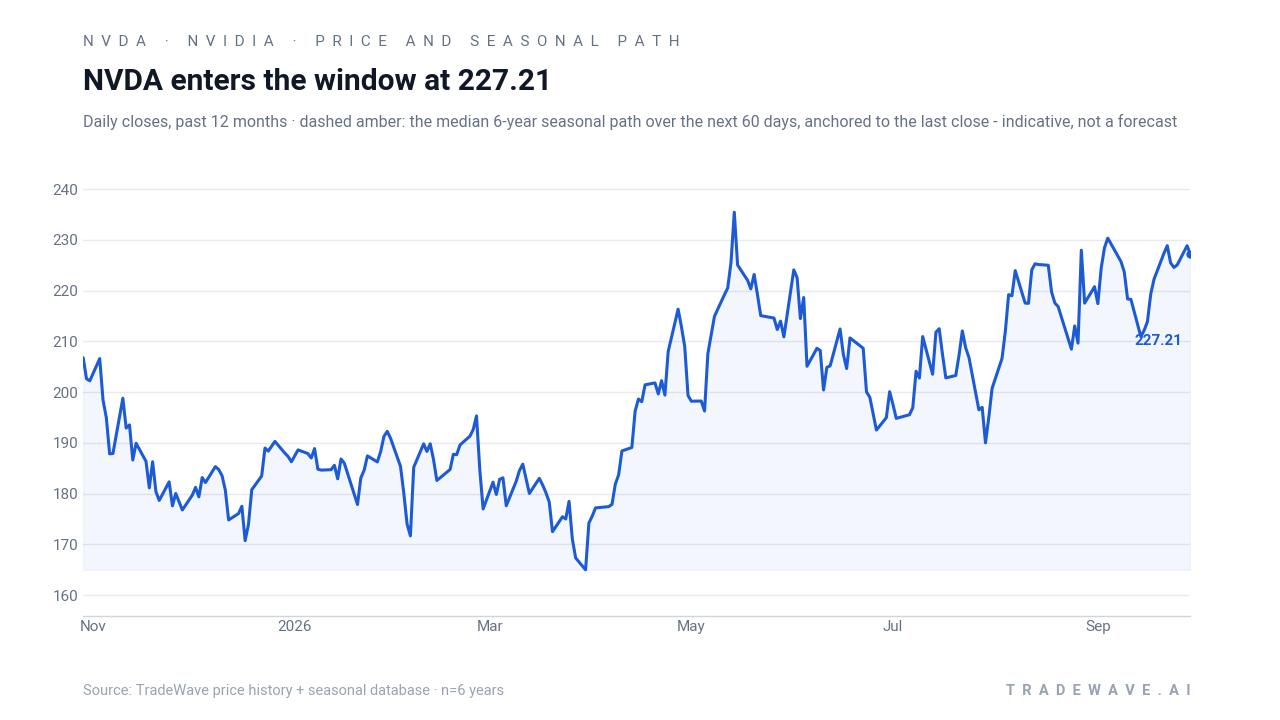
The chart below situates the latest move in its recent multi-month context alongside the historical seasonal projection.
What should traders watch as the late-October window approaches?
First, the calendar: the 10-day window runs from Oct 29 through Nov 7, landing squarely in the final weeks of the midterm election year and just ahead of the pre-election year, when risk appetite has often improved for large-cap growth. How Nvidia behaves into and through that stretch will show whether the 6-for-6 historical record can extend or whether a crowded AI trade and policy uncertainty break the pattern.
Second, levels: with the stock only a few dollars below its 52-week high, traders will be watching whether NVDA can hold above the 50-day moving average around $216.98 on any pullbacks and whether a sustained push through the prior high near $235.99 occurs inside the window or stalls just before it. A breakout that develops early in the window and holds into November would rhyme with the historical seasonal trend, while a failure at the highs or a sharp rejection from that zone would mark a clear departure from the past six midterm election years.
Third, catalysts and positioning: Nvidia’s next earnings report is slated for early 2027, so this particular window is more about how investors position around AI infrastructure spending expectations, export-control headlines and broader macro data than about a single event.[2][3] Traders will be tracking whether options activity and institutional flows lean into upside exposure as the window opens or whether hedging demand dominates, which would signal more caution than the historical pattern suggests.
Finally, the broader policy calendar matters. As the United States moves from the midterm election year into the pre-election year, debates over AI regulation, data center energy usage and fiscal support for digital infrastructure could all influence sentiment toward Nvidia and its peers.[2] If those discussions tilt toward clarity and continued investment, the historical late-October strength window would be lining up with a supportive macro backdrop; if they instead highlight tighter controls or slower spending, traders may treat any seasonal tailwind as an opportunity to reduce risk rather than add it.
Sources
- MarketWatch - NVDA | NVIDIA Corp. Analyst Estimates | MarketWatch
- CNBC - Nvidia (NVDA) Q2 2027 earnings report: Live updates
- NVIDIA Investor Relations - NVIDIA Corporation - Financial Reports
- Barchart - Huge, Unusual Nvidia Call Options Volume - NVDA Trading Range Attracts Options Players
- MarketWatch (Financials) - NVDA | NVIDIA Corp. Annual Income Statement | MarketWatch
About this seasonal analysis
Seasonal pattern data is sourced from TradeWave.ai, which analyzes historical price behavior across annual calendar windows going back up to 30 years. Read the full data methodology or the book The 100-Year Pattern by Afshin Moshrefi (2026 edition). Past performance of seasonal patterns does not guarantee future results. This article is for informational purposes only and does not constitute investment advice.