Silver (SI) Has Rallied in 7 of 7 Midterm Winters, Averaging 11.29% Gains in This 96-Day Run
Silver futures hover near $61 as traders look toward a midterm-election-year winter window that has quietly delivered gains in every cycle on record, with sizable swings along the way.
Price as of Oct 1, 2026: $61.19 (intraday).
What is the seasonal pattern for Silver (SI)?
Silver has risen in 7 of 7 years during this late-October to early-February window, with an average gain of 11.29% in winning years.
- 7 for 7 in this window, averaging 11.29% gains in winning years across the last 7 midterm election cycles.
- Seasonal window runs from Oct 31 through Feb 3, spanning 96 days in the heart of the midterm-election-year winter.
- Percent Profitable is 100.0%, with 7 winners and 0 losers in the historical sample.
- Trade Direction is long, with a Sharpe ratio of 2.78 and a TradeWave Ratio of 2.21, pointing to strong risk-adjusted upside moves.
- Individual years have seen best intra-window rallies of up to 29.14%, but adverse drawdowns have reached as deep as about 12% before recovering.
- Cumulative gains from repeatedly holding only this window compound to 110.81% across the seven completed midterm-year cycles.
According to historical data from TradeWave.ai, this specific late-October to early-February stretch has behaved very differently from an average month on the silver calendar. The next section walks through what that pattern has looked like across past midterm election years.
How has Silver (SI) traded in the late-October to early-February window?
Silver has finished higher in every single late-October to early-February window across the last seven midterm election years, averaging 11.29% gains over each 96-day stretch. The upcoming window begins on Oct 31 and runs through Feb 3, with futures currently around $61.20 and sitting roughly midway between a 52-week low near $55 and a high around $121.79. In prior cycles, that combination of a strong winter seasonal trend and elevated volatility has produced both sharp rallies and deep interim pullbacks before the window closed in the green.
Grouping the data by the presidential election cycle matters here because midterm years often bring a distinct policy and liquidity backdrop compared with election or pre-election years. Fiscal debates, regulatory shifts and shifting expectations for central-bank policy have tended to cluster in this phase, and silver’s historical seasonality in this window reflects how traders have repeatedly repriced inflation hedges and industrial metals exposure as those macro stories evolved.
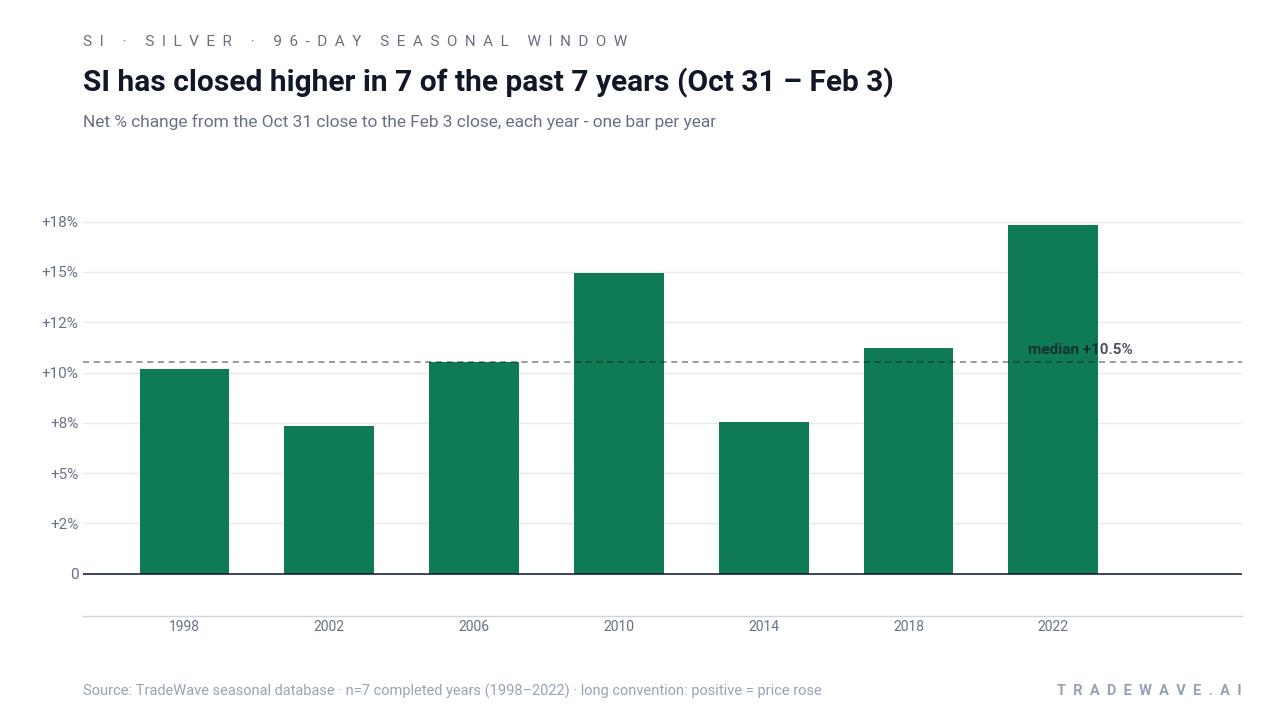
Across the seven completed midterm-year samples from 1998 through 2022, the strongest late-October window came in 2022, when silver gained 17.31% from entry to exit and at one point was up 29.14% inside the window. The softest outcome was 7.33% in 2002, still positive but with a more modest maximum favorable move of 9.88%. Average winners gained 11.29%, and the median outcome of 10.51% shows that the pattern has not been skewed by a single outlier year.
Intraperiod swings have been meaningful. The worst drawdown from entry in any year reached about 12.11% in 2014 before the contract recovered to finish the window up 7.54%. Other years saw much shallower adverse moves, such as only 1.25% in 2022 and 1.43% in 2006, but the range of maximum adverse excursions shows that even a historically strong silver trading window has not been a straight line higher.
A second view shows how each year’s net result sits alongside its full intraperiod range, from worst drawdown to best rally.
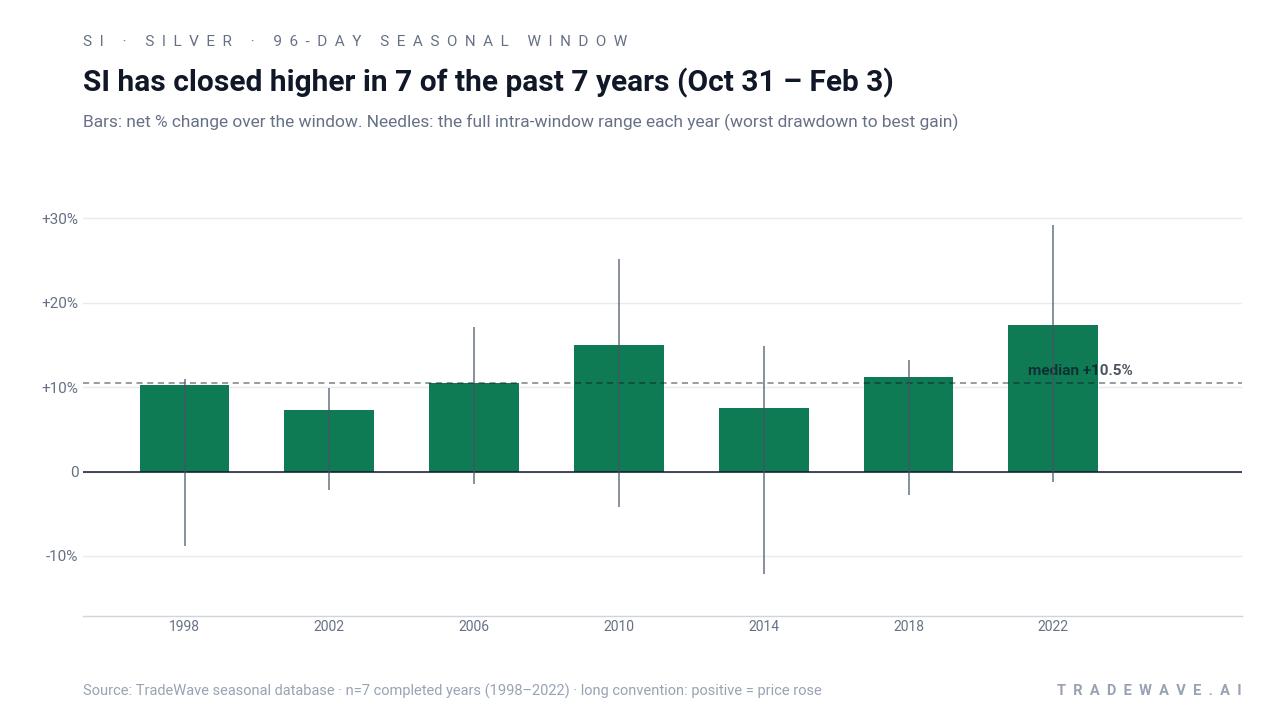
The stacked net, best-case and worst-case moves underline the character of this silver trading window. Upside spikes have often been large, but the full range bars show that traders have had to sit through several percentage points of heat in weaker years before the seasonal tailwind reasserted itself. Add it up and the pattern is simple: seven for seven, double-digit average gains, and a cumulative 110.81% return from holding only this slice of the calendar across the sample.
History does not guarantee future results; adverse excursions can be large even in winning windows, and traders should size positions with the possibility of double-digit drawdowns in mind.
Why does Silver (SI) follow this seasonal pattern?
One likely driver is the way industrial and investment demand for silver tends to bunch around year-end, as manufacturers lock in supply and investors rebalance portfolios ahead of the new year. Analysts have also pointed to fiscal debates and policy uncertainty in midterm election years, which can boost interest in precious metals as hedges against inflation and currency risk.[2] This window may also reflect the overlap of holiday-season electronics and solar demand with shifting expectations for central-bank policy, creating a recurring bid for silver into early February.
What is driving Silver (SI) today?
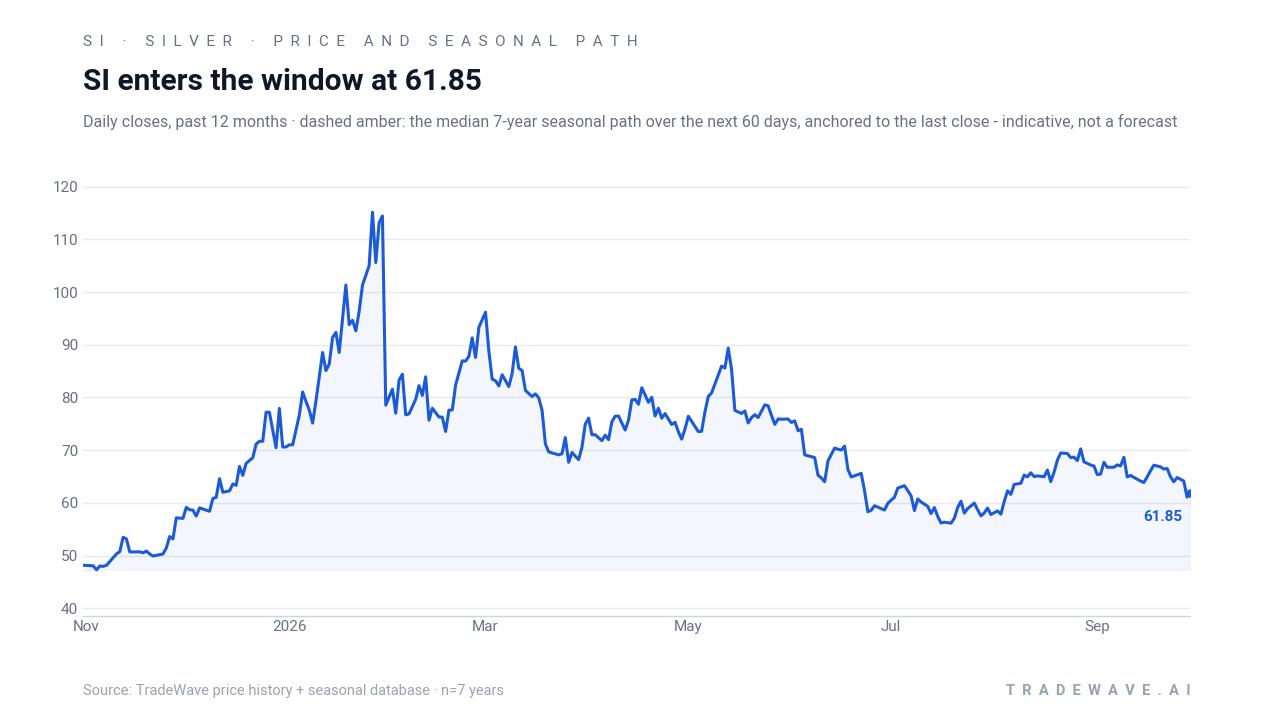
Silver futures settled at about $61.20 in the prior session, up 0.83% on the day, with a trading range between $60.26 and $61.22 on relatively light volume of 2,768 contracts. That leaves the contract roughly 5.6% above its 52-week low near $55 and about 49.8% below the 52-week high around $121.79, while spot and futures markets continue to digest the aftermath of last year’s explosive rally and the more recent consolidation phase.
In Feb 2026, coverage highlighted how a historic surge in silver prices had distorted regional markets, widened price gaps and even encouraged smuggling into high-premium hubs as manufacturers struggled with higher input costs.[2] Earlier commentary from Dec 2025 described how a roughly 33% jump in December had been followed by some easing, as traders took profits after a powerful run and braced for mean reversion risk.[1] Those episodes underline how quickly sentiment around silver can flip from momentum-driven buying to forced de-risking when prices overshoot.
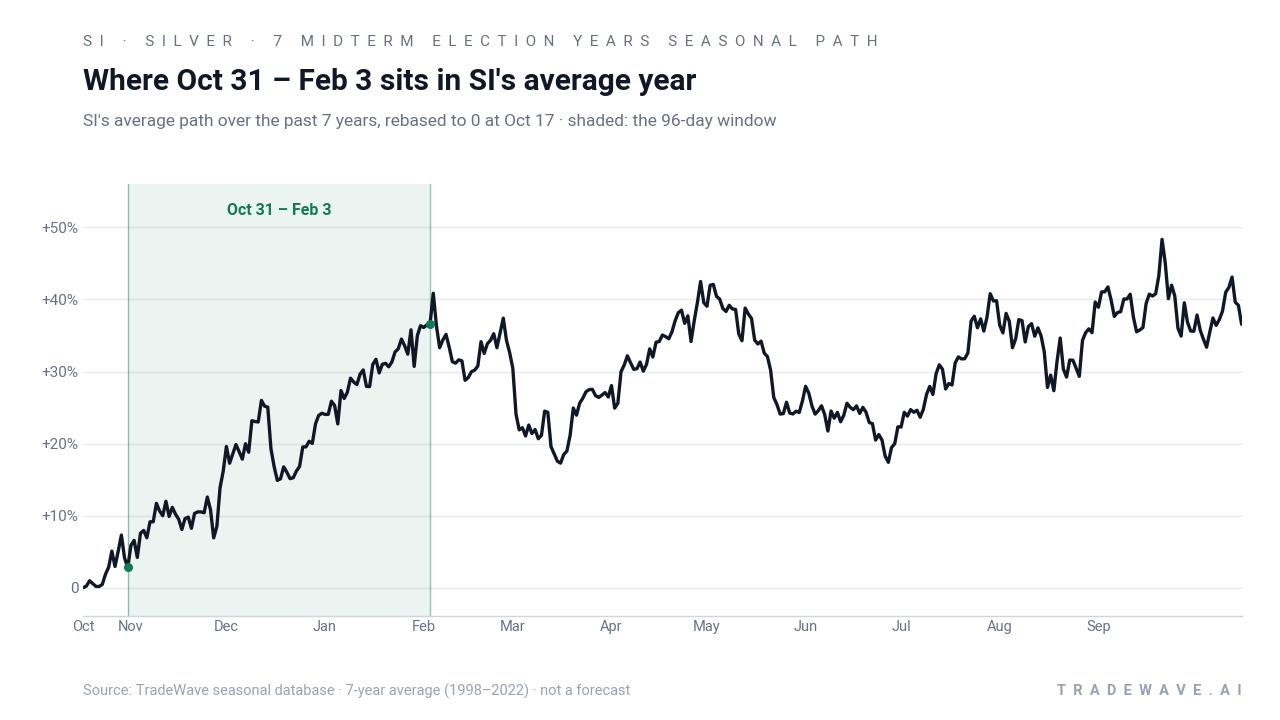
The chart below shows how the latest pullback fits into the past year’s surge and the indicative seasonal path for the weeks ahead.
Sources
About this seasonal analysis
Seasonal pattern data is sourced from TradeWave.ai, which analyzes historical price behavior across annual calendar windows going back up to 30 years. Read the full data methodology or the book The 100-Year Pattern by Afshin Moshrefi (2026 edition). Past performance of seasonal patterns does not guarantee future results. This article is for informational purposes only and does not constitute investment advice.