CBOE Volatility Index (VIX) Has Dropped in 8 of 8 Midterm Winters, Shorts Averaged 24.29%
CBOE Volatility Index is sitting near the low end of its 52-week range as it approaches an Oct 10–Feb 15 window that has historically seen volatility grind lower through the heart of the midterm election year.
Price as of Sep 29, 2026: $16.04 (last close).
What is the seasonal pattern for CBOE Volatility Index (VIX)?
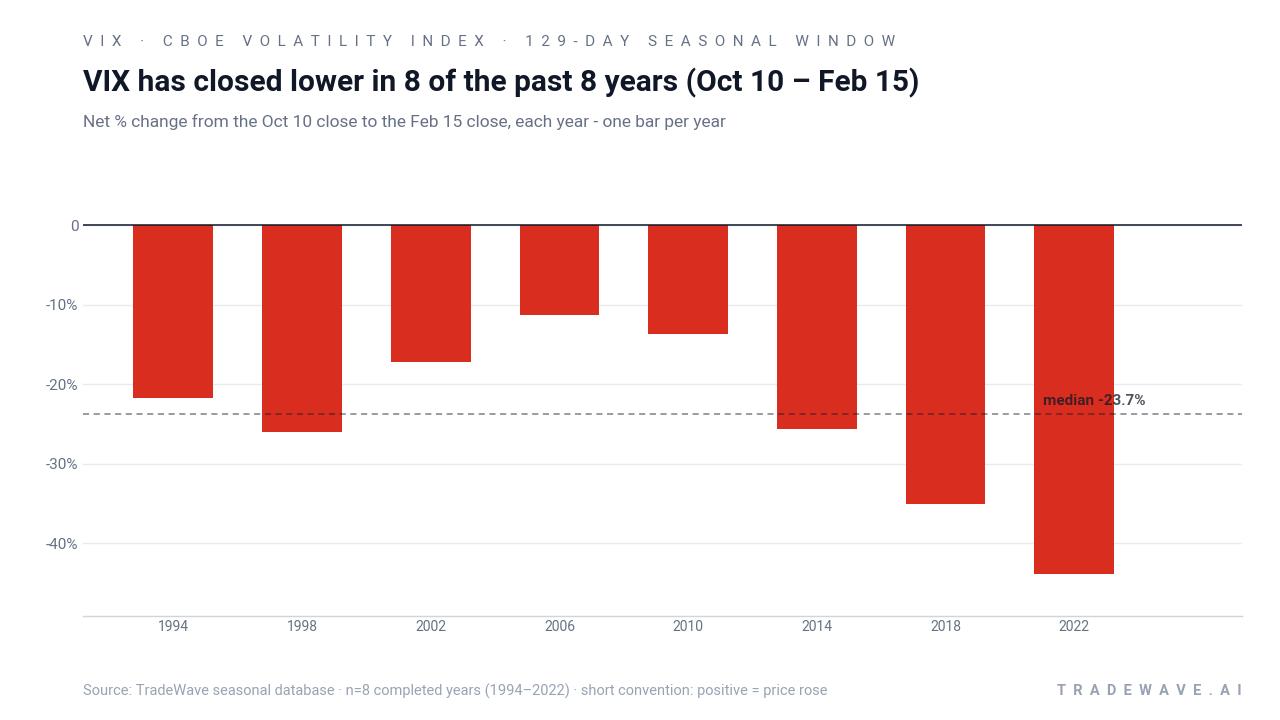
CBOE Volatility Index has fallen in 8 of 8 midterm-year Oct 10–Feb 15 windows, with an average 24.29% gain for short positions in winning years.
- 8 for 8 in this window, with VIX finishing lower every midterm election year from 1994 to 2022 and short trades averaging 24.29% profit.
- Seasonal window runs from Oct 10 through Feb 15, spanning 129 days that have historically favored short volatility exposure.
- Percent Profitable is 100.0%, with 8 winners and 0 losers across the last eight midterm election years in this specific VIX trading window.
- Average profit of 24.29% reflects the mean return across all years, since every historical instance was a winning short-volatility trade.
- The TradeWave Ratio (TWR) of 2.88 signals that price has typically traveled meaningfully in the trade direction within the window, while a Sharpe ratio of 2.09 points to strong risk-adjusted results.
- Individual years have still seen sharp spikes in implied volatility inside the window before fading, so intraperiod drawdowns can be large even when the final outcome is profitable for shorts.
According to historical data from TradeWave.ai, this midterm-year stretch has behaved very differently from an average winter for volatility. The next section walks through how that pattern has played out in prior cycles and what it could mean for the coming months.
How has CBOE Volatility Index (VIX) traded in the Oct 10–Feb 15 midterm window?
CBOE Volatility Index has closed lower in every single Oct 10–Feb 15 window across the last eight midterm election years, with short positions averaging 24.29% gains. As of the prior session’s close VIX sits at 16.04, about 54.6% below its 52-week high of 35.3 and 19.9% above its 52-week low of 13.38, leaving it parked in the lower third of its recent range.[2][3]
Because this pattern is grouped by the presidential election cycle, it only looks at years that match today’s backdrop: the midterm election year, specifically the late part of that year. That matters because policy risk, fiscal debates and campaign headlines tend to cluster in similar parts of the calendar each cycle, shaping how investors use options and volatility hedges around the same months.
This seasonal window begins on Oct 10 and spans 129 days into mid-February. Historically, during this period, CBOE Volatility Index has tended to drift lower as midterm election uncertainty gives way to a more stable policy outlook and investors unwind hedges. The trade direction is short, so falling VIX levels are favorable outcomes in this framework, while any sustained spike in implied volatility would mark a losing year for the pattern.
The win–loss record is unusually clean. Percent Profitable sits at 100.0%, with 8 winners and 0 losers, and the average profit of 24.29% matches the all-years average because there have been no losing short-volatility trades in this sample. Median profit of 23.67% is close to the mean, which suggests the distribution of outcomes has been fairly tight around that mid-20s gain for shorts rather than driven by a single outlier year.
Individual years still show plenty of turbulence inside the window. In 2018, for example, VIX ultimately fell 35.06% between the Oct 10 entry and the Feb 15 exit, but the best intraperiod move against shorts saw the index jump 57.67% from the starting level before rolling over. In 1998, the worst drawdown for shorts reached 49.89% in favor of the trade as volatility collapsed from elevated levels, yet the maximum favorable move was only 3.82% against shorts before that decline took hold.
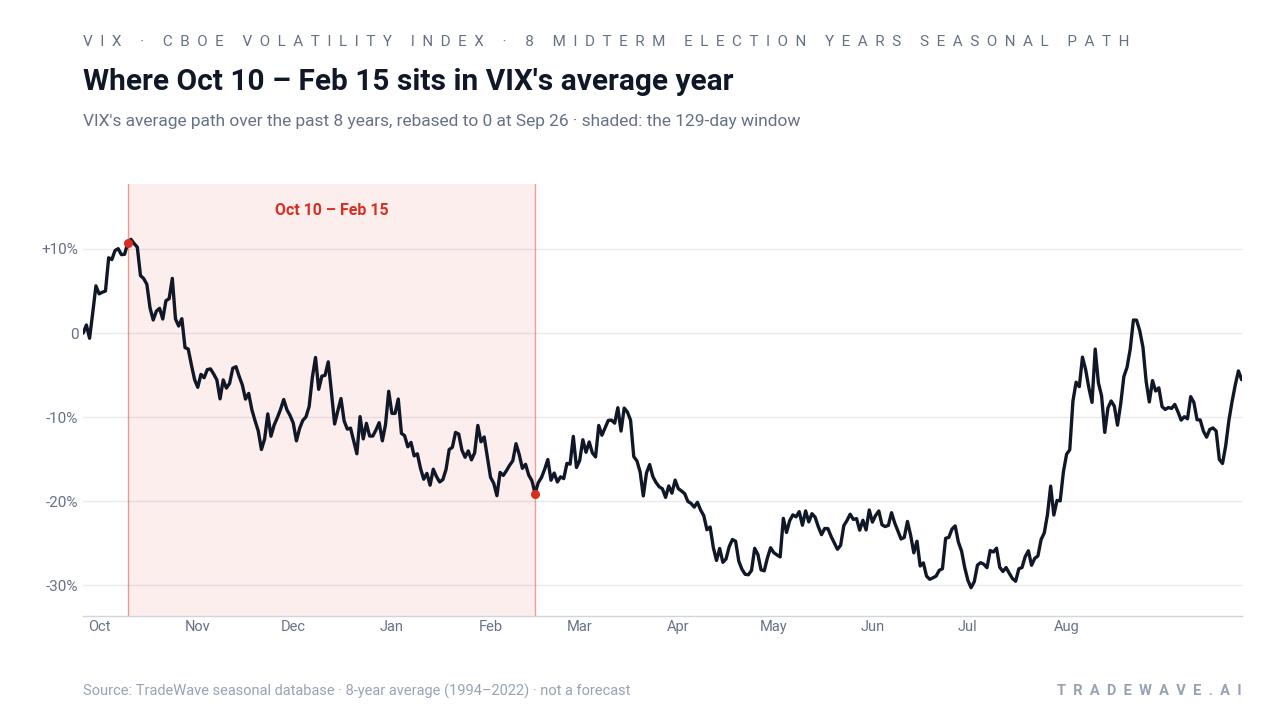
A second view shows how far VIX has tended to swing inside the window before settling at its final level.
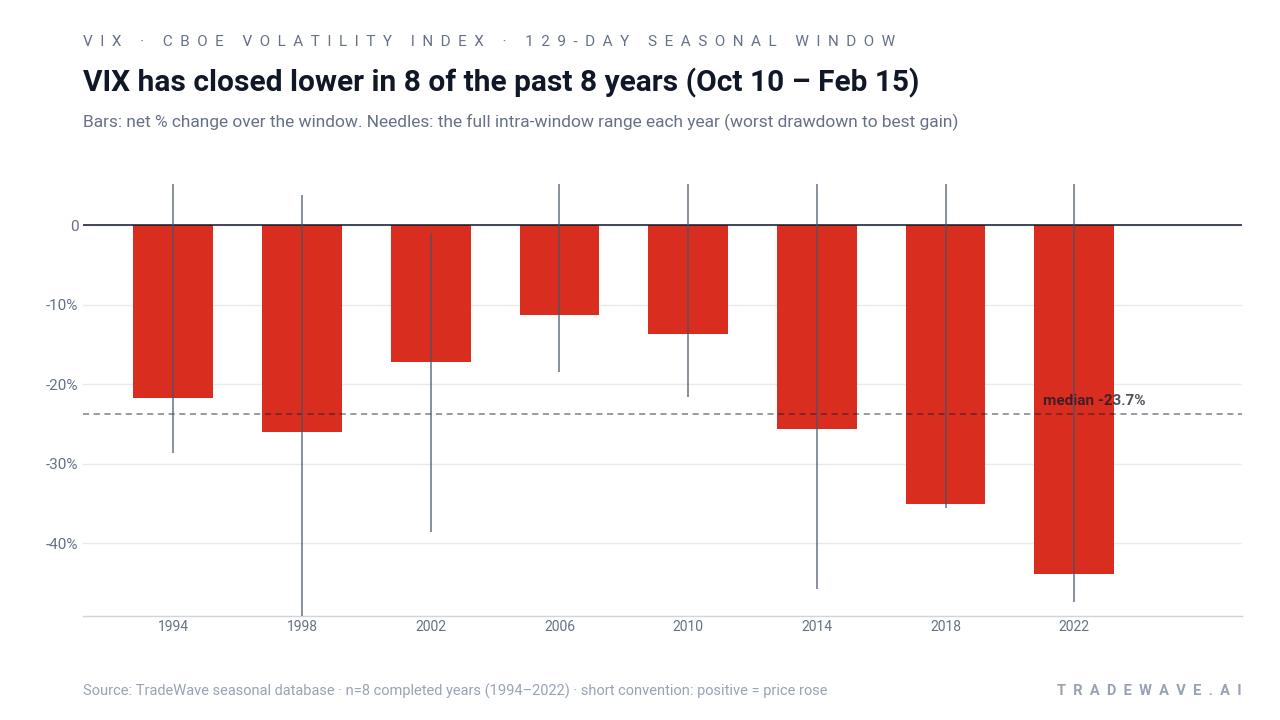
The combined net-return and excursion profile shows a consistent pattern. Bars for all eight years sit below zero, reflecting lower VIX closes that favored shorts, while the needles capture wide ranges between maximum favorable and maximum adverse moves. Large maximum favorable excursions for shorts, paired with occasional sharp maximum adverse spikes, line up with a regime where volatility often flares on headlines but then bleeds lower as equity markets stabilize.
History does not guarantee future results; adverse excursions can be large even in winning windows, and traders using this pattern still face the risk of sharp volatility spikes inside the Oct 10–Feb 15 stretch.
Why does CBOE Volatility Index (VIX) follow this seasonal pattern?
One likely driver is the way the political and policy calendar clusters around midterm elections, with uncertainty peaking into October and then easing once results and fiscal paths are clearer. Analysts have also pointed to institutional portfolio rebalancing and options hedging around year-end, which can reduce demand for protection as realized volatility falls. This pattern may also reflect the tendency for equity markets to firm into the pre-election year, which often coincides with implied volatility grinding lower after midterm shocks.
What is driving CBOE Volatility Index (VIX) today?
CBOE Volatility Index ended the prior session at 16.04, down 0.03 points on the day, leaving it modestly positive year to date at 5.95% but still well below the 52-week peak of 35.3.[2][3] That level is close to the long-run median often cited for VIX, consistent with a market that has cooled from the geopolitical and inflation-driven spikes seen earlier in the cycle while still pricing in some risk around the remaining midterm election calendar.[2]
The chart below situates the latest move in its recent multi-month context alongside a historical seasonal projection.
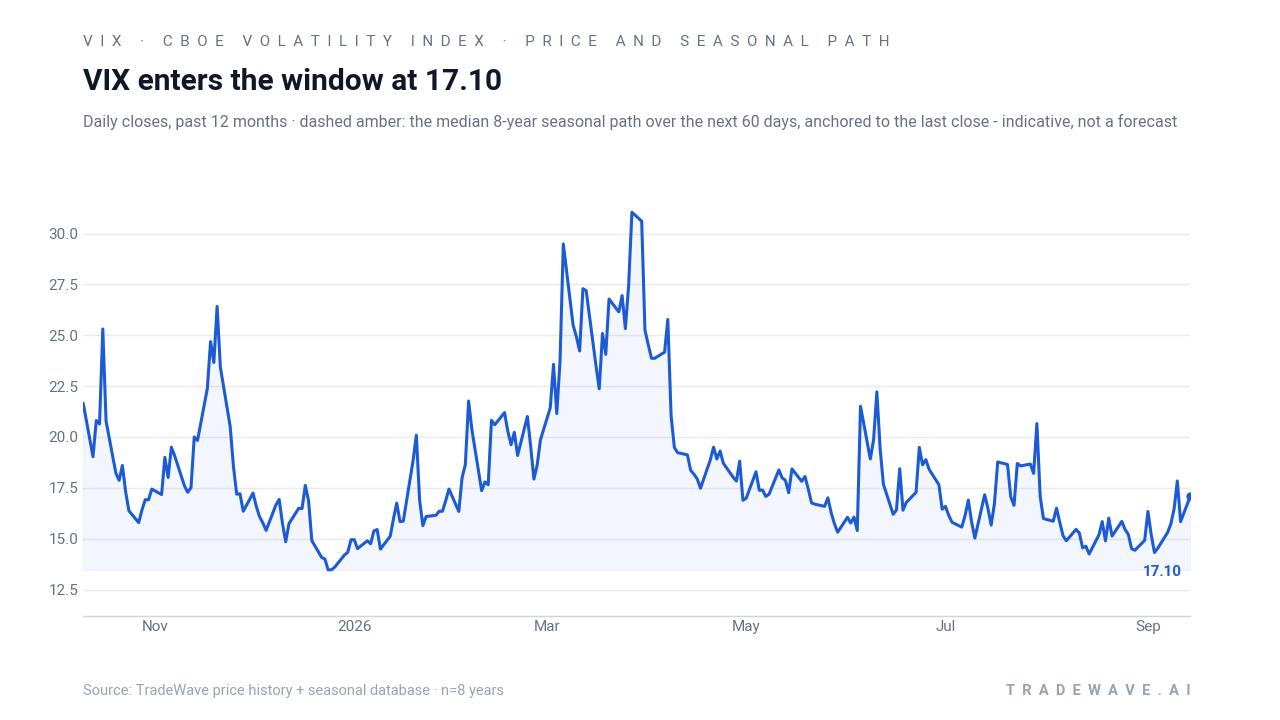
Earlier in the year, VIX spiked to the low 20s on a mix of Middle East tensions and hotter producer inflation, before sliding back as those shocks were partially absorbed.[2] More recently, VIX dipped toward 15 in early September as equity markets steadied ahead of key inflation prints, jobs data, Federal Reserve meetings and the final stretch of the midterm campaign, underscoring how quickly implied volatility can compress when macro data lands in line with expectations.[2] Because VIX tends to fall when equities grind higher and rise when stocks sell off, this calm backdrop has kept the index anchored near the bottom of its one-year range even as traders look ahead to the historically active October period.
Options desks have flagged VIX contracts among the most actively traded in several sessions, reflecting steady demand for hedging and tactical volatility plays even at relatively subdued index levels.[1] The VIX futures curve has been described as very flat, suggesting that the market is not paying a large premium for longer-dated protection and is instead treating current risks as relatively contained in time.[1] Add it up and the setup heading into the Oct 10 seasonal window is one where implied volatility is neither washed out nor panicked, which makes the historical pattern of midterm-year winter softness in VIX particularly notable.
What should traders watch as this VIX seasonal window approaches?
The Oct 10 start date is less than two weeks away, so the focus now shifts to how VIX behaves into and through that 129-day stretch. First, watch whether the index can stay anchored in the mid-teens as key macro releases and the final midterm election headlines hit; a break back toward the 52-week high zone in the 30s would run counter to the historical pattern and signal a very different risk regime.[2] Second, monitor the shape of the VIX futures curve for signs of stress, such as a pronounced inversion or a sudden steepening, which in past cycles has preceded larger volatility spikes even when the seasonal tendency ultimately reasserted itself.[1]
Third, keep an eye on VIX options flow and open interest: if heavy hedging demand continues to build into October and November, that could fuel the kind of intraperiod volatility spikes that have historically shown up as large adverse excursions for short positions before the index fades into February.[1] Finally, the key tell for whether this midterm-year seasonal pattern is repeating will be how VIX trades after any early-quarter shocks; if volatility spikes on a data or policy surprise and then quickly retraces toward the mid-teens, it would rhyme with prior cycles, while a sustained elevation in implied volatility into year-end would mark a clear break from the last eight midterm election years.
Sources
About this seasonal analysis
Seasonal pattern data is sourced from TradeWave.ai, which analyzes historical price behavior across annual calendar windows going back up to 30 years. Read the full data methodology or the book The 100-Year Pattern by Afshin Moshrefi (2026 edition). Past performance of seasonal patterns does not guarantee future results. This article is for informational purposes only and does not constitute investment advice.