Silver (SI) Has Rallied in 7 Straight Midterm Winter Windows, Averaging 12.25% Gains
Silver futures are down sharply for 2026 but sit near short-term highs as an October-to-January window that has never lost in past midterm election years approaches.
Price as of Sep 16, 2026: $65.02 (intraday).
What is the seasonal pattern for Silver (SI)?
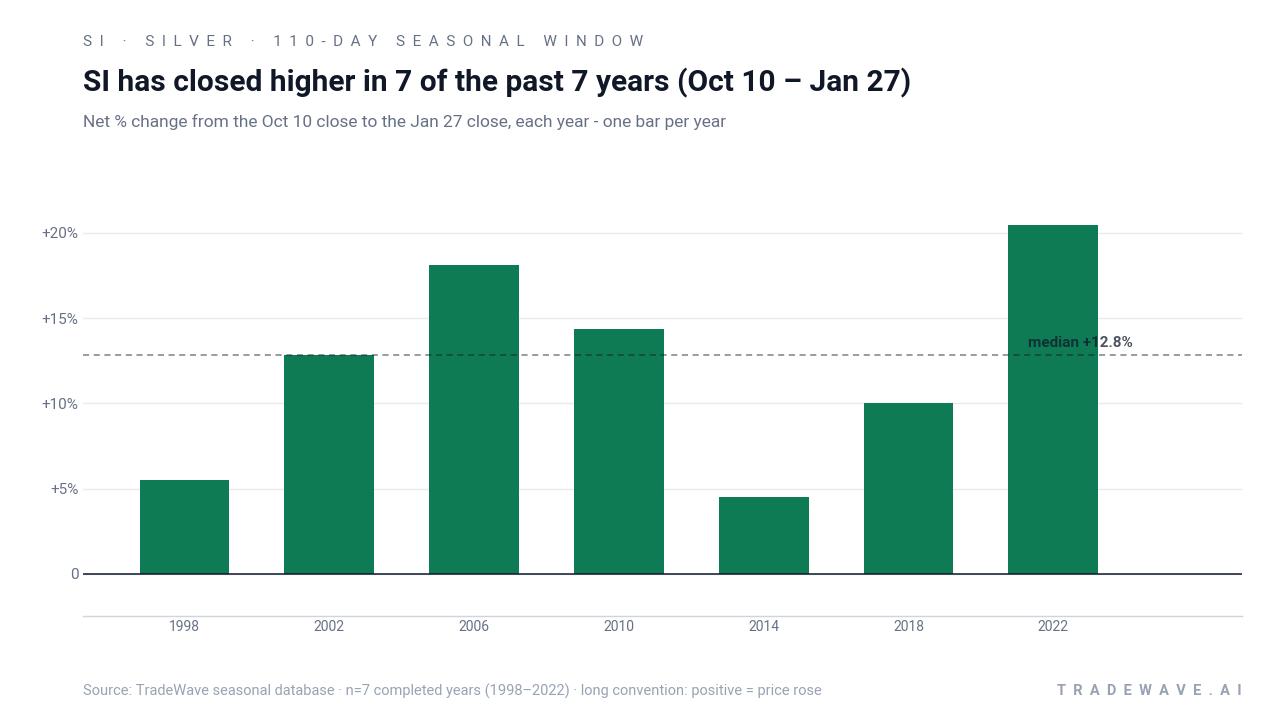
Silver has risen in 7 of 7 midterm election years during the Oct 10 to Jan 27 window, with an average gain of 12.25% in winning years.
- 7 for 7 in this window, averaging 12.25% gains in winning years across the last 7 midterm election cycles.
- Seasonal window runs from Oct 10 to Jan 27 (110 days), aligning with the late midterm election year and the handoff into the pre-election year.
- Percent Profitable is 100%, with 7 winners and 0 losers in the historical sample.
- Avg Profit of 12.25% reflects all years in the window, since every recorded instance finished higher.
- Intraperiod swings have been wide, with some years showing double-digit drawdowns even as the window ultimately closed higher.
- Pattern direction is long, meaning the historical bias has favored upside moves in Silver during this specific stretch.
According to historical data from TradeWave.ai, this late midterm-year window in Silver behaves very differently from an average quarter, with a distinct election-cycle flavor that traders often overlook.
How has Silver (SI) traded in the late midterm-year winter window?
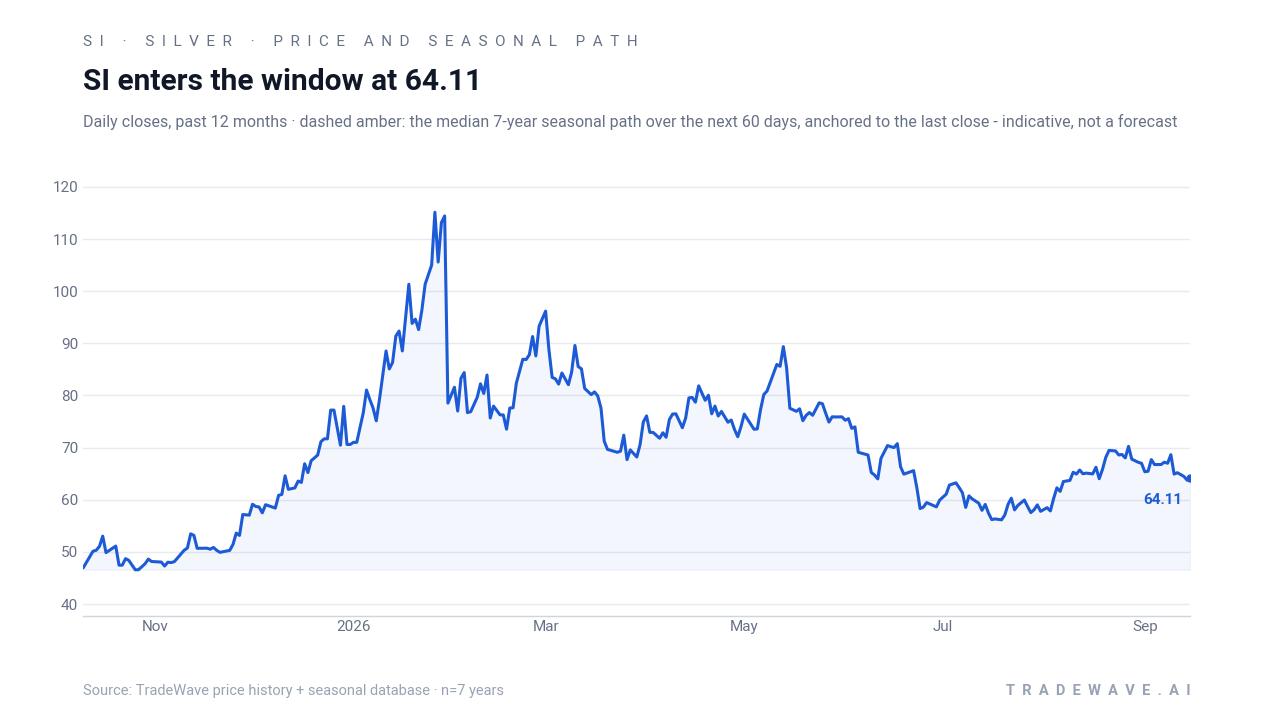
Silver has closed higher in 7 of the last 7 midterm election years during the Oct 10 to Jan 27 window, averaging a 12.25% gain across those runs. The next iteration of that 110-day stretch begins on Oct 10, just as Silver trades around $65 per ounce and sits roughly 46.6% below its 52-week high near $121.79, with 2026 performance still down 10.19% year to date.[2]
Grouping the data by the presidential election cycle matters here because this window always lands in the same policy phase: the final quarter of a midterm election year and the first month of the pre-election year. That is typically when fiscal and regulatory signals for the back half of the administration become clearer, and risk appetite in metals often shifts alongside expectations for growth, inflation and industrial demand.
Across the seven midterm-year samples from 1998 through 2022, the pattern direction is firmly long. Percent Profitable is 100%, with 7 winners and 0 losers, and the average gain across all years is 12.25%. The median outcome is close, at 12.84%, which suggests the distribution has been skewed toward solid double-digit advances rather than a few outliers carrying the series.
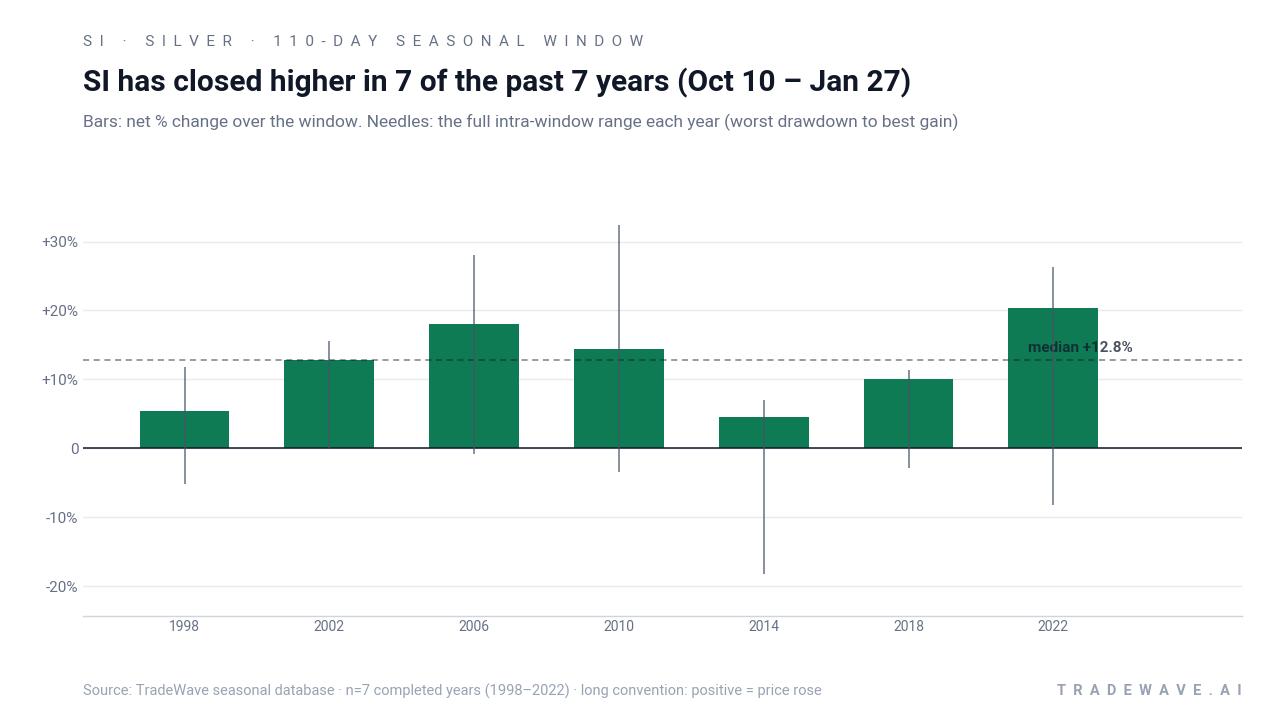
Individual years show how that plays out. In 2006, Silver gained 18.09% over the window, with a best intraperiod run-up of 28.07% from the entry price and only a modest 0.8% worst drawdown. In 2022, the contract finished the window up 20.43%, but the path was bumpier, with a peak favorable move of 26.31% and a worst intraperiod decline of 8.18% from the starting level. At the softer end of the spectrum, 2014 still closed the window higher by 4.51%, yet traders had to sit through a maximum adverse move of 18.19% before the recovery.
The MFE and MAE profile shows why this Silver trading window has been both rewarding and nerve-racking. Maximum favorable excursions have repeatedly pushed into the mid-20% to low-30% range in strong years, while maximum adverse excursions have ranged from almost flat to high-teens drawdowns. In plain English, the historical pattern has offered sizable upside for longs, but the path has often involved sharp pullbacks inside the window before the final gains locked in.
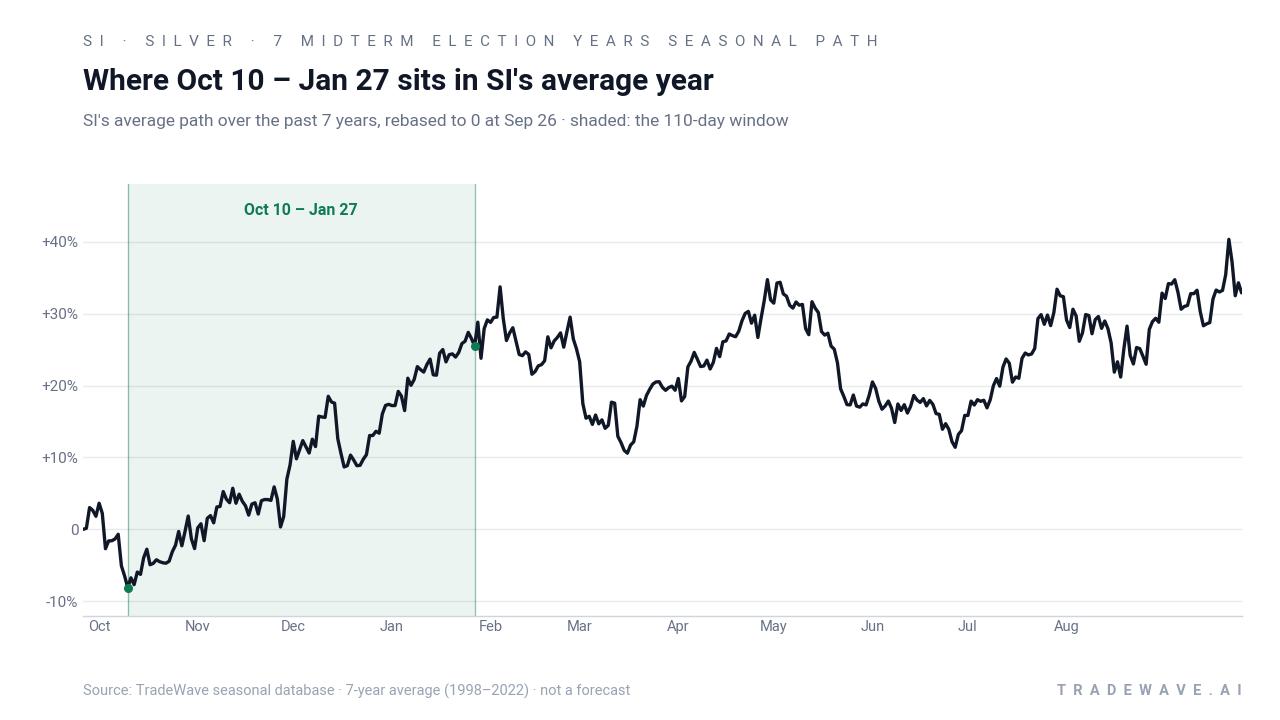
Trend-wise, the historical seasonal average suggests that much of the upside has tended to build after the window gets going rather than in a single burst at the start. The average path over the 110 days slopes higher, with some choppiness early on and stronger follow-through into the heart of winter. That fits with a narrative where positioning, macro data and policy signals accumulate over the quarter rather than delivering all their impact in October.
A second view of each year’s best and worst intraperiod swings highlights how much room Silver has historically had to run and to whipsaw inside this window.
History does not guarantee future results; adverse excursions can be large even in winning windows, and traders can experience significant drawdowns before any seasonal tailwind asserts itself.
Why does Silver (SI) follow this seasonal pattern?
One likely driver is commodity supply and demand seasonality, as the Oct-to-Jan stretch captures year-end industrial orders, electronics production and jewelry demand that can tighten physical markets. Analysts have also pointed to portfolio rebalancing and macro positioning around the midterm election year, when investors reassess inflation and policy risk heading into the pre-election year. This pattern may reflect that combination of real-economy demand and shifting expectations for growth, rates and fiscal support that tends to favor precious and industrial metals in this phase of the cycle.
What is driving Silver (SI) today?
Silver’s continuous futures contract last traded near $65.02 per ounce, up about 1.4% on the prior session’s close, even as the metal remains down 10.19% for 2026 and well below its 52-week peak around $121.79.[2] The front-month term structure is relatively flat around $63 to $64 across the next several contracts, suggesting the market is not yet pricing a dramatic near-term squeeze or collapse but is instead digesting earlier gains and volatility.[2]
In the basic materials sector, Silver-linked equities remain a focal point after a powerful rally over the past year, with names such as Endeavour Silver still highlighted among top industry performers.[1] That equity strength reflects how the metal has become a proxy for both industrial demand and speculative interest, especially after the sharp price rise that took Silver into the low $60s per ounce by late 2025.[4] In Jan 2026, analysts flagged that combination of tightening export controls in China and meme-style retail buying as a recipe for elevated volatility, warning that pullbacks could be abrupt even if the longer-term bull case stayed intact.[3]
Silver is currently trading in a firm but choppy range and remains an important reference point for inflation expectations, industrial margins and risk appetite in basic materials. Even so, the seasonal window that opens on Oct 10 has historically delivered some of the sharpest upside runs of the midterm election year, with intraperiod swings that can test conviction on both sides of the trade. Because Silver influences mining equities and broader commodity sentiment, volatility in this period has often spilled into related stocks and ETFs, especially when macro headlines collide with thin holiday liquidity.
The chart below situates the latest move in its recent multi-month context alongside the historical 60-day seasonal projection.
What should traders watch as the Oct 10 window approaches?
First, the calendar. The Oct 10 start date lands as the market wraps up the midterm election year and edges into the pre-election year, a phase that has historically been friendlier to risk assets and cyclical commodities. Any shift in expectations around fiscal policy, infrastructure spending or industrial activity could either reinforce or blunt the usual Silver seasonal trend in this stretch.
Second, price levels. Traders will be watching whether Silver can hold the low-to-mid $60s into early October or whether another pullback resets positioning before the window opens. Historically, the strongest years in this pattern have seen the contract enter the window from a base rather than from a vertical spike, which has given more room for the 12% to 20% type gains that past cycles delivered.
Third, volatility and intraperiod swings. The historical MAE and MFE profile shows that even in winning years, Silver has often suffered mid-window drawdowns in the high single digits to high teens before recovering. If this year’s window starts with a sharp selloff that stays within that historical range, it would still be consistent with the pattern. A deeper or more persistent break would be an early sign that this cycle is diverging from the script.
Finally, cross-asset signals. Flows into Silver miners, basic materials ETFs and related industrial metals will offer clues about whether investors are leaning into the traditional midterm-to-pre-election seasonal tailwind or fading it.[1] If policy headlines, China export developments or retail trading bursts echo the dynamics seen in early 2026, the combination of structural seasonality and event-driven flows could make this one of the more volatile Silver trading windows of the cycle.[3]
Sources
About this seasonal analysis
Seasonal pattern data is sourced from TradeWave.ai, which analyzes historical price behavior across annual calendar windows going back up to 30 years. Read the full data methodology or the book The 100-Year Pattern by Afshin Moshrefi (2026 edition). Past performance of seasonal patterns does not guarantee future results. This article is for informational purposes only and does not constitute investment advice.