All Six Times Since 2002, Adobe Inc. (ADBE) Has Dropped in This 45-Day Midterm Spring Window
Adobe Inc. is heading into a 45-day midterm-year stretch that has rewarded shorts every time in the past, just as the stock trades near 52-week lows after a steep slide.

Key takeaways
- Adobe Inc. has moved lower in all 6 midterm-year spring windows since 2002, aligning with a short trade direction.
- The upcoming 45-day window begins on Mar 20, 2026 and is grouped across the last 6 midterm election years.
- Percent Profitable is 100% with 6 winners and 0 losers, delivering an average profit of 5.43% for the short setup.
- The TradeWave Ratio of 2.28 signals that price has typically traveled meaningfully in the trade direction within the window.
- Intraperiod swings have been sharp, with maximum favorable moves above 9% in some years and adverse drawdowns deeper than 13% in others.
- Today’s price near the 52-week low means this historically weak midterm window will open with Adobe already under pressure.
According to historical data from TradeWave.ai, this specific midterm-year stretch has behaved very differently from an average month on the calendar for Adobe. The next section walks through how that pattern has played out in prior cycles and what it means as the 2026 window approaches.
Seasonal window
Adobe Inc. has produced short-side gains in all 6 midterm election years during this 45-day spring window, averaging 5.43% profits for the pattern. The next iteration begins on Mar 20, 2026, with the stock last trading at 249.32, about 1.6% above its 52-week low of 244.28 and far below the 422.95 high. That combination of a clean historical short record and a price already near the bottom of the recent range sets up an unusually tight clash between seasonality and current positioning.
The presidential election cycle matters here because this pattern only looks at the last 6 midterm election years, a phase that has often featured policy uncertainty, shifting regulation and more cautious corporate spending. Grouping by that phase filters out noise from election years and pre-election booms and focuses on how Adobe has behaved when Washington is in the middle of the cycle and investors are digesting earlier policy moves rather than anticipating new ones.
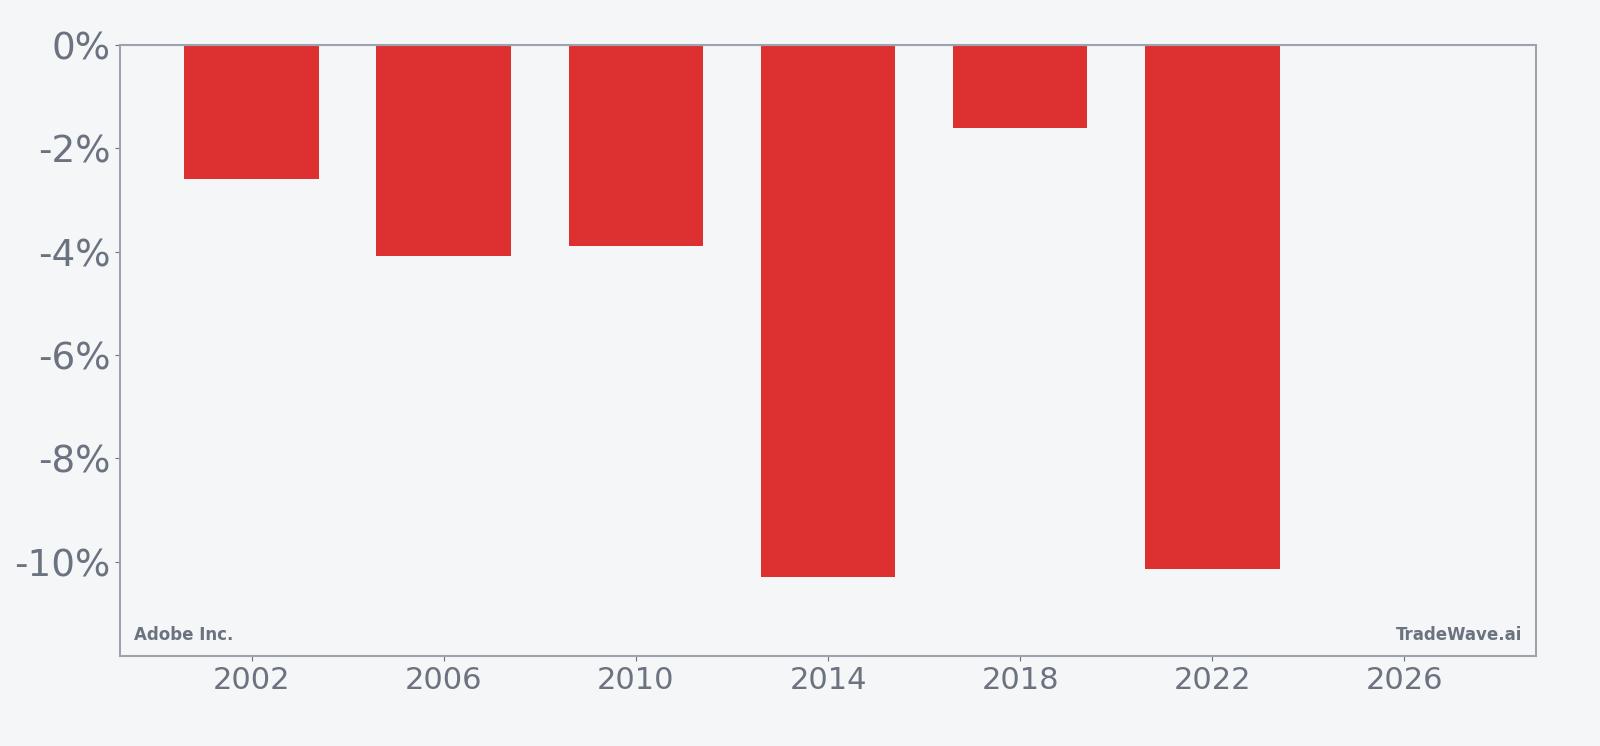
This seasonal window begins on Mar 20 and spans 45 trading days. Historically, during this period in midterm years, Adobe has tended to drift lower in a way that has favored short exposure rather than long. Across the six midterm samples since 2002, every single one finished with a negative net return for the stock, which translates into a 100% hit rate for the short pattern and an average profit of 5.43%.
The per-year breakdown shows how that has played out. In 2002, Adobe fell 2.59% from entry to exit during the window, while 2006 and 2010 saw declines of 4.08% and 3.89% respectively. The two most punishing years for longs were 2014 and 2022, when the stock dropped 10.29% and 10.14% over the same 45-day stretch, both aligning with the short trade direction. Even the softest outcome, in 2018, still delivered a 1.61% decline for the stock over the window.
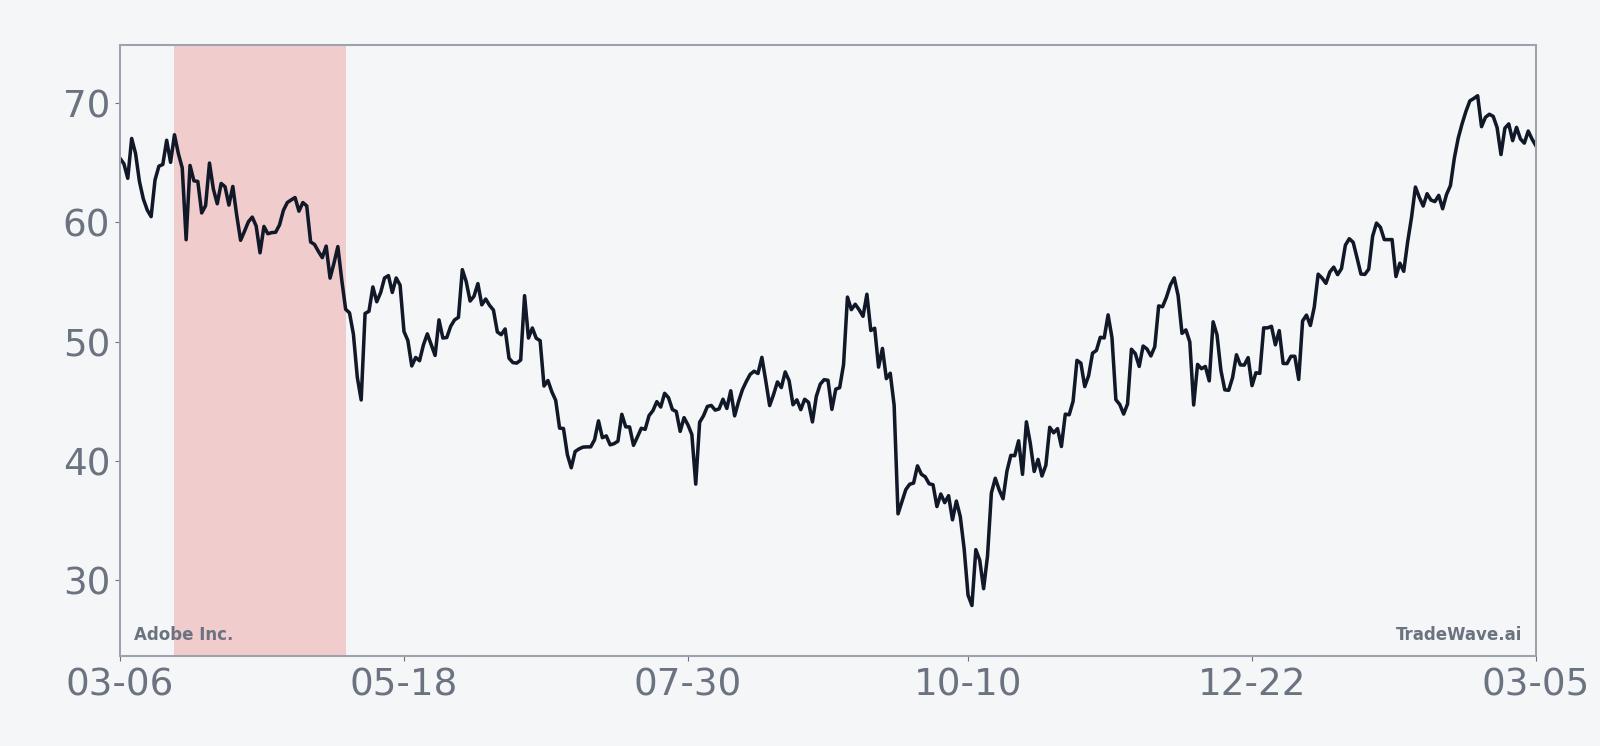
The historical seasonal average trend line slopes steadily lower across the window rather than showing a single crash point. In prior midterm years, Adobe has often started to weaken early in the period, with losses building gradually rather than all at once. That profile suggests a tendency toward persistent pressure rather than a one-day shock, even though individual years have still seen sharp swings inside the window.
The combined net, best-case and worst-case moves by year highlight how much room Adobe has historically had to run in both directions during this stretch.
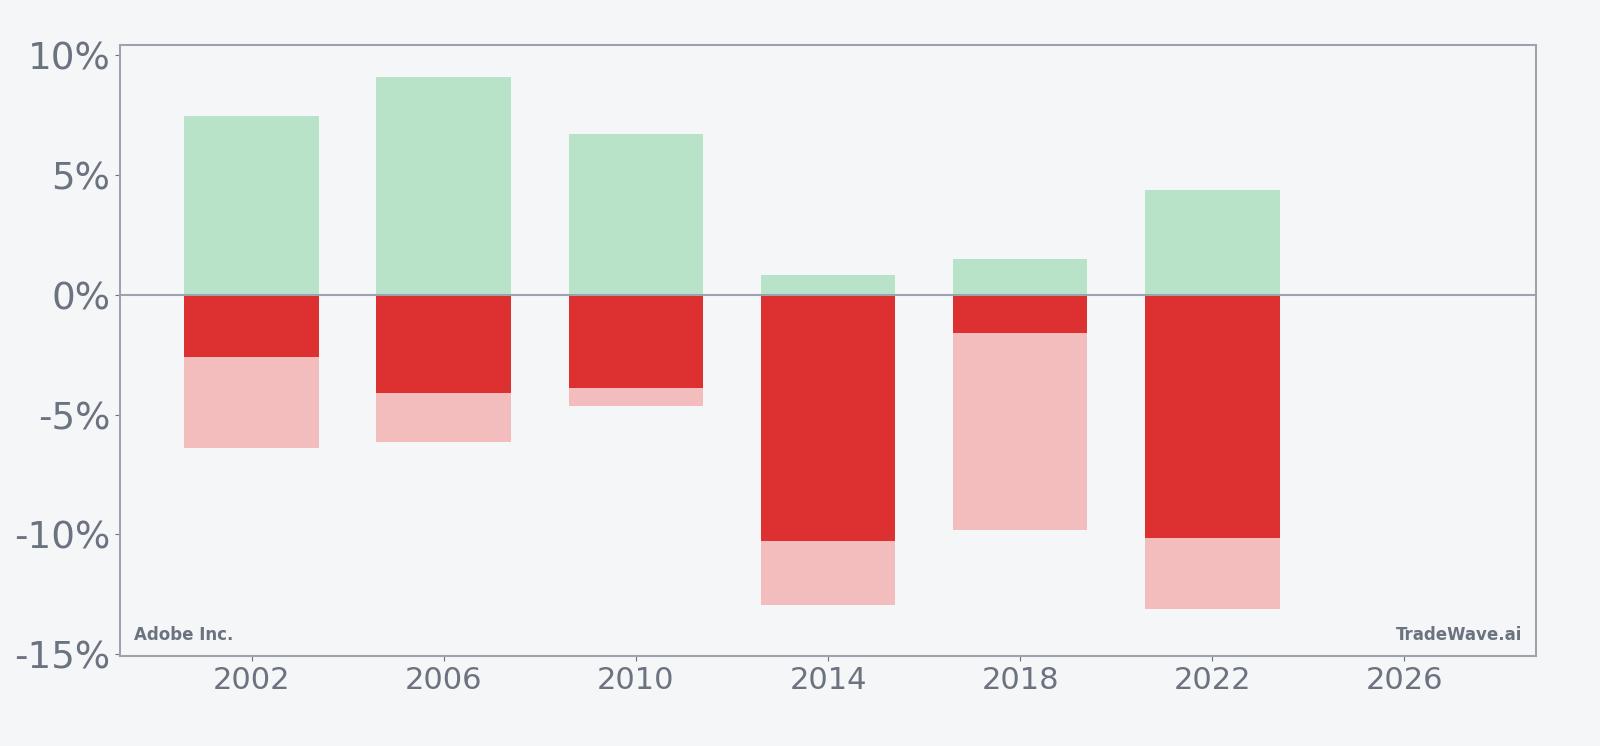
The maximum favorable move, or best intraperiod run in the trade direction, has reached as high as 9.08% in 2006 and 7.46% in 2002, showing that when the short pattern works, it can work quickly. At the same time, the maximum adverse move, or worst drawdown against the short, has been as deep as 13.13% in 2022 and 12.95% in 2014, meaning shorts have had to sit through sizable rallies before the window closed in their favor. Add it up: six for six winning short windows, but with enough two-way volatility that timing and risk controls have mattered as much as direction.
History does not guarantee future results, and even in a perfect six-for-six record, adverse excursions within the window have been large enough to challenge poorly managed positions.
Price and near-term drivers
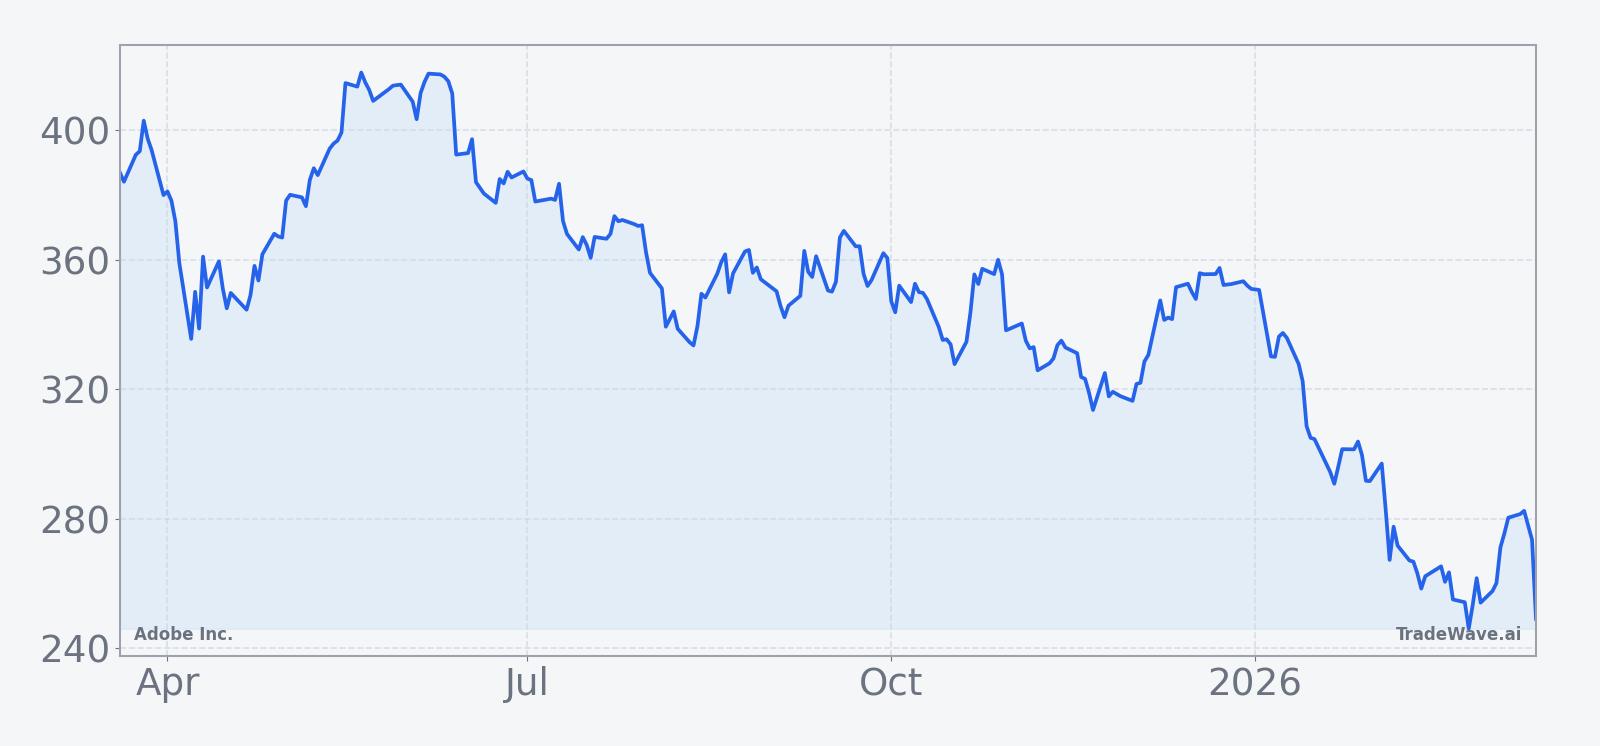
Adobe shares closed at 249.32 on Mar 15, down 7.58% on the day and roughly 41.1% below the 52-week high of 422.95, with volume of 17.3 million shares running well above the 20-day average of about 6.0 million. The stock has also slipped below its 50-day moving average of 286.35, underscoring how quickly sentiment has swung from optimism around AI and subscription growth to concern about valuation and competition.
In Jan 2026, Adobe reported a $94 million revenue beat and projected fiscal first-quarter revenue between $6.25 billion and $6.3 billion, topping prior projections and reinforcing its message that AI tools such as Firefly are driving demand across the Creative Cloud and Experience Cloud franchises.[1] In Dec 2025, the company had already raised its annual revenue and profit forecasts on strong design software demand, pointing to double-digit growth and expanding cash generation.[5] That backdrop of solid fundamentals and AI adoption sits awkwardly next to the current price slide, which looks more like a reset in expectations than a collapse in the business model.
Competition is part of the story. In Oct 2025, analysis of Adobe’s fundamentals highlighted rising pressure from lower-cost and AI-native rivals, even as the company maintained 10.7% revenue growth and a reputation as a cash engine.[4] In Dec 2025, coverage of Adobe’s upbeat AI and design software results noted that Firefly’s monthly active users had climbed 35% year over year, helping push AI-influenced annual recurring revenue above $8 billion.[7] Those numbers show why many investors still view Adobe as a core AI and design platform, but they also explain why any hint of slowing growth or margin compression can trigger outsized moves in the stock.
The chart below situates the latest move in its recent multi-month context.
Election-cycle and macro backdrop
The 2026 calendar year is the midterm election year in the current presidential cycle, a phase that often brings more noise around regulation, antitrust and tech policy than concrete new laws. For a company like Adobe, which sits at the intersection of creative software, data and AI, that environment can translate into shifting narratives about how aggressively regulators might police pricing power, data usage or AI-generated content, even if the actual rulebook changes slowly.
Macro-wise, Adobe’s story is still anchored in AI adoption and digital transformation. In Jan 2026, coverage of its results emphasized that AI credit consumption had tripled quarter over quarter and that AI-influenced annual recurring revenue had climbed above $8 billion, underscoring how deeply generative tools are being woven into its product stack.[1] At the same time, sector commentary in late 2025 flagged intensifying software competition, with new AI-powered tools and cheaper alternatives forcing incumbents to innovate faster while defending margins.[4] That mix of strong demand and rising rivalry is exactly the kind of backdrop where seasonal patterns can matter, because positioning can swing quickly as investors toggle between growth excitement and valuation fatigue.
What to watch as the window opens
The 45-day midterm-year window for Adobe starts on Mar 20 and runs into late May, overlapping a period when investors will be parsing any updates on AI monetization, subscription churn and enterprise budgets. The first key watchpoint is price behavior around the 244 to 250 zone that has defined the recent low; a decisive break and follow-through lower would be consistent with the historical short-friendly pattern, while a firm bounce that holds above the 50-day moving average would contradict it.
Second, traders will be watching how volatility behaves inside the window relative to past cycles. Historically, maximum favorable moves for the short have reached mid-single to high-single digits, while maximum adverse moves have occasionally stretched into low double digits. If this year’s window features similar two-way swings, intraday ranges and gap moves around headlines on AI, competition or macro data will matter as much as the closing trend.
Finally, the broader policy and election calendar will shape how much of Adobe’s move is stock-specific versus sector-wide. Any midterm-year rhetoric on tech regulation, AI governance or digital content rules could amplify existing concerns about competition and pricing power, especially if it lands while the seasonal window is open. If Adobe weakens in tandem with other large software names during that stretch, it would fit the historical pattern of midterm-year choppiness. If instead the stock stabilizes or rallies while peers wobble, it would be a clear break from the six-for-six record that has defined this window so far.
Sources
- Yahoo Finance: Adobe (ADBE) Reaffirms AI Leadership With Strong Revenue and Cash Flow, Piper Sandler Reaffirms Outperform Rating (Jan 2, 2026)
- Reuters: Adobe raises annual revenue and profit forecasts on strong design software demand (Sep 11, 2025)
- Reuters: Adobe sees upbeat annual results on AI, design software strength (Dec 10, 2025)
- Forbes: Why Adobe Stock Is A Cash Engine? (Oct 2, 2025)