Retail Rush Into S&P 500 Energy Sector SPDR (XLE) Meets Historically Strong April Window
S&P 500 Energy Sector SPDR is heading into a historically bullish 15-day midterm-year window just as options traders and retail buyers crowd into the ETF around fresh geopolitical energy shocks.

What is the seasonal pattern for S&P 500 Energy Sector SPDR (XLE)?
S&P 500 Energy Sector SPDR has risen in 5 of 6 midterm-year spring windows starting Apr 5, with an average gain of 5.28% in winning years.
- 5 wins, 1 loss in this 15-day midterm-year window, with winning years averaging 5.28% gains.
- The upcoming window runs from Apr 5 for 15 trading days and has been a bullish XLE seasonal trend in past midterm election years.
- Percent Profitable is 83%, with 5 winners and 1 loser across the last 6 midterm election-year samples.
- Average profit across all years, including the lone losing year, is still a solid 4%, pointing to a positive historical seasonality bias.
- Maximum favorable moves inside the window have reached more than 8% in strong years, while adverse swings have approached 3% drawdowns, underscoring two-way volatility.
- Trade Direction is long, with a TradeWave Ratio of 2.07 and a Sharpe ratio of 1.54, indicating historically attractive risk-adjusted returns for this specific S&P 500 Energy Sector SPDR trading window.
According to historical data from TradeWave.ai, this midterm-year slice of April has behaved very differently from an average month for XLE, and the next iteration of that pattern is just days away.
How has S&P 500 Energy Sector SPDR (XLE) traded in this April midterm window?
S&P 500 Energy Sector SPDR has risen in 5 of the last 6 midterm election years during this 15-day April window, with winning years averaging 5.28% gains. The next window begins on Apr 5 and runs through late April, with XLE recently changing hands around 89 and up roughly 11.87% over the past month, a strong run into a historically favorable stretch. Options traders have already been using XLE contracts to position for upside in the energy sector, a sign that some investors are leaning into this strength rather than fading it.[3]
Grouping the data by the presidential election cycle matters here because this pattern only looks at the last six midterm election years, not every calendar year. Midterm years often feature shifting policy expectations, regulatory noise and bouts of volatility in cyclicals like energy, so isolating this phase helps separate election-cycle behavior from the usual spring trading rhythm.
Historically this has been a long-biased setup. With Trade Direction marked as long, positive returns and strong rallies have been the favorable years for the pattern, while the single losing year in the sample represents an unfavorable outcome for that long stance. Even so, the all-years average of 4% shows that the one down year has not erased the gains from the winners.
The per-year table shows how that plays out in practice. The weakest outcome came in 2010, when XLE slipped 0.34% over the window, with a modest maximum favorable move of 1.61% and a maximum adverse move of 2.2% from the entry. At the other end of the spectrum, 2018 delivered a 7.38% net gain with a maximum favorable excursion of 8.21% and a 3.11% worst drawdown, illustrating how strong years have combined sizable rallies with real intraperiod downside.
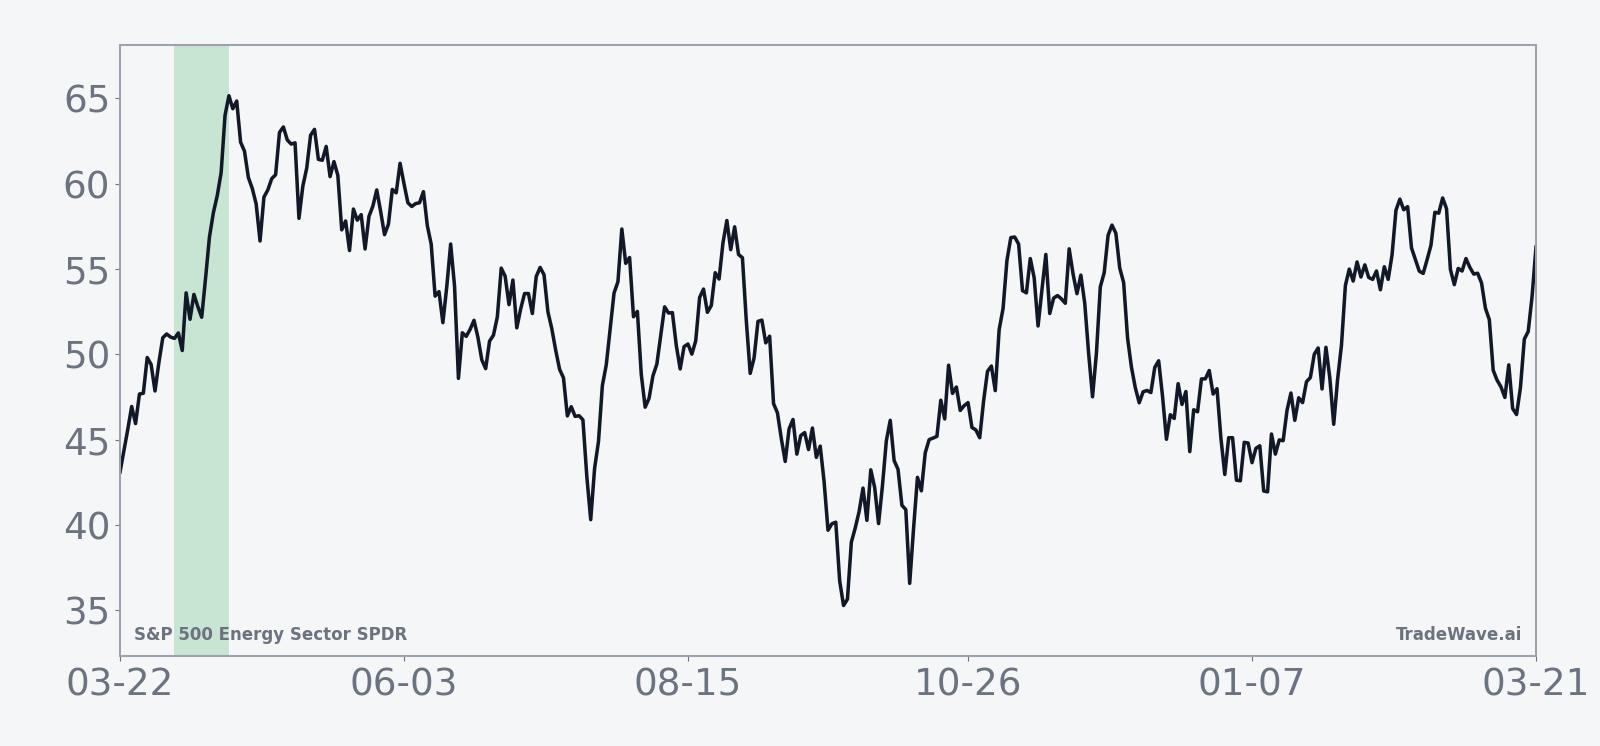
The historical seasonal average trend line slopes higher through most of the 15-day span, with gains tending to build rather than spike on a single day. The typical path shows early strength that continues into the back half of the window, which fits a narrative of steady accumulation rather than a one-off headline pop.
A second view that stacks net returns with best and worst intraperiod swings highlights how much room XLE has historically had to run, and how deep the air pockets can be along the way.
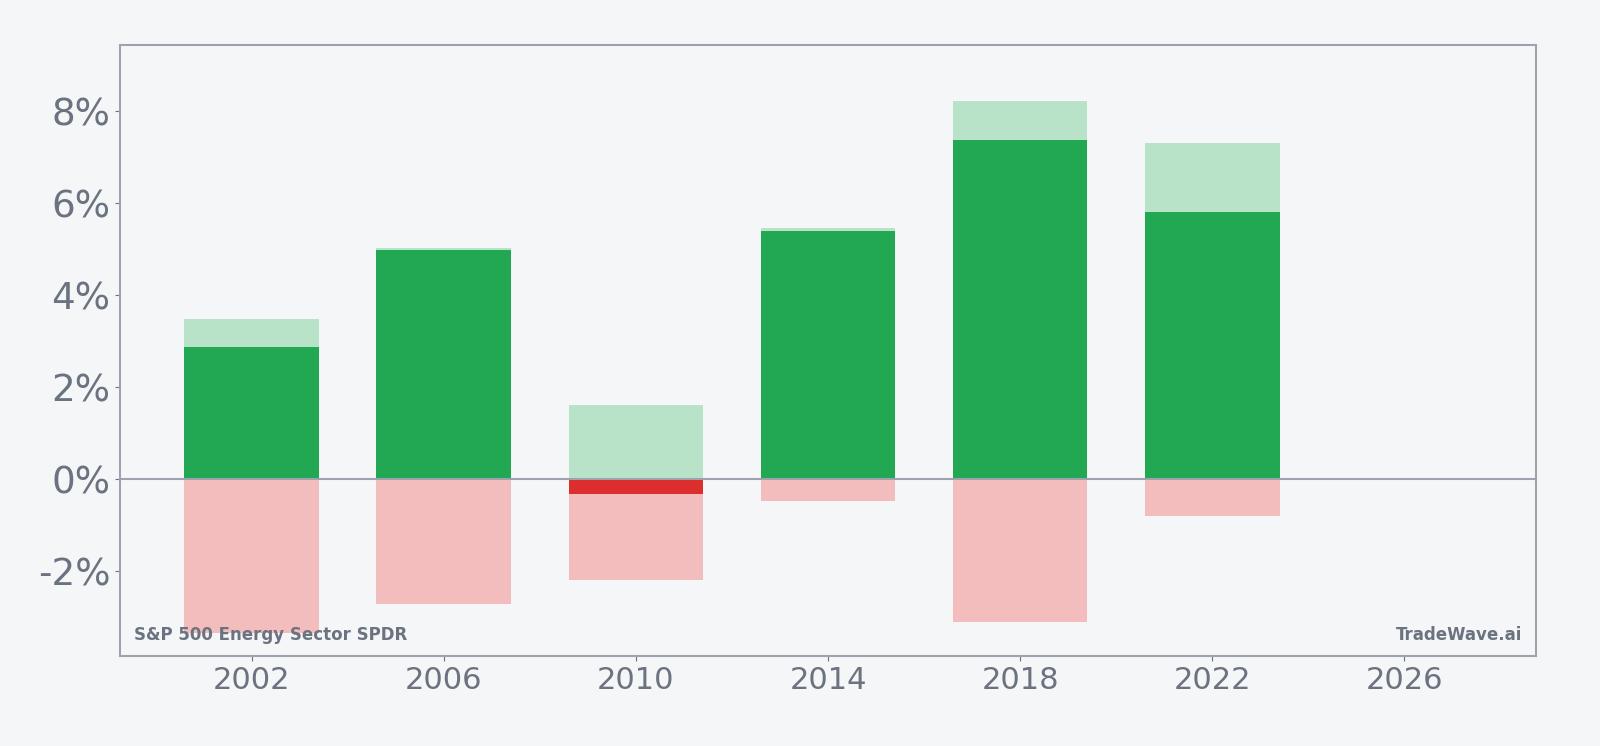
The bars with maximum favorable and adverse excursions show that in most years XLE has pushed several percentage points in the trade direction while also enduring 2% to 3% pullbacks inside the same window. Large MFE combined with contained but noticeable MAE suggests a historically favorable upside profile for longs, but with enough intraperiod volatility that timing and risk controls have mattered.
History does not guarantee future results, and adverse excursions can still be large even in winning windows.
Why does S&P 500 Energy Sector SPDR (XLE) follow this seasonal pattern?
One likely driver is the way energy companies and investors reposition around spring macro updates, including OPEC meetings, refinery maintenance schedules and early-summer demand forecasts. Analysts have also pointed to sector rotation tied to the midterm election year, when policy debates on drilling, regulation and defense spending can push flows toward or away from energy. This pattern may reflect that combination of commodity supply and demand seasonality layered on top of election-cycle portfolio adjustments.
What is driving S&P 500 Energy Sector SPDR (XLE) today?
XLE is trading near 89 after a sharp 11.87% gain over the past month, a move fueled by geopolitical tension and a rush into energy exposure. U.S. oil executives warned in mid-March that the war involving Iran could deepen an already fragile energy backdrop, raising the risk of supply disruptions that tend to support oil-linked equities and ETFs like XLE.[1] Retail investors have responded aggressively, with net buying of more than $14 million of XLE shares in the first hour of trading on a recent session as U.S.-Israeli strikes on Iran hit the headlines, signaling a surge of bottom-up demand rather than just institutional rotation.[4]
Options traders have been active as well, using XLE contracts to position for a rebound and potential breakout in the energy sector as volatility in the broader market stays elevated.[3] Some strategists framed the ETF as sitting at an inflection point late last year, with converging trendlines that could resolve higher if crude stayed firm and supply risks persisted, a backdrop that still resonates in the current tape.[2] Add it up and XLE enters this midterm-year spring window with bullish price momentum, heavy retail inflows and a build-up of options exposure that could amplify moves in either direction.
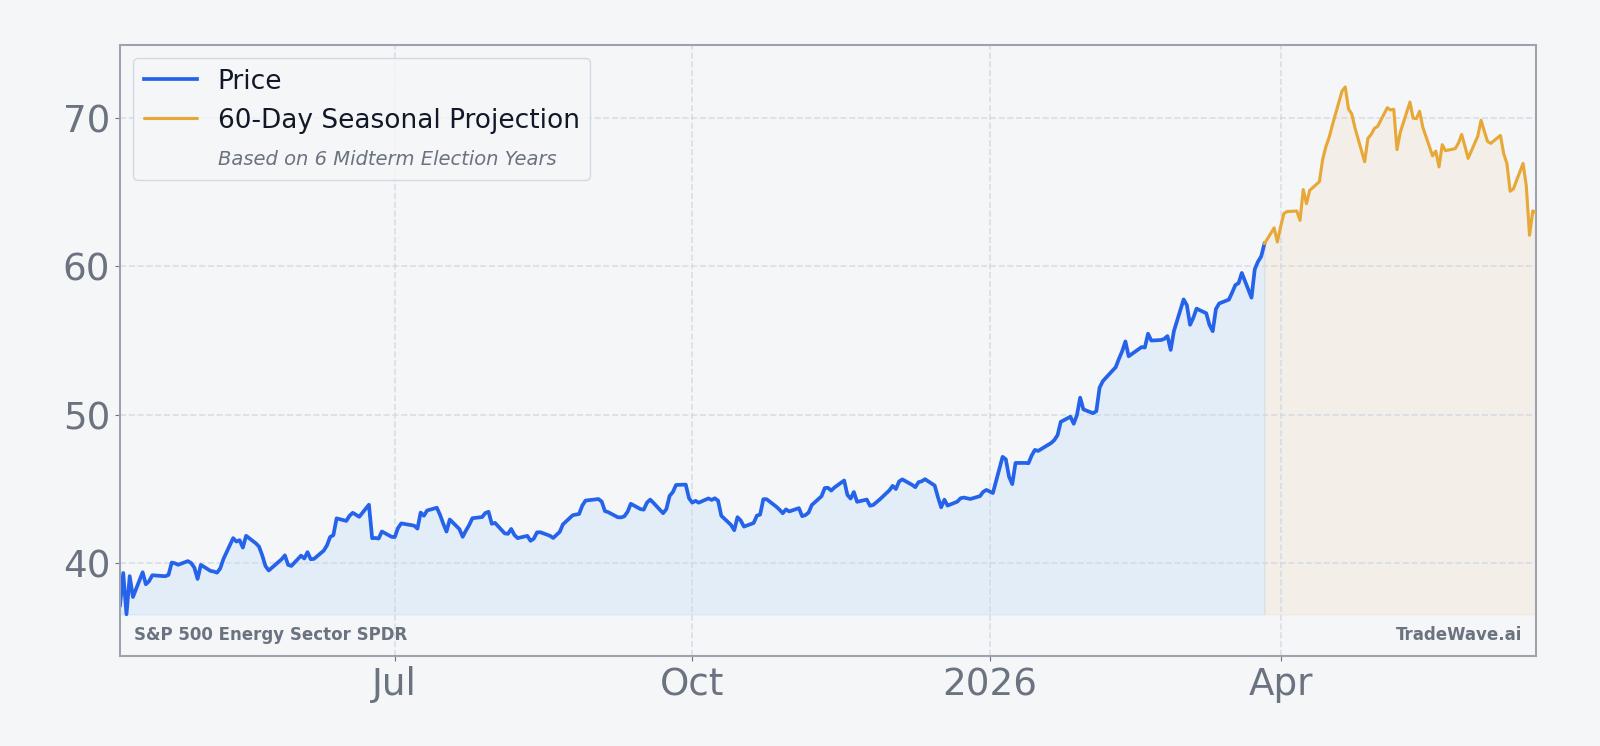
The chart below situates the latest surge against the past year of trading and overlays a 60-day seasonal projection.
What should traders watch in this XLE seasonal window?
The first marker is how XLE behaves as the 15-day window opens on Apr 5 after a strong one-month rally. Historically, the pattern has favored steady upside rather than a quick reversal, so traders will be watching whether price can hold recent gains and grind higher or whether profit-taking overwhelms the usual midterm-year tailwind.
Second, the geopolitical calendar remains central. Any escalation or de-escalation around Iran that shifts crude oil expectations could either reinforce the bullish historical seasonality or swamp it with macro-driven selling.[1] Policy headlines tied to the midterm election year, including regulation, drilling approvals and defense spending, could also feed into sector rotation and either support or undercut the typical XLE seasonal trend.
Third, options and retail flow will be key tells. If the unusual options activity that has targeted upside in XLE continues to build, and if retail inflows stay strong or accelerate, that would signal that speculative capital is leaning into the historical pattern rather than fading it.[3][4] A sharp reversal in those flows, especially if accompanied by rising intraperiod drawdowns similar to the larger MAE years in the historical sample, would be an early sign that this cycle may diverge from the usual script.
Finally, traders will focus on levels rather than price targets: whether XLE can sustain its recent breakout zone around the mid-80s to low-90s, how it reacts to any pullbacks of 2% to 3% inside the window, and whether intraday swings start to resemble the stronger historical years with sizable maximum favorable moves. Behavior on those fronts will show whether this midterm-year April window once again favors the long side or joins 2010 as a rare miss for the pattern.
Sources
About this seasonal analysis
Seasonal pattern data is sourced from TradeWave.ai, which analyzes historical price behavior across annual calendar windows going back up to 30 years. Read the full data methodology or the book The 100-Year Pattern by Afshin Moshrefi (2026 edition). Past performance of seasonal patterns does not guarantee future results. This article is for informational purposes only and does not constitute investment advice.