Warnings on Hormuz Turmoil Meet a Strong April Tailwind for S&P 500 Energy Sector SPDR (XLE)
S&P 500 Energy Sector SPDR is edging toward a historically strong 15-day midterm-year spring window just as options traders and retail buyers lean into the energy trade amid geopolitical tension.

What is the seasonal pattern for S&P 500 Energy Sector SPDR (XLE)?
S&P 500 Energy Sector SPDR has risen in 5 of 6 midterm-year spring windows during this 15-day stretch, with an average gain of 5.28% in winning years.
- 5 wins and 1 loss in this window, with winning years averaging 5.28% gains and a 4% average when all years are included.
- The upcoming 15-day window begins Apr 5 and is grouped across the last 6 midterm election years, giving a focused election-cycle seasonal read.
- Percent Profitable stands at 83%, with 5 winners and 1 loser across the sample.
- Avg Profit reflects only the up years, while Avg Profit - All folds in the lone down year to show a more conservative outcome.
- The TradeWave Ratio of 2.07 signals that price has typically traveled meaningfully in the long direction inside the window, even when final closes were smaller.
- A Sharpe ratio of 1.54 for this pattern points to a historically favorable risk-adjusted profile, though individual years have still seen notable drawdowns.
According to historical data from TradeWave.ai, this midterm-year spring stretch has behaved differently from a typical month for XLE, with a clear directional bias that many investors overlook.
How has S&P 500 Energy Sector SPDR (XLE) traded in this midterm-year spring window?
S&P 500 Energy Sector SPDR has risen in 5 of the last 6 midterm election years during the 15 trading days starting Apr 5, with winning years averaging 5.28% gains. The ETF last traded around 89, leaving it well above its 50-day moving average of 54.62 and highlighting how far the energy sector has climbed since the weakest years in the sample. That combination of a strong historical spring window and an elevated spot price gives this year’s setup more bite than a routine calendar quirk.
Grouping the data by the presidential election cycle matters here because midterm years often bring a different policy and volatility mix than election or pre-election years. Energy stocks sit close to the policy front line, from drilling permits to export rules, so their historical seasonality can look very different in the mid-cycle phase than in the more growth-friendly year before a presidential vote.
The trade direction for this pattern is long, and the numbers back that up. Percent Profitable sits at 83%, with 5 winners and just 1 loser across the six midterm-year samples. Average gains in the winning years come in at 5.28%, while the all-years average, which includes the single down year, still lands at 4%. That gap between Avg Profit and Avg Profit - All shows that the lone losing year was modest, not a wipeout.
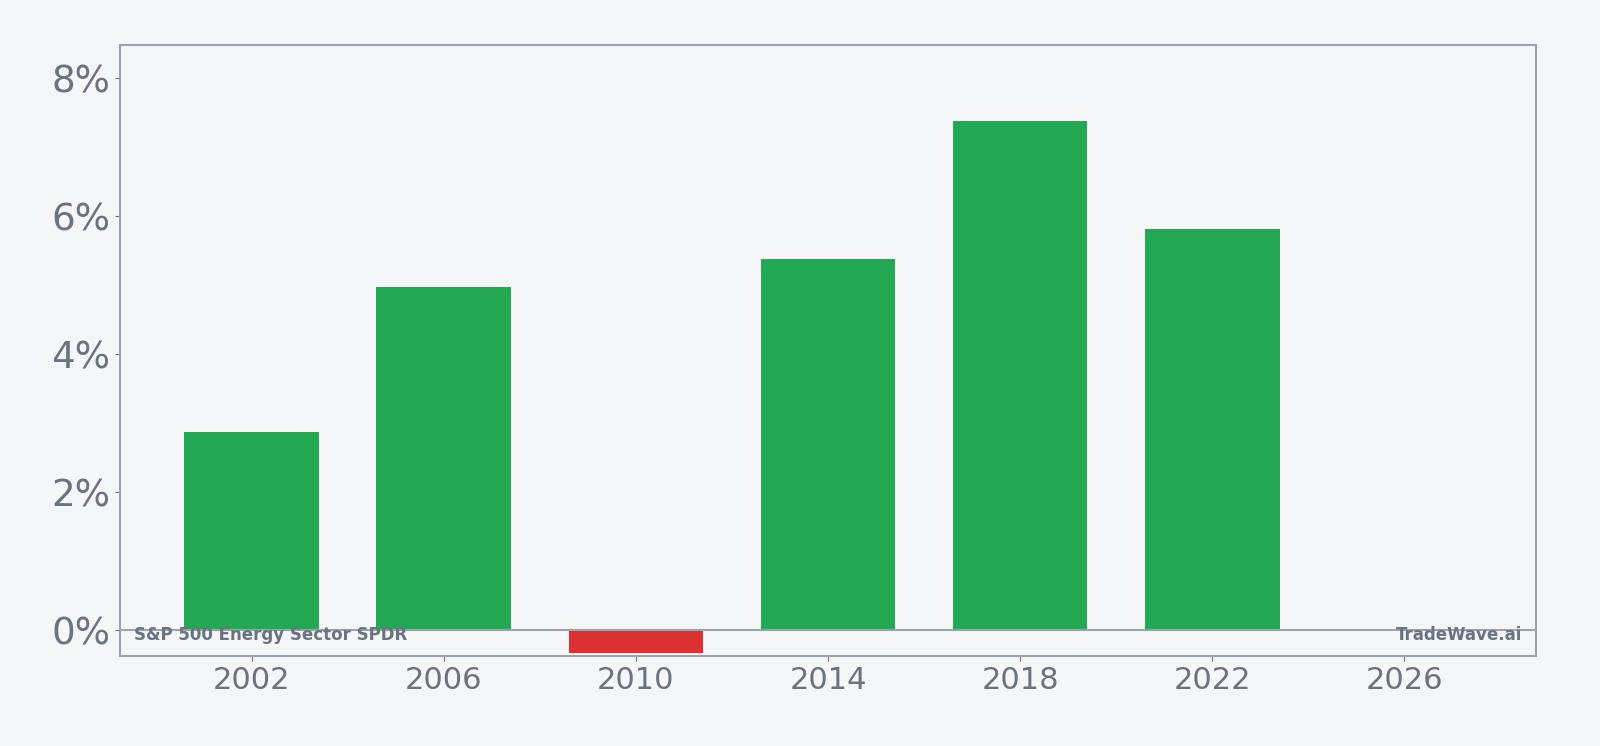
Looking at individual years, 2018 stands out as the strongest run, with a 7.38% net return and a maximum favorable move of 8.21% from entry. At the other end of the spectrum, 2010 was the only losing year, with a small 0.34% decline and a worst intraperiod drawdown of 2.2% from the starting level. The other midterm years, including 2014 and 2022, delivered solid mid-single-digit gains with relatively contained downside inside the window.
The historical seasonal trend chart shows a pattern of steady gains rather than a single explosive day. Returns tend to build across the window, with the average path grinding higher instead of spiking early and fading. That kind of profile can matter for traders who prefer to scale into positions rather than bet on a one-day event.
The combined net, best-case, and worst-case moves by year show how much XLE has swung inside this window, even when final returns looked tame.
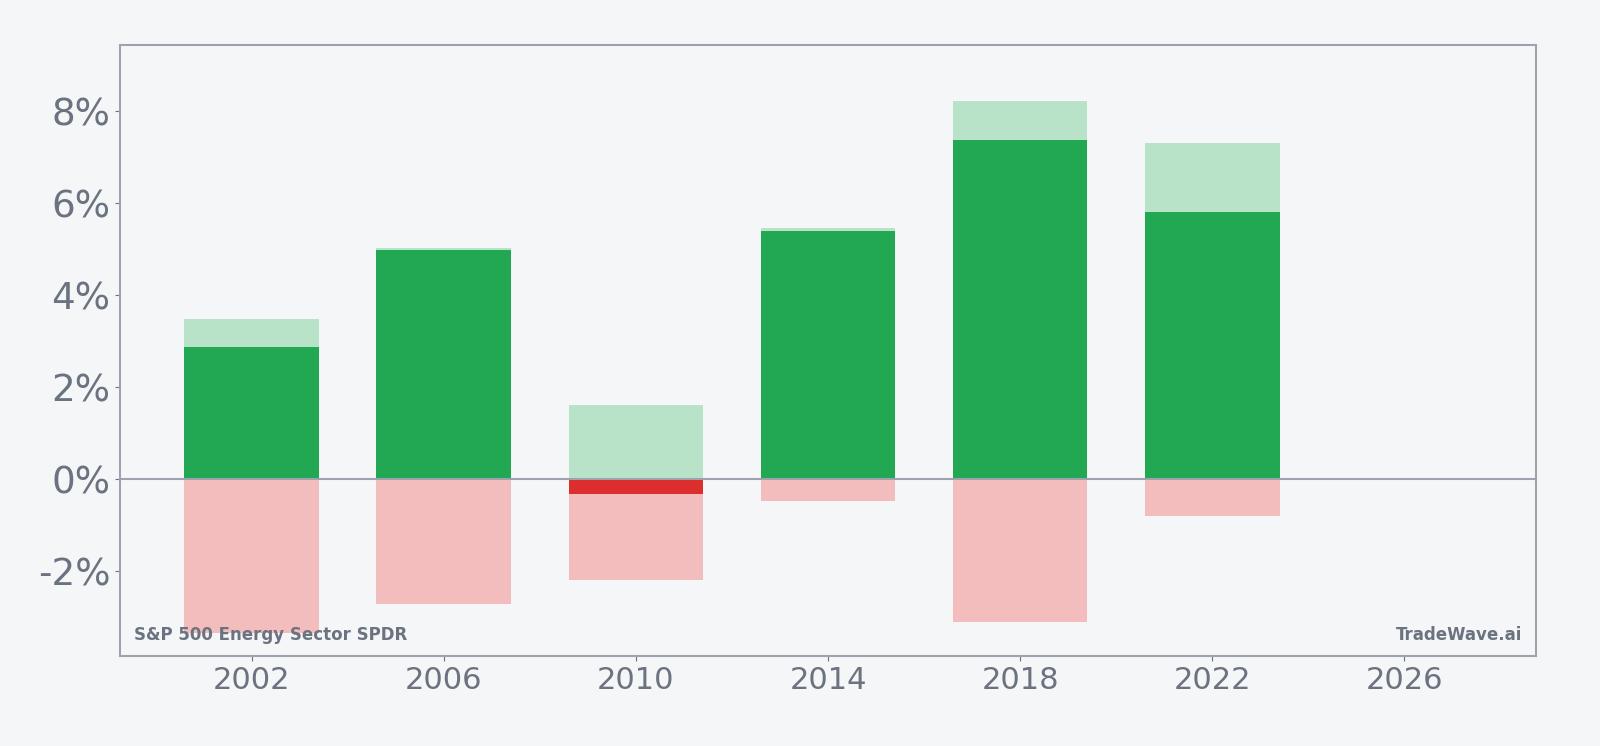
The bar chart that stacks net returns with maximum favorable and adverse moves shows that upside swings have often stretched beyond the final close, while downside excursions have usually stayed smaller. In 2018 and 2022, for example, XLE pushed more than 7% higher at best during the window, while the worst drawdowns stayed under 3.2%. Even in the lone losing year, the maximum favorable move was positive, which means traders who managed risk intraperiod still had chances to capture upside before the modest end-of-window giveback.
History does not guarantee future results, and intraperiod drawdowns can still be meaningful even in windows that have finished higher most of the time.
Why does S&P 500 Energy Sector SPDR (XLE) follow this seasonal pattern?
This midterm-year spring pattern for XLE likely reflects a mix of sector rotation and commodity supply-and-demand seasonality. Analysts often point to the way refiners and producers position ahead of the U.S. summer driving season, when gasoline demand typically rises and crude markets tighten. In midterm years, that backdrop can be amplified by policy debates around energy security and regulation, which may pull institutional flows into the sector during this specific slice of the calendar.
What is driving S&P 500 Energy Sector SPDR (XLE) today?
XLE is trading near 89 after a strong one-month run of 11.87%, a move that has pulled the ETF far above its 50-day moving average of 54.62 and left it well removed from its 52-week low near 17.71. Options traders have been leaning bullish, with structures that sell puts and buy calls to capture potential upside in the energy sector, while retail investors recently bought more than $14 million of XLE in the first hour of trading during a bout of market turmoil, using the ETF as a hedge against geopolitical risk in the Middle East.[1]
Those flows have unfolded against a tense macro backdrop for energy. In early March, U.S.-Israeli strikes on Iran rattled oil markets and pushed some investors toward XLE as a liquid way to express views on crude and integrated producers.[2] Later in the month, U.S. oil executives warned that disruptions around the Strait of Hormuz could deepen an already fragile global energy balance, reinforcing the case for keeping exposure to the sector through broad vehicles like S&P 500 Energy Sector SPDR.[3] Technical analysts have also framed XLE as sitting at an inflection point, with longer-term trendlines suggesting room for an upside breakout if the macro pressure persists.[4]
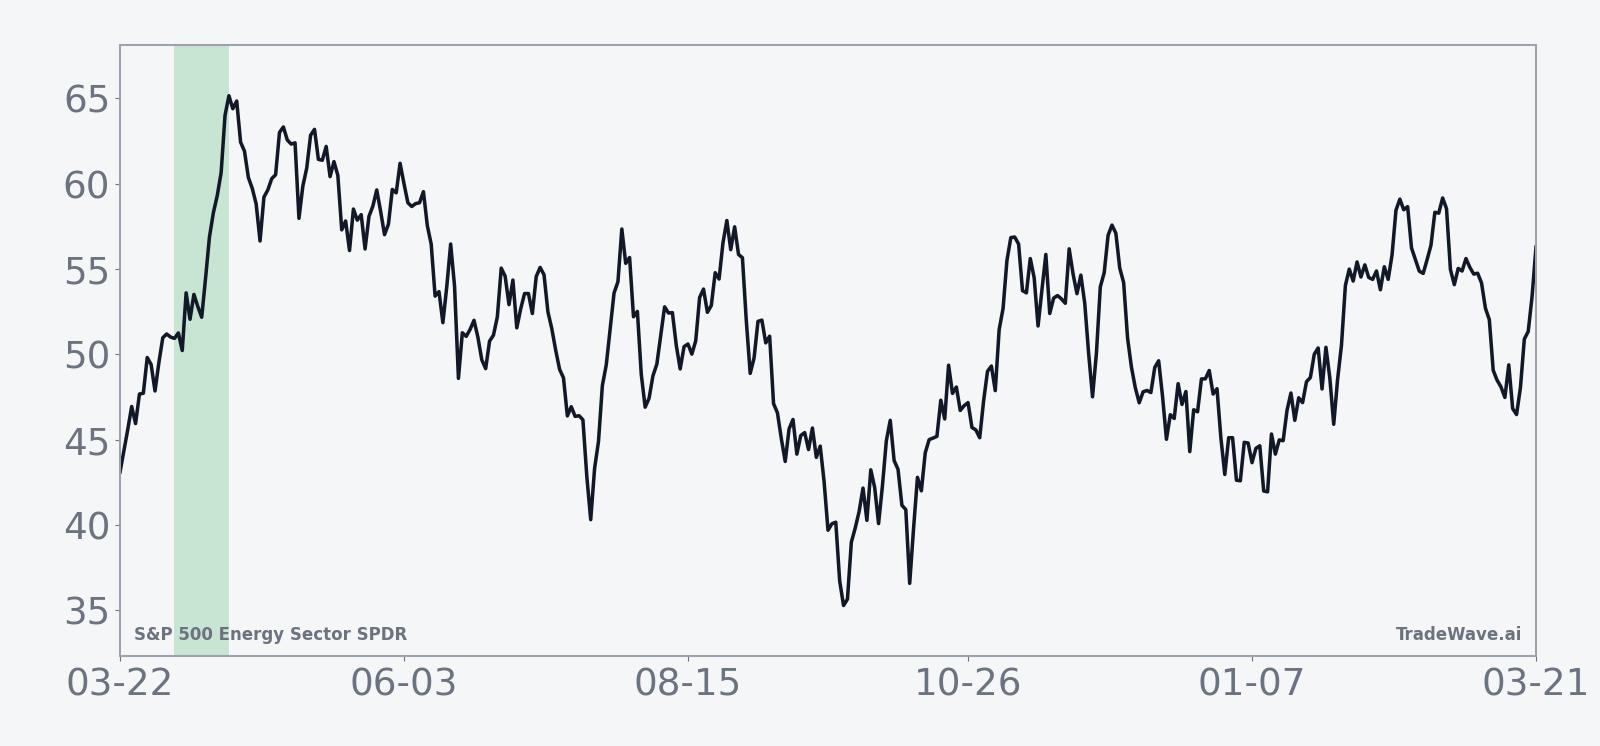
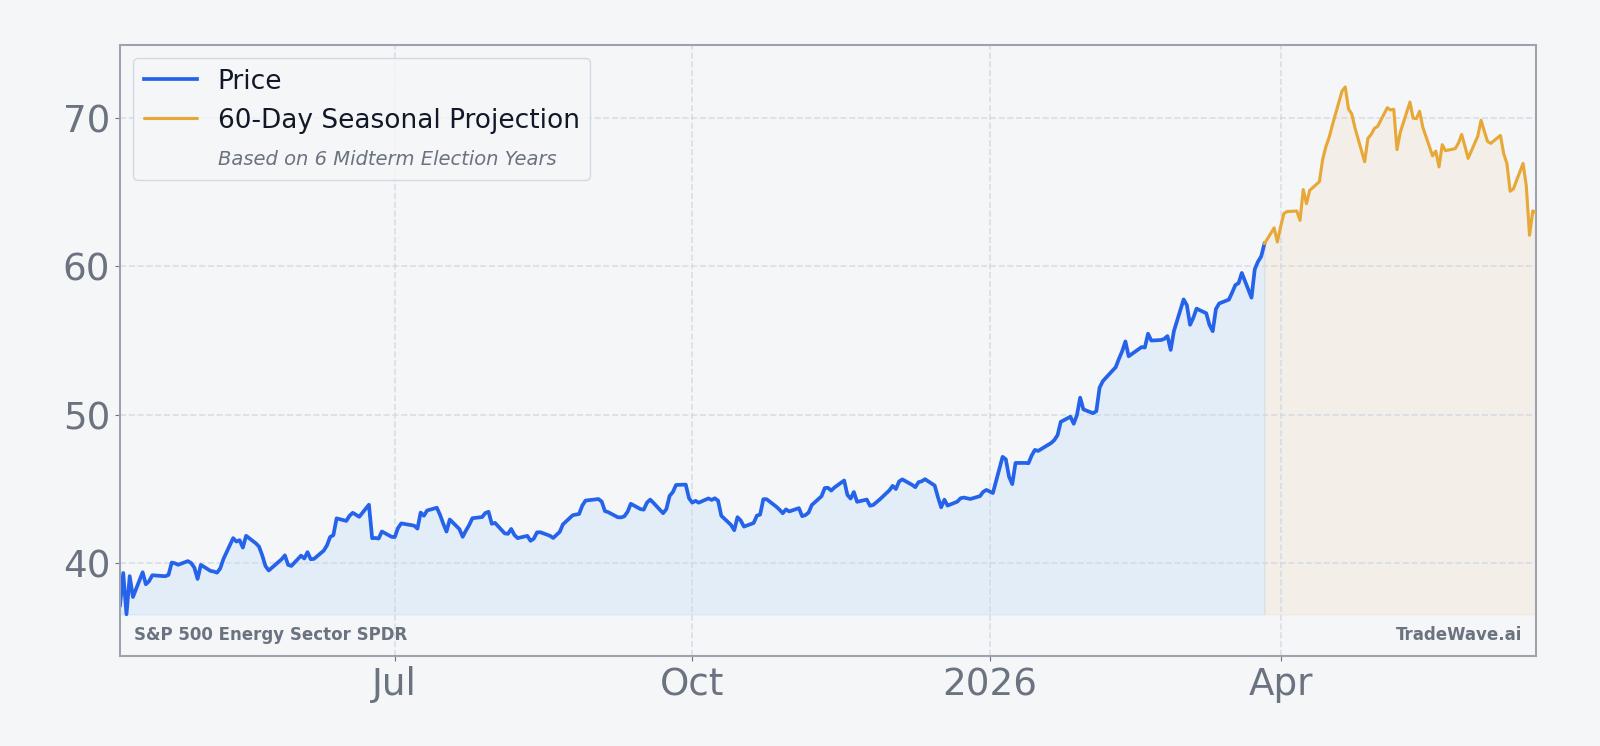
The chart below situates the latest move in its recent multi-month context and overlays the upcoming seasonal projection.
What should traders watch as this XLE seasonal window approaches?
The key near-term catalyst is the opening of the 15-day window on Apr 5, which historically has been a favorable stretch for long exposure in S&P 500 Energy Sector SPDR. Traders will be watching whether XLE can maintain its recent momentum into that date or whether profit-taking cools the tape before the seasonal window even begins. Price action around the start of the window often sets the tone for how much of the historical pattern can play out.
Options and flow signals will also matter. The recent use of put-selling and call-buying structures, along with heavy retail net buying during geopolitical flare-ups, suggests positioning is already skewed toward upside in the energy ETF.[1] If that activity continues to build into April, it could reinforce the historical seasonal bias, but a sudden fade in options demand or a reversal in retail flows would tell a different story. Watching whether volume spikes on up days or down days inside the window will help traders gauge if the historical pattern is being embraced or faded.
On the macro side, any new headlines around Iran, the Strait of Hormuz, or broader energy policy could quickly change the tone for XLE.[2][3] A further tightening in crude supply or renewed warnings from industry leaders would likely keep the ETF in focus as a proxy for energy risk, while signs of de-escalation could take some urgency out of the trade. Finally, the way XLE behaves relative to the broader S&P 500 during this midterm-year stretch will be important: if the ETF outperforms while the index chops sideways, it would fit the historical pattern of energy leadership in this specific election-cycle window.
Sources
About this seasonal analysis
Seasonal pattern data is sourced from TradeWave.ai, which analyzes historical price behavior across annual calendar windows going back up to 30 years. Read the full data methodology or the book The 100-Year Pattern by Afshin Moshrefi (2026 edition). Past performance of seasonal patterns does not guarantee future results. This article is for informational purposes only and does not constitute investment advice.