10-for-10 May-June Slide: Trust VIX Short-Term Futures ETF (VIXY) Has Fallen Every Year
Trust VIX Short-Term Futures ETF is hovering just above its 52-week low as it approaches a 28-day volatility window that has historically rewarded traders betting against the ETF.

What is the seasonal pattern for Trust VIX Short-Term Futures ETF (VIXY)?
Trust VIX Short-Term Futures ETF has fallen in 10 of 10 years during this May 8–June 4 window for short-position holders, with an average gain of 13.05% in winning years.
- 10 for 10 in this window for shorts, with average winning returns of 13.05% over the past decade.
- Seasonal window runs for 28 trading days starting May 8, targeting a short trade direction in VIXY.
- Percent Profitable is 100%, with 10 winners and 0 losers across the 10-year lookback.
- Annualized return for the pattern is 12.91%, with a Sharpe ratio of 2.16 based on end-of-window outcomes.
- TradeWave Ratio of 3.14 indicates that price has typically traveled meaningfully in the short direction within the window.
- Individual years have seen sizable adverse moves against the short before finishing lower, underscoring intraperiod volatility.
According to historical data from TradeWave.ai, this upcoming stretch has behaved very differently from an average month for volatility products, and the next iteration of that pattern begins in just a few trading days.
How has Trust VIX Short-Term Futures ETF (VIXY) traded in this May–June window?
Trust VIX Short-Term Futures ETF has moved lower in this 28-day May 8–June 4 window in every one of the past 10 years for traders positioned short, averaging a 13.05% gain on those short trades. Today VIXY closed at 27.245, up 0.09% on the day and sitting about 59.3% below its 52-week high of 66.93 while holding roughly 9.8% above its 52-week low of 24.81.[1] That combination of a deeply depressed price and a decade-long pattern of further declines in this specific slice of the calendar is what has volatility specialists paying attention.
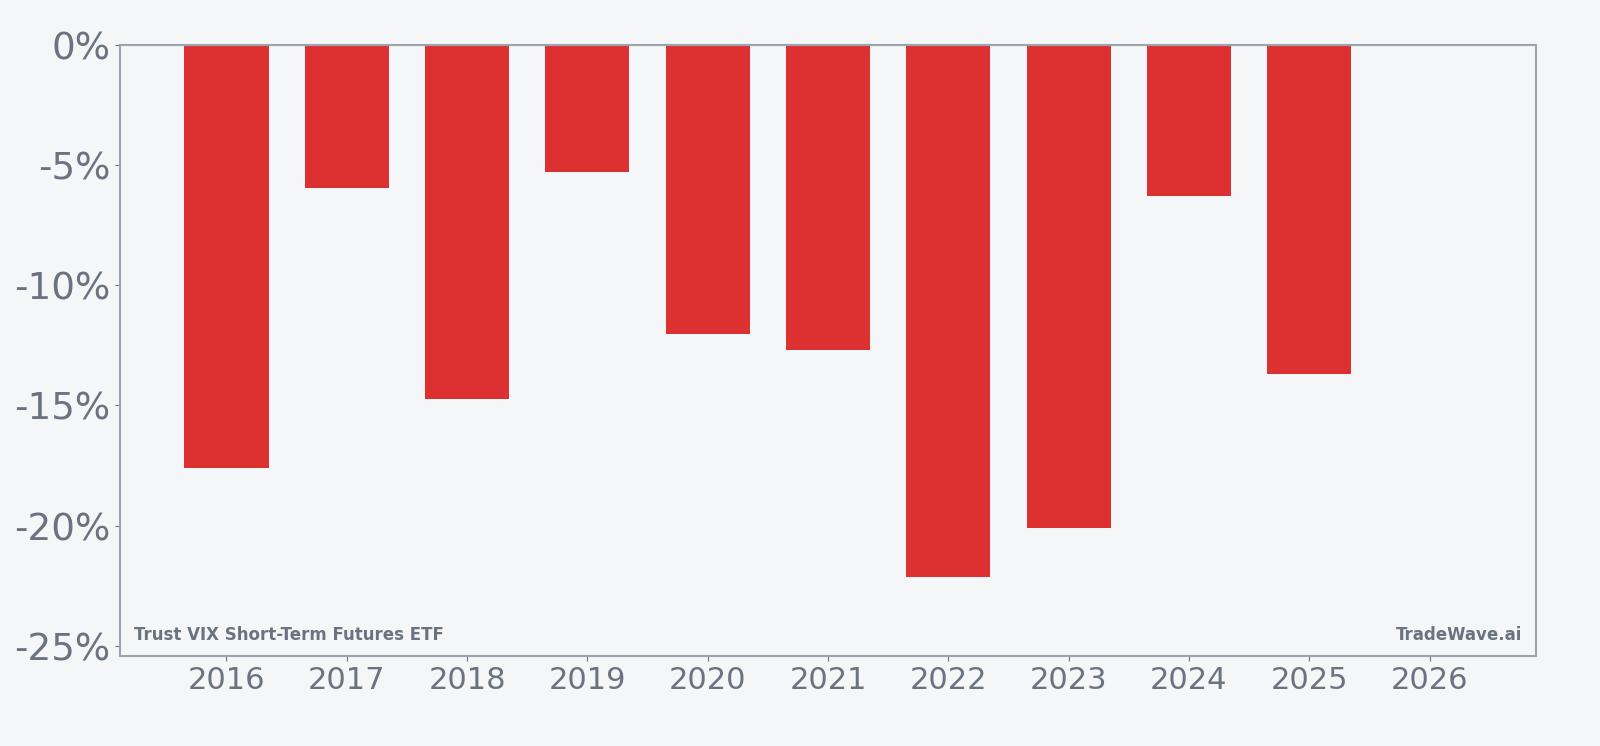
Trade direction for this setup is explicitly short, which means negative returns for VIXY have historically been the “good” outcome for the pattern. Across the 10-year sample, every iteration produced a net decline in the ETF over the 28-day span, with the weakest year for shorts still delivering a 5.28% gain and the strongest year, 2022, returning 22.12% on the short side. Average profit of 13.05% lines up closely with the 13.18% median, suggesting the distribution of outcomes has been relatively tight for such a volatile product.
The per-year table shows how those returns came together. In 2016, a short entered at an equivalent price of 16,528 and exited 28 days later at 13,616.00, a 17.62% gain for the short as VIXY slid. In 2023, the pattern again worked for shorts, with an entry at 153.4 and an exit at 122.6, a 20.08% move in favor of the short position. Even the softer years like 2017 and 2019 still saw VIXY drift lower by 5.96% and 5.28% respectively over the window.
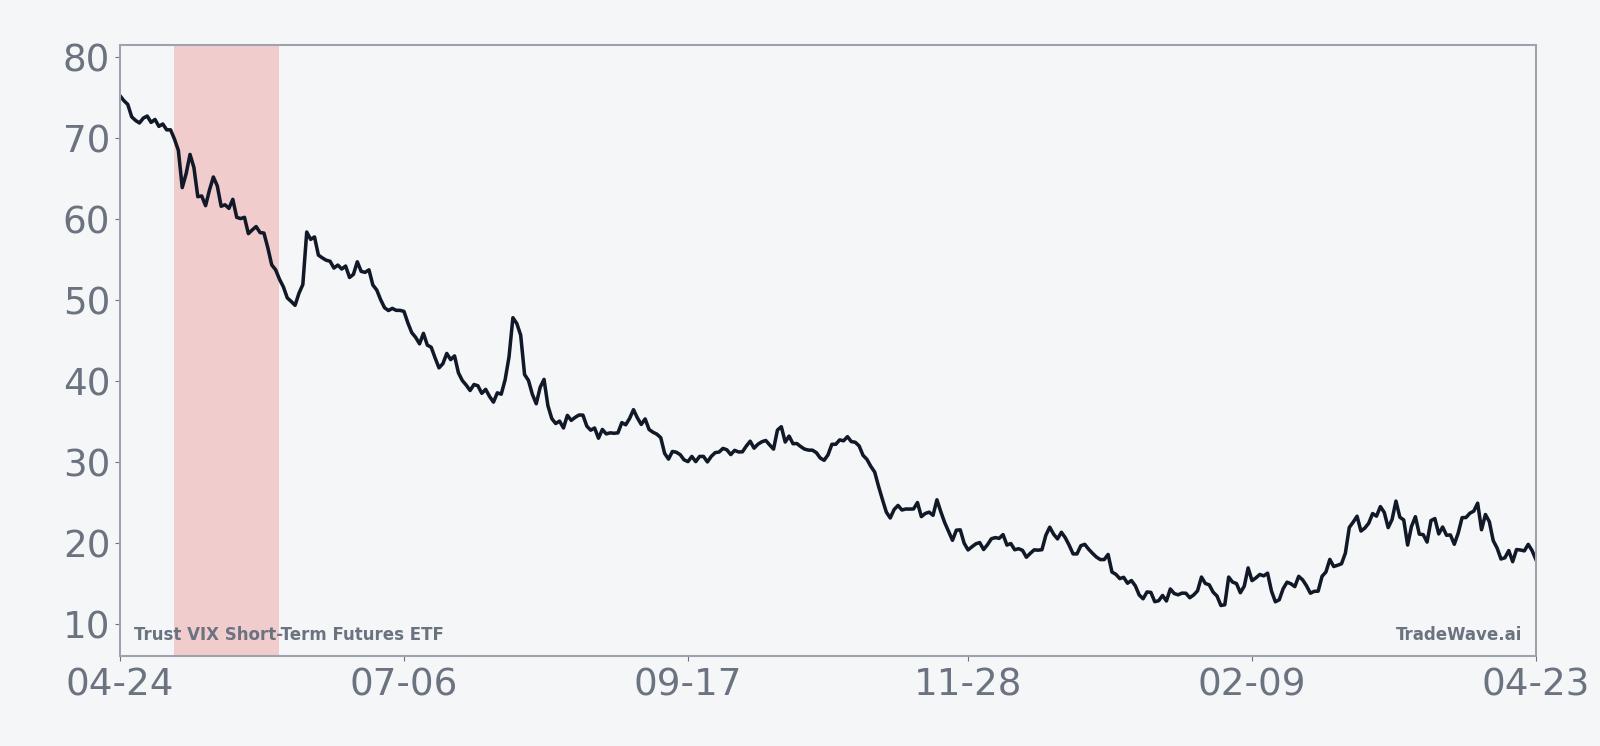
The historical seasonal average shows the bulk of the move for shorts tends to accrue steadily rather than in a single crash. The typical path features early choppiness followed by a more persistent grind lower in VIXY into the back half of the window, which lines up with the idea of volatility bleeding out after spring macro events and earnings clusters.
A second view that layers in best and worst intraperiod swings helps frame how much heat shorts have had to take along the way.
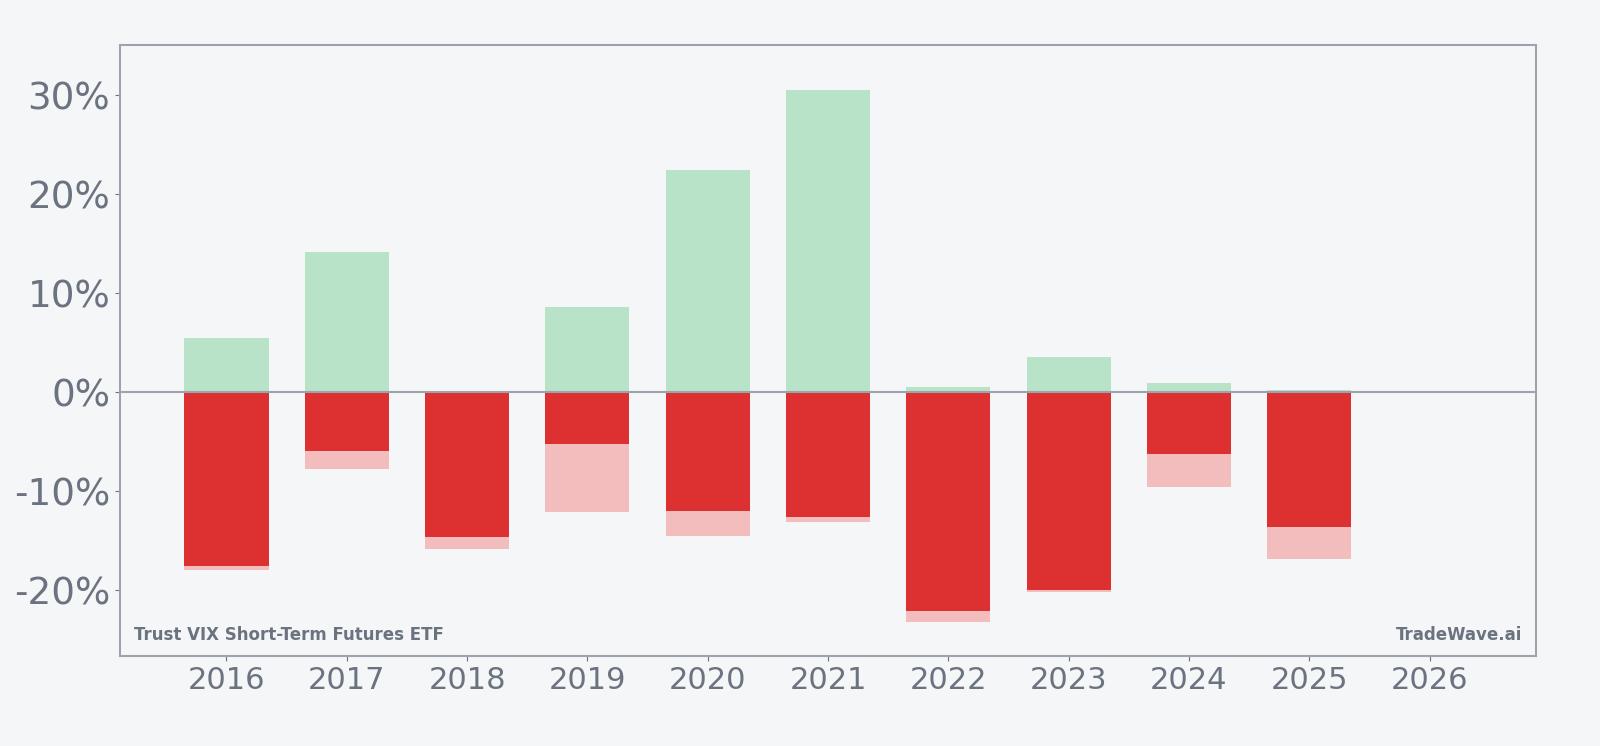
The maximum favorable move, or MFE, has at times been dramatic, with years like 2021 showing a 30.52% peak gain for shorts before the window closed, while 2020 saw a 22.44% best intraperiod move. On the other side, maximum adverse moves, or MAE, have also been sizable, with 2016 and 2022 showing worst drawdowns of 18.01% and 23.27% against the short before finishing in the green. That mix of strong MFE and deep MAE is exactly what the TradeWave Ratio of 3.14 is flagging: this is a high-variance window where volatility exposure can swing hard in both directions even when the final outcome has consistently favored shorts.
The cumulative return profile across the decade adds up to a 236% total gain for the pattern, or 12.91% annualized, which is unusually strong for a short-volatility trade defined over such a tight calendar slice. Nine for nine would already be notable; 10 for 10 with double-digit average returns and a Sharpe ratio of 2.16 makes this one of the cleaner short-bias seasonal windows in the volatility ETF space.
History does not guarantee future results; adverse excursions (MAE) can be large even in winning windows.
Why does Trust VIX Short-Term Futures ETF (VIXY) follow this seasonal pattern?
For a VIX futures ETF like VIXY, one likely driver is the way volatility tends to compress after the bulk of first-quarter earnings and early-year macro events have passed, leaving equity markets calmer into late spring. Analysts have also pointed to systematic volatility sellers and institutional portfolio rebalancing that often lean into short-volatility trades once major risk events clear, which can pressure VIX futures and the ETFs that track them. This May–June seasonal pattern may reflect that recurring shift from event-driven hedging to carry-focused volatility selling.
What is driving Trust VIX Short-Term Futures ETF (VIXY) today?
VIXY finished Monday at 27.245, up 0.09% on the session, after trading between 26.80 and 27.31 on volume of about 2.1 million shares, below its 20-day average of roughly 3.6 million.[1] The ETF has dropped 27.26% over the past month and sits well under its 50-day moving average of 30.68, underscoring how aggressively volatility has been sold as equity markets have stabilized.[1] With the price only a few points above the 52-week low of 24.81 and far from the 66.93 high, the current backdrop is one of subdued fear rather than panic in the broader market.[1]
The chart below situates the latest move in its recent multi-month context and overlays the next 60 days of seasonal tendencies.
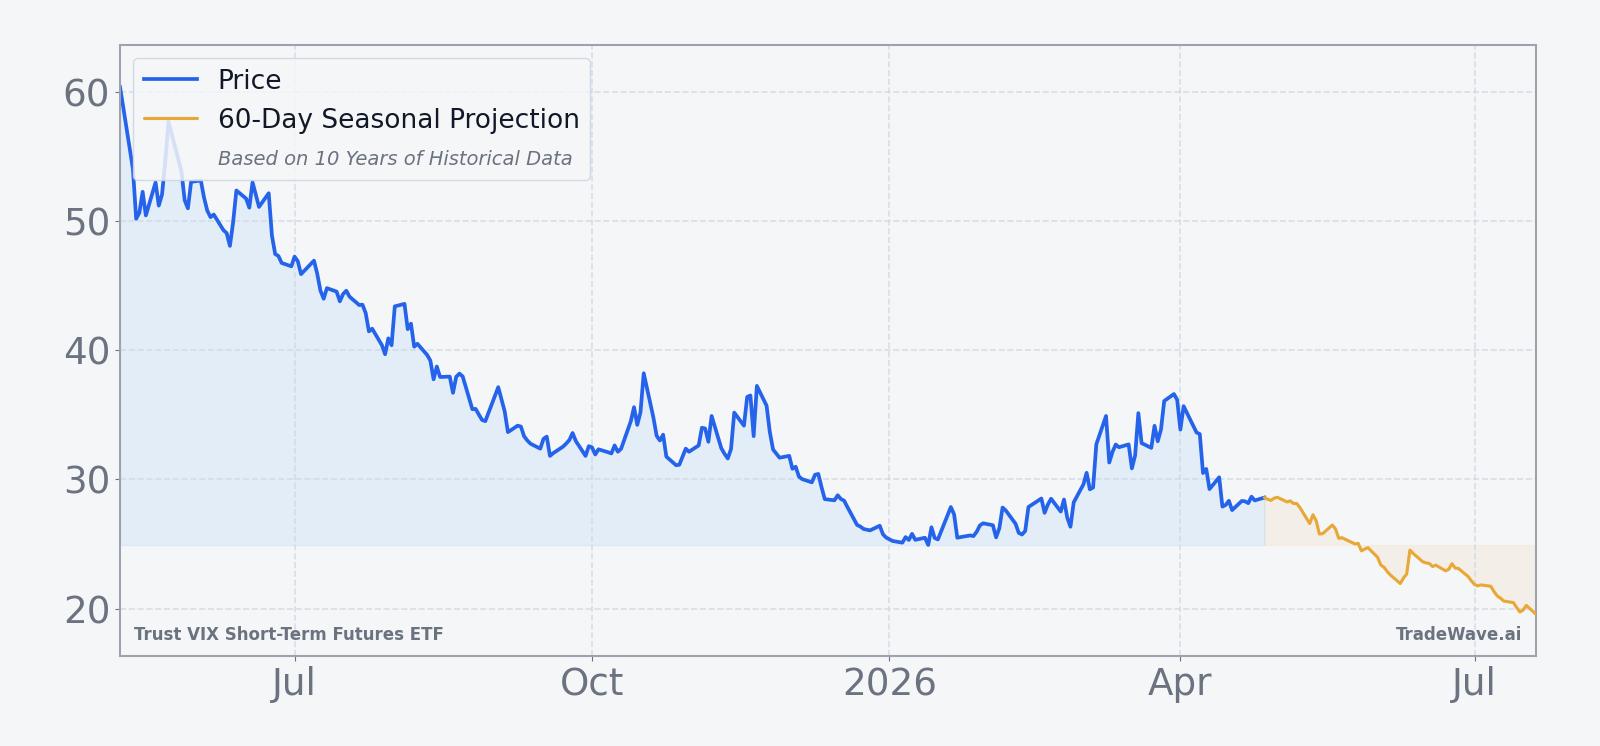
Structurally, VIXY offers exposure to short-term VIX futures, so it tends to spike when equity markets sell off and decay when stocks grind higher and the VIX term structure is in contango. The recent slide in the ETF lines up with a calmer equity tape and a relatively steep VIX futures curve, which increases the daily roll cost embedded in the product. Against that backdrop, the fact that VIXY is about to enter a calendar stretch that has historically favored further declines for the ETF is a notable alignment between current trend and historical seasonality.
What should traders watch in this upcoming VIXY seasonal window?
First, watch how VIXY behaves as the May 8 start date approaches. If the ETF continues to trade below its 50-day moving average and fails to challenge resistance in the low 30s, that would be consistent with the historical pattern of volatility bleeding lower into this window.[1] A sharp pre-window spike back toward the mid-30s would not break the seasonal record, but it would raise the odds of a more volatile path with deeper drawdowns for shorts, similar to the high MAE years in 2016 and 2022.
Second, monitor the broader equity backdrop and VIX futures curve. The pattern has historically worked best when stocks are grinding higher or sideways and the VIX term structure is in contango, which increases the drag on long volatility products. A sudden macro shock that inverts the curve and drives sustained equity selling would be the main scenario that could overwhelm the typical May–June seasonal trend.
Finally, intraperiod behavior will matter as much as the final outcome. Years with the largest gains for shorts have often seen VIXY roll over early in the window and stay heavy, while the more modest years featured bigger early squeezes before the ETF faded. Traders focused on this Trust VIX Short-Term Futures ETF trading window will be watching whether VIXY starts to leak lower quickly after May 8 or instead delivers a sharp countertrend pop that tests the resolve of anyone leaning into the historical seasonality.
Sources
About this seasonal analysis
Seasonal pattern data is sourced from TradeWave.ai, which analyzes historical price behavior across annual calendar windows going back up to 30 years. Read the full data methodology or the book The 100-Year Pattern by Afshin Moshrefi (2026 edition). Past performance of seasonal patterns does not guarantee future results. This article is for informational purposes only and does not constitute investment advice.