10-for-10: Trust VIX Short-Term Futures ETF (VIXY) Has Dropped Every 27-Day Late-Spring Window
Trust VIX Short-Term Futures ETF is ticking higher even as it enters a 27-day window that has historically punished long volatility exposure, a pattern short sellers know well.

What is the seasonal pattern for Trust VIX Short-Term Futures ETF (VIXY)?
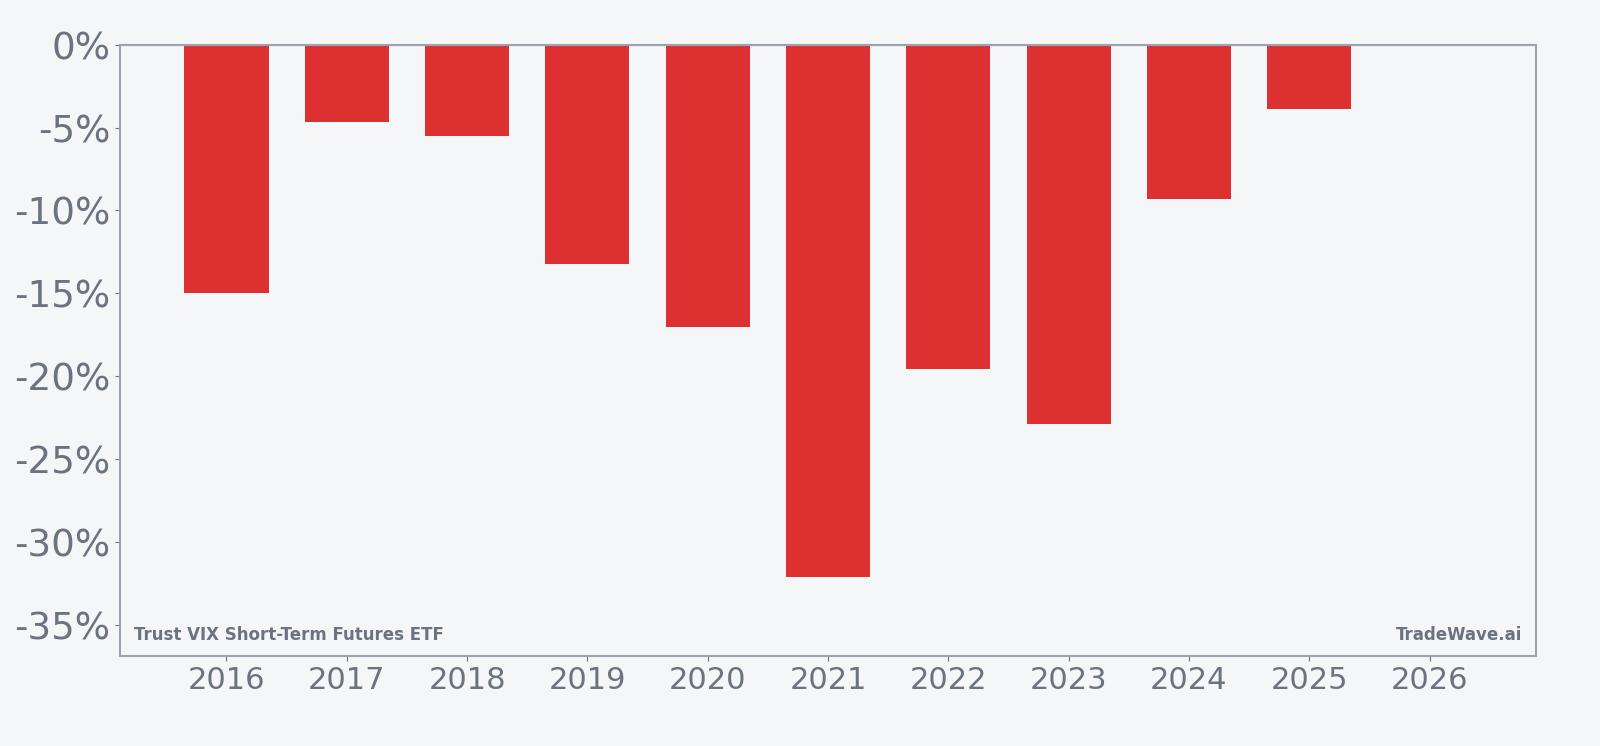
Trust VIX Short-Term Futures ETF has fallen in 10 of 10 years during this late-spring 27-day window, with an average 14.31% gain for short positions in winning years.
- 10 for 10 in this window, with short trades averaging 14.31% profit across the past decade.
- Seasonal window starts May 12 and runs 27 trading days, a historically bearish stretch for VIXY itself.
- Percent Profitable is 100%, with 10 winners and 0 losers for the short-direction pattern.
- Average winner profit of 14.31% comes with a 14.0% annualized return and a Sharpe ratio of 1.56.
- The TradeWave Ratio of 1.82 signals that price has typically traveled meaningfully in the short direction within the window.
- Intraperiod swings have still been sizable, with adverse moves against the short side reaching double digits in several years.
According to historical data from TradeWave.ai, this late-spring stretch has behaved very differently from an average month for VIXY, and the next iteration of that pattern begins today.
How has Trust VIX Short-Term Futures ETF (VIXY) traded in this 27-day window?
Trust VIX Short-Term Futures ETF has declined in this 27-day window in every one of the past 10 years, with short positions posting an average profit of 14.31%. Today the ETF closed at 27.45, up 1.5% on the session and sitting about 53.7% below its 52-week high of 59.24 while holding roughly 10.7% above its 52-week low of 24.81. That combination of a fresh bounce, deep drawdown from last year’s peak and a historically one-sided seasonal pattern is exactly the kind of setup volatility traders watch closely.
Historically, this short-direction pattern has been remarkably consistent. Percent Profitable sits at 100%, with 10 winners and 0 losers across the 10-year lookback, and the cumulative return for the strategy clocks in at 270%. Average profit per trade is 14.31%, while the median outcome is similar at 14.1%, which suggests the window has not been skewed by just one or two outlier years.
The Sharpe ratio of 1.56 points to a strong risk-adjusted profile based on end-of-window results, especially for a volatility-linked ETF. In practical terms, that means the typical payoff for shorts in this VIXY seasonal trend has been meaningfully higher than the volatility of those outcomes. For traders who focus on risk budgeting, that kind of Sharpe stands out in a product that is usually associated with sharp, noisy swings.
The historical seasonal average shows VIXY tending to drift lower fairly steadily across the 27 days, with the bulk of the short-side gains accruing in the middle of the window. Early days often see modest noise, while the back half has historically delivered a more decisive slide in the ETF’s price. That profile lines up with the idea that equity markets often stabilize into late May and early June after spring volatility spikes.
Year-by-year bars with intraperiod swings show how consistently the short side has worked, and how large both favorable and adverse moves have been inside the window.
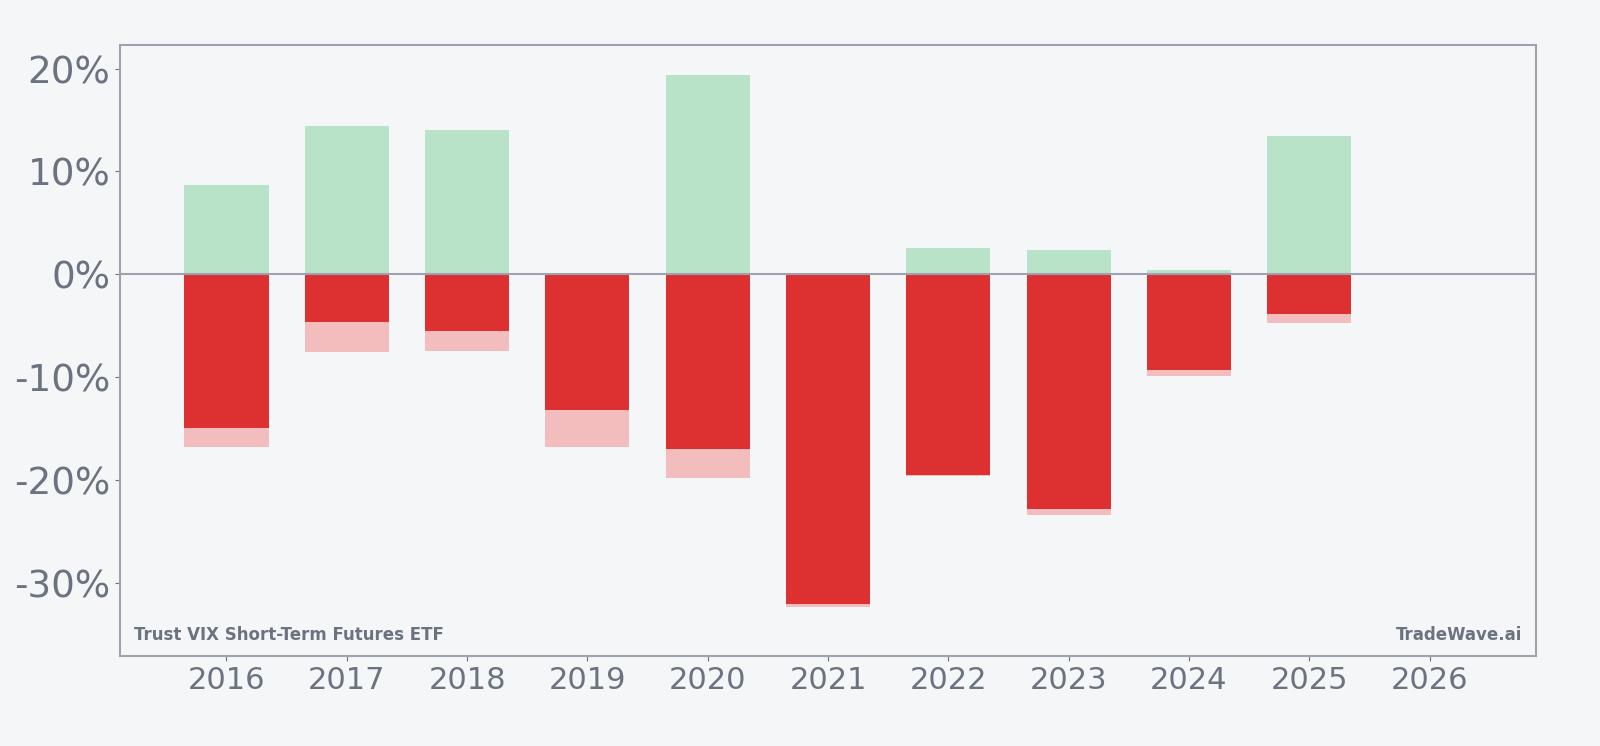
Maximum favorable excursions, the best point-to-peak moves in favor of the short, have often pushed well beyond the final net profit, which means intraperiod gains have sometimes been larger than what traders locked in by the close. At the same time, maximum adverse excursions, the worst drawdowns from entry, have reached into the mid-teens in several years, reminding traders that even a strong seasonal edge can involve painful squeezes before the pattern reasserts itself. Add it up: 10 straight winning years for shorts, but with enough two-way volatility to punish poor risk management.
History does not guarantee future results; adverse excursions (MAE) can be large even in winning windows.
Why does Trust VIX Short-Term Futures ETF (VIXY) follow this seasonal pattern?
One likely driver is the way equity markets often calm down after early-spring event risk, such as earnings season and macro data clusters, which tends to pressure implied volatility lower. VIXY holds short-term VIX futures, so a steady grind lower in volatility futures during quieter tape conditions naturally translates into losses for the ETF and gains for short positions. This pattern may also reflect institutional portfolio rebalancing and options positioning that lean against volatility spikes once the first half of the year’s major catalysts are out of the way.
What is driving Trust VIX Short-Term Futures ETF (VIXY) today?
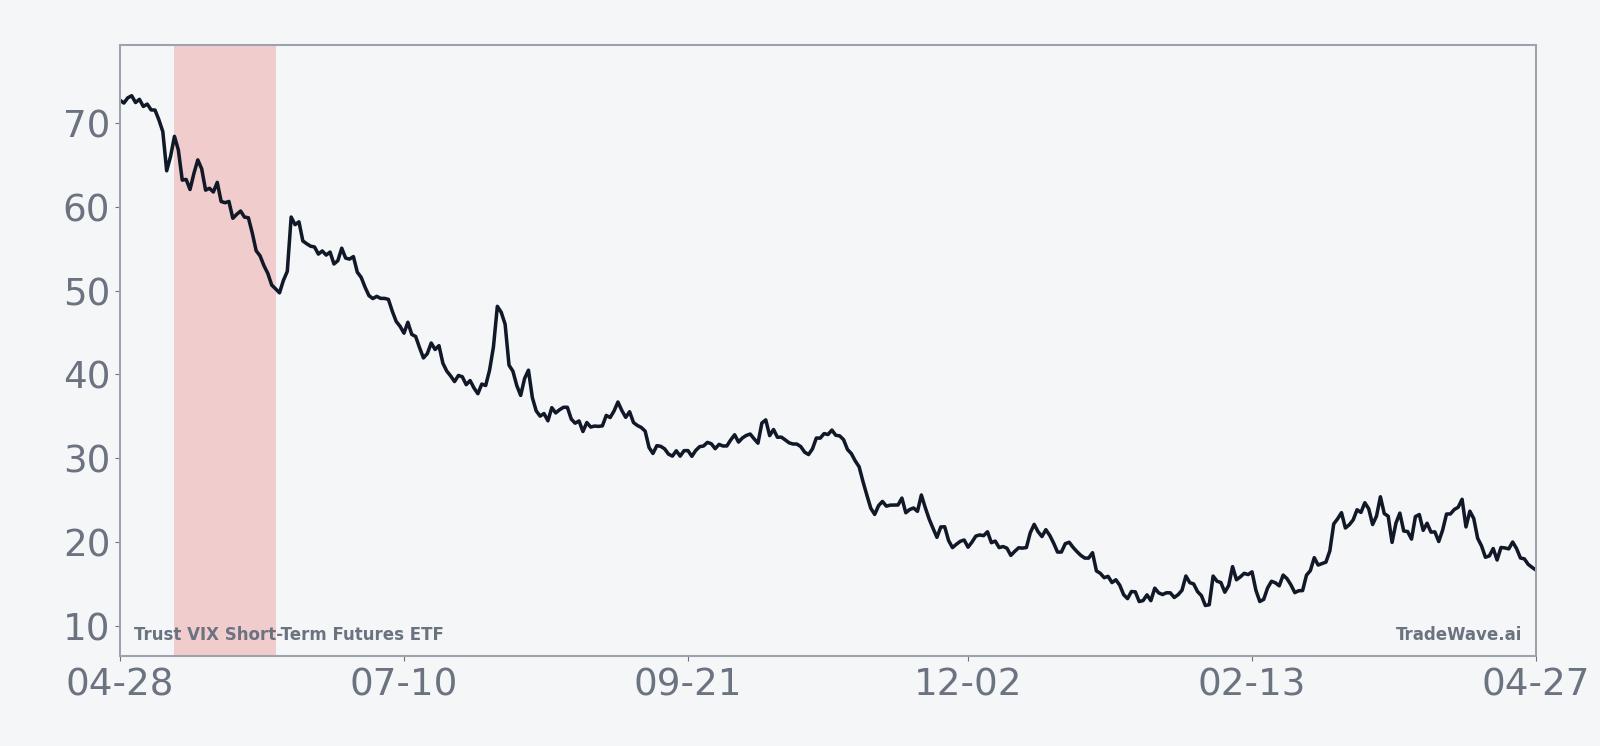
VIXY finished Tuesday at 27.45, up 1.48% on the day, as traders paid modestly higher prices for short-term volatility exposure. The ETF has dropped 4.23% over the past month and remains far below its 52-week high of 59.24, while still trading above the 52-week low of 24.81 and under its 50-day moving average of 30.65. That mix of a short-term bounce inside a longer downtrend is typical for a product that tends to decay when markets are calm and spike when fear returns.
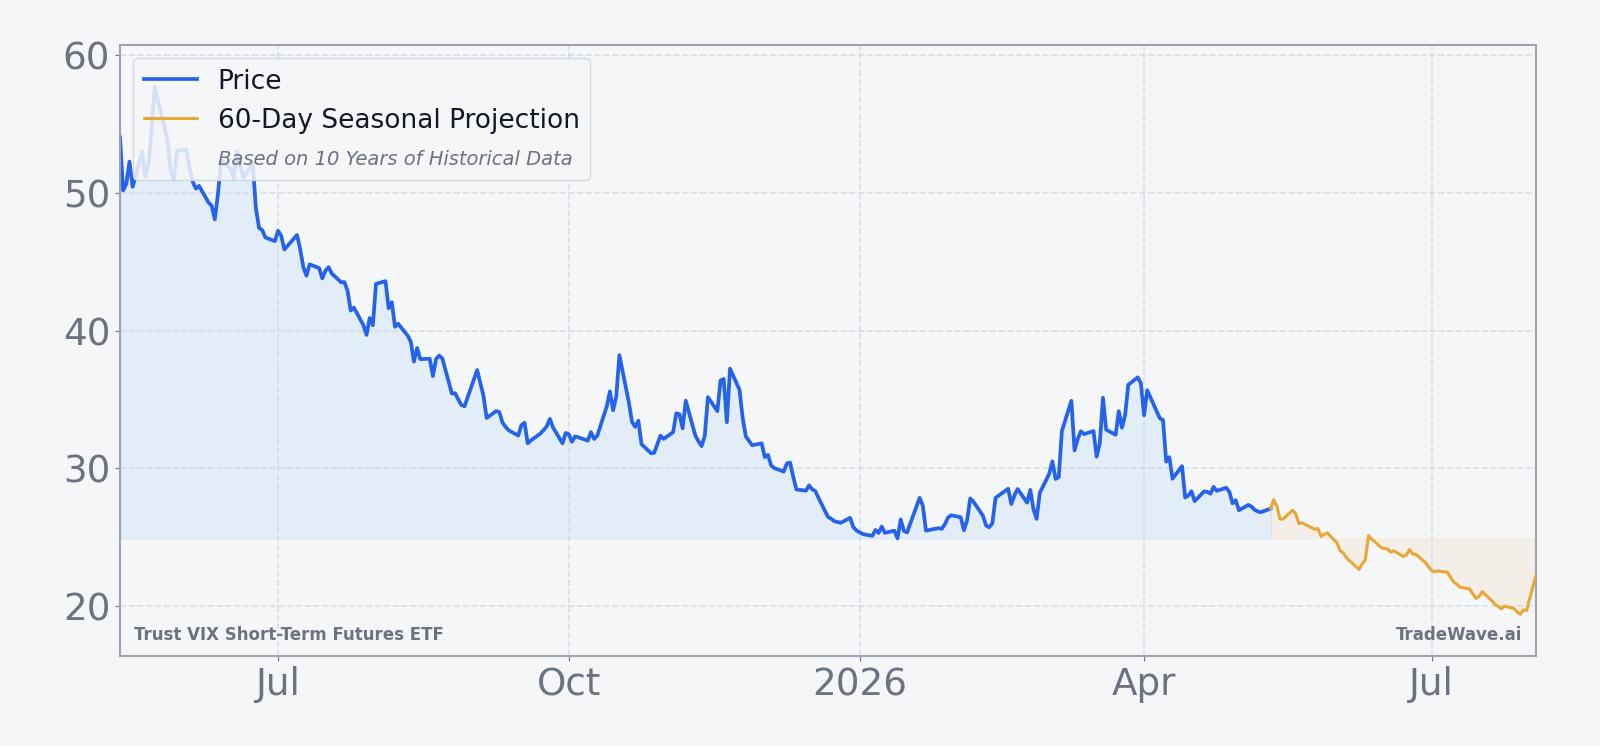
The chart below situates the latest move in its recent multi-month context and overlays a 60-day seasonal projection.
Structurally, Trust VIX Short-Term Futures ETF is designed to track a portfolio of front-month VIX futures, giving traders a liquid way to express views on near-term S&P 500 volatility. That structure comes with well-known costs: daily rebalancing, contango in the VIX futures curve and roll yield can all erode value when volatility is subdued. The current setup, with VIXY trading below its 50-day moving average and deep under its 52-week high, suggests those structural drags have been in play for months as equity markets have avoided sustained stress.
Against that backdrop, the newly opened seasonal window matters because it lines up with a period when those structural headwinds have historically intensified. When front-month VIX futures slide and the curve stays in contango, products like VIXY can bleed quickly, which is exactly what the past decade’s late-spring pattern has captured. For traders who use VIXY tactically, the message is not that the ETF must fall again, but that this specific slice of the calendar has repeatedly rewarded patience on the short side more than speculative long volatility bets.
What should traders watch in this VIXY seasonal window?
First, watch how VIXY behaves relative to its 50-day moving average around 30.65. In prior years, sustained trading below that trend line during this window has often coincided with the strongest short-side outcomes, while sharp breaks back above it have tended to mark the more painful squeezes against the seasonal pattern.
Second, monitor the relationship between VIXY and its 52-week band. The ETF is currently about 53.7% below its 52-week high and roughly 10.7% above its 52-week low, leaving room for both further decay and sudden spikes. A grind toward the low end of that range would be consistent with the historical seasonality, while a fast move back toward the mid-30s or higher would signal that macro volatility is overwhelming the usual late-spring calm.
Third, keep an eye on equity index behavior and macro headlines that could disrupt the pattern. A quiet tape with contained index moves would fit the historical VIXY seasonal trend of steady pressure on volatility futures. In contrast, a surprise shock in growth data, policy or geopolitics that drives a broad risk-off move could flip the script and turn this window into one of the rare years when long volatility pays despite the historical record.
Finally, traders who lean on this VIXY seasonal trend should track intraperiod swings as closely as end-of-window outcomes. The history of double-digit maximum adverse excursions shows that even in a 10-for-10 window, timing and risk controls matter. If this year’s pattern starts with a sharp squeeze higher in VIXY before rolling over, that would echo several past cycles and underline why position sizing and stop discipline are as important as the seasonal edge itself.
Sources
About this seasonal analysis
Seasonal pattern data is sourced from TradeWave.ai, which analyzes historical price behavior across annual calendar windows going back up to 30 years. Read the full data methodology or the book The 100-Year Pattern by Afshin Moshrefi (2026 edition). Past performance of seasonal patterns does not guarantee future results. This article is for informational purposes only and does not constitute investment advice.