Trust VIX Short-Term Futures ETF (VIXY) Has Fallen 10 of 10 Summers in This 52-Day Window
Trust VIX Short-Term Futures ETF is sliding toward its 52-week low just as a historically bearish 52-day seasonal window opens at the end of May, putting fresh focus on how traders hedge volatility into early summer.
What is the seasonal pattern for Trust VIX Short-Term Futures ETF (VIXY)?
Trust VIX Short-Term Futures ETF has fallen in 10 of 10 years during this late-May 52-day window, with an average gain of 15.5% for traders positioned short in winning years.
- 10 for 10 in this window, with an average 15.5% profit for the short side across winning years.
- The upcoming seasonal window starts May 30 and runs for 52 trading days, a stretch that has consistently favored short exposure to VIXY.
- Percent Profitable is 100%, with 10 winners and 0 losers over the past decade in this specific Trust VIX Short-Term Futures ETF trading window.
- Average annualized return for the pattern is 15.31%, with a Sharpe ratio of 2.1 that signals unusually strong risk-adjusted performance for the short setup.
- The TradeWave Ratio (TWR) of 2.67 indicates that price has typically traveled meaningfully in the trade direction within the window, even before final outcomes are booked.
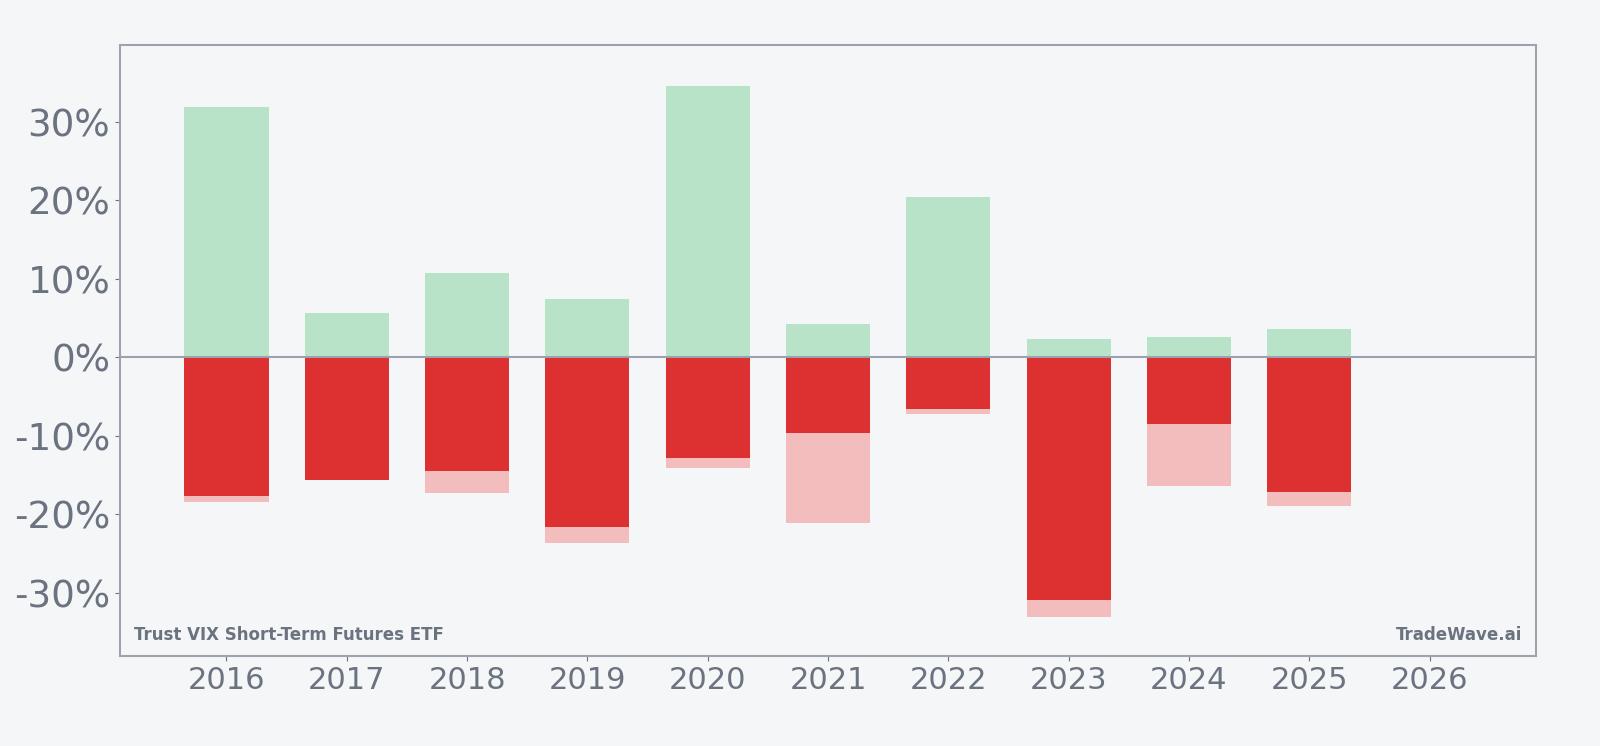
- Historical maximum favorable and adverse moves inside the window show that while the short side has dominated, intraperiod swings in this volatility ETF can still be sharp.
According to historical data from TradeWave.ai, this late-May through mid-summer stretch has behaved very differently from an average month on the calendar for VIXY, and the next iteration is just days away.
How has Trust VIX Short-Term Futures ETF (VIXY) traded in this late-May window?
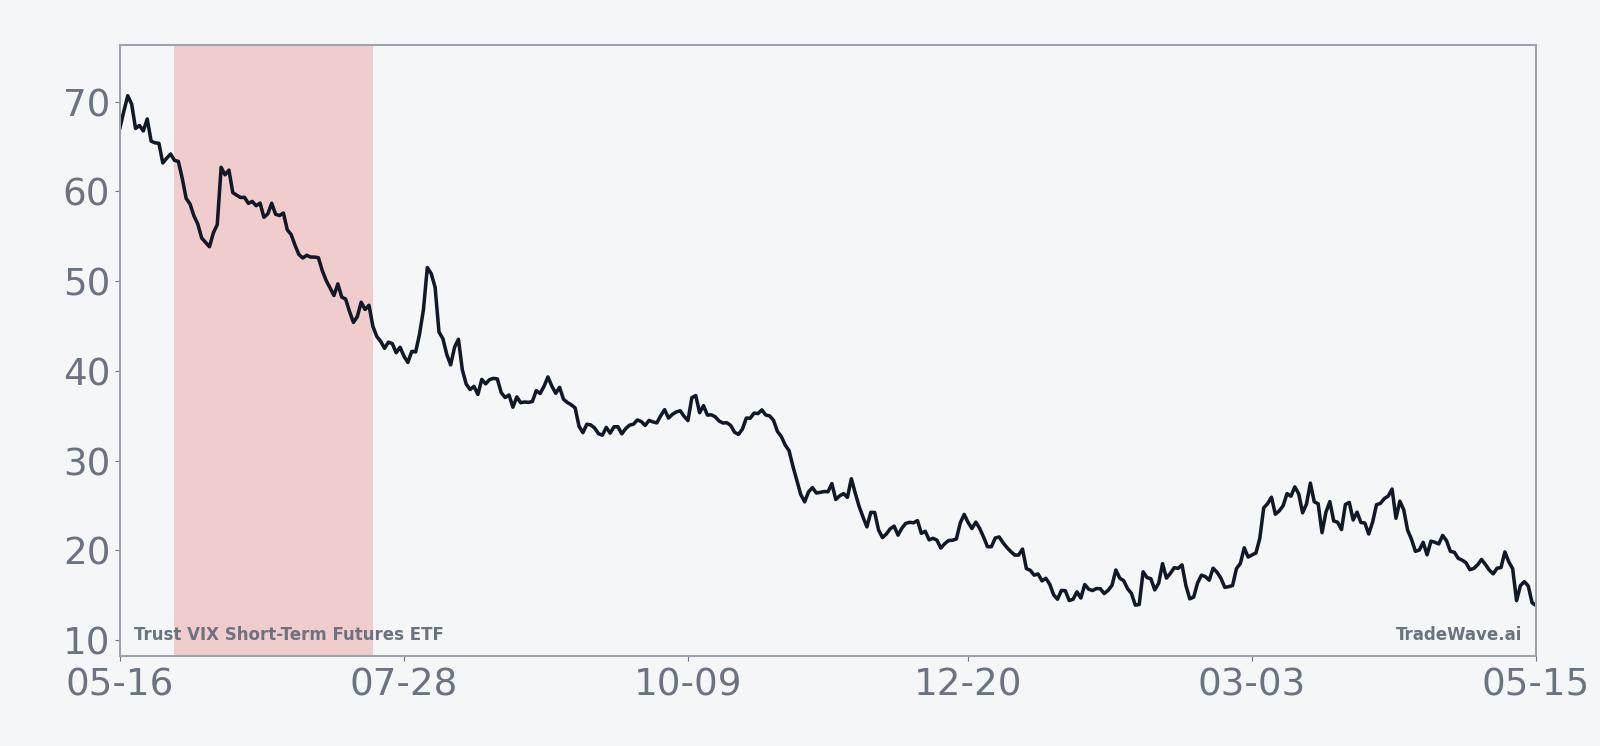
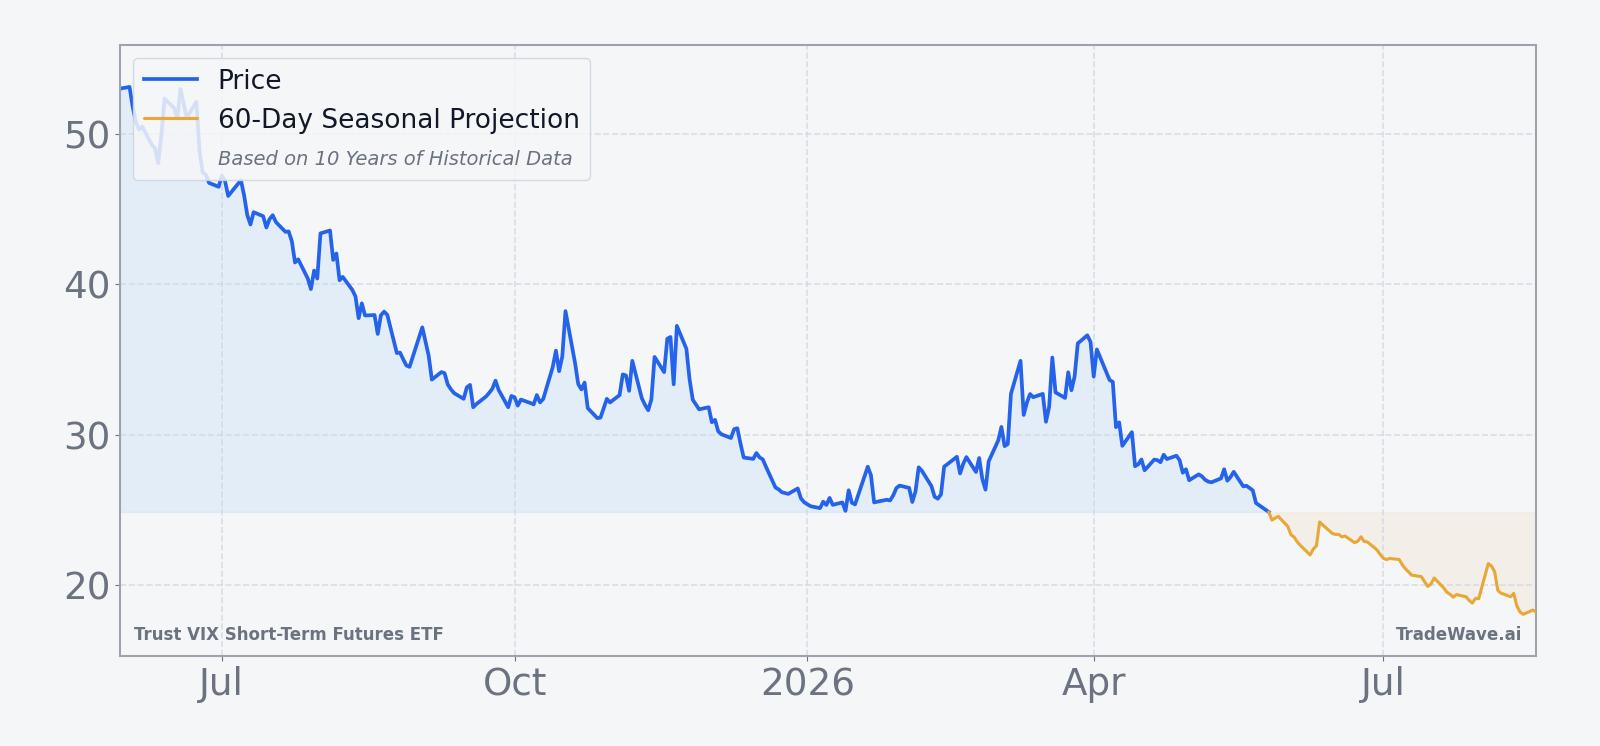
Trust VIX Short-Term Futures ETF has delivered a clean sweep for the bears in this 52-day late-May window, with short positions profitable in all 10 of the past 10 years and average gains of 15.5%. The next window begins on May 30, with VIXY last changing hands at 24.605 after a 3.2% drop on Tuesday and sitting about 57.6% below its 52-week high of 57.99 while hugging its 52-week low of 24.48.[1] That combination of a deeply depressed price and a historically powerful seasonal downtrend makes this slice of the calendar one volatility traders tend to watch closely.
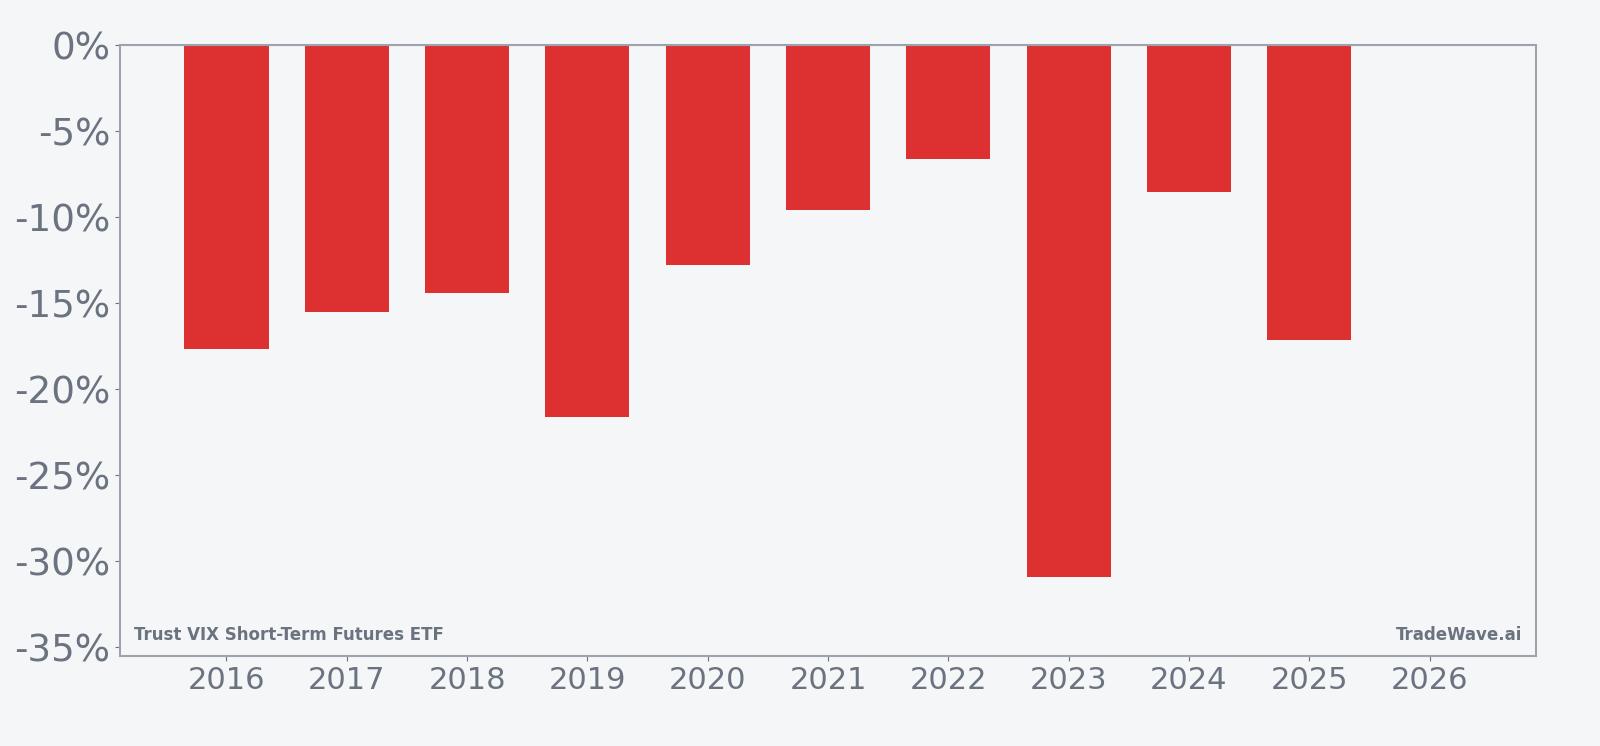
In plain English, this is a historically bearish VIXY seasonal trend that has rewarded traders who were short the ETF during this specific late-May through mid-summer stretch. Percent Profitable sits at 100%, with 10 winners and 0 losers, and the pattern’s 15.31% annualized return and 2.1 Sharpe ratio point to unusually strong risk-adjusted performance for the short side over the past decade. Because the trade direction is short, negative net returns in the per-year table represent favorable years for the pattern, while any upside spikes in VIXY have been headwinds for that strategy.
The average 15.5% profit figure reflects the mean outcome across those 10 winning short trades, while the 16% “all years” average is effectively the same because there were no losing years in the sample. That consistency is rare for a volatility-linked ETF, where single macro shocks can easily flip a seasonal script. Here, even years with sizable intraperiod volatility still finished with VIXY lower by the end of the 52-day window.
Intraperiod swings have still been meaningful. Maximum favorable moves for the short side, captured by the best point-to-trough excursions in VIXY, have reached as much as 34.63% in 2020, while the worst adverse moves against the short side have run as deep as 33.13% in 2023. In other words, the window has tended to offer both strong downside follow-through in VIXY and sharp countertrend spikes that can stress risk management before the pattern ultimately reasserts itself.
Looking at individual years, 2019 and 2023 stand out. In 2019, VIXY fell 21.65% over the window, with a maximum adverse move of 23.69% against the short side before the decline stuck. In 2023, the net return for shorts was even larger at 30.92%, but that came with a 33.13% worst-case run-up in VIXY during the window, a reminder that even “perfect” seasonal records can involve painful squeezes along the way.
The 10-year average seasonal trend line shows that the bulk of the downside in VIXY has tended to accrue steadily rather than in a single air pocket. The typical path features a modest early drop, a choppy mid-window phase where countertrend spikes often appear, and then a renewed slide into the back half of the period. That shape fits with the idea of volatility gradually bleeding out after spring macro events, even if occasional shocks briefly lift the VIX complex.
A closer look at yearly net returns alongside peak favorable and adverse moves shows how consistently the short side has dominated, even with sizable intraperiod swings.
History does not guarantee future results; adverse excursions can be large even in winning windows, and volatility products like VIXY can move sharply in both directions inside any given season.
Why does Trust VIX Short-Term Futures ETF (VIXY) follow this seasonal pattern?
One likely driver is the way equity markets often transition from spring event risk into quieter early-summer trading, which tends to pressure implied volatility and the VIX futures curve that VIXY tracks. Analysts have also pointed to institutional portfolio rebalancing and options expiration cycles that can encourage systematic volatility selling into this part of the calendar. For a short-term VIX futures ETF, that combination of calmer realized volatility and steady supply from vol sellers can translate into a persistent headwind during this specific late-May window.
What is driving Trust VIX Short-Term Futures ETF (VIXY) today?
VIXY fell 3.2% on Tuesday to close at 24.605, extending a one-month slide of 11.4% and leaving the ETF just above its 52-week low of 24.48 and about 57.6% below its 52-week high of 57.99.[1] Trading volume of roughly 3.0 million shares was slightly below the 20-day average of about 3.1 million, suggesting the latest downtick came more from a continued grind lower in volatility pricing than from a sudden rush for the exits.[1] With the 50-day moving average up at 29.62, VIXY remains firmly below a key trend gauge, underscoring how persistent the pressure on short-term VIX futures has been into late May.[1]
The chart below situates the latest move in its recent multi-month context and overlays the upcoming seasonal projection.
For investors who use VIXY as a hedge against equity drawdowns, the current setup is awkward. On one hand, the ETF is already near its 52-week low, which can make fresh hedges feel expensive in carry terms if volatility continues to leak lower. On the other, the same historical seasonality that has favored shorts in this window also implies that long volatility hedges have often struggled to pay off between late May and mid-summer, even when occasional macro scares have popped up along the way.
That tension is why many traders treat this VIXY seasonal trend as a backdrop rather than a trading rule. The pattern does not predict when the next equity shock will hit, but it does show that over the past decade, the path of least resistance for short-term VIX futures in this specific window has been lower. Against that history, the fact that VIXY is already under its 50-day moving average and well off its 52-week high simply reinforces how much the burden of proof sits with the bulls heading into June.[1]
What should traders watch as this VIXY seasonal window opens?
First, watch whether VIXY can hold the 24.48 area that marks its 52-week low or whether the ETF decisively breaks below that level as the May 30 window begins.[1] A clean break lower with only modest intraday spikes would be consistent with the historical pattern of steady downside in this seasonal stretch, while a sharp squeeze higher would echo the more volatile years in the sample where shorts still ultimately prevailed but had to weather large adverse moves.
Second, monitor how VIXY trades relative to its 50-day moving average around 29.62.[1] In prior years, sustained trading below that moving average during this window has often lined up with the grind-lower behavior captured in the seasonal trend, while fast reversals back above it have tended to coincide with the more dramatic intraperiod spikes seen in the maximum adverse excursion data.
Finally, keep an eye on equity index behavior and macro headlines as potential catalysts that could either reinforce or disrupt the usual VIXY seasonal trend. A calm tape with contained realized volatility would fit the historical pattern of pressure on short-term VIX futures into early summer. A surprise macro shock or policy jolt that drives a sudden jump in realized volatility would not erase the decade-long seasonal record, but it could produce the kind of sharp, temporary upside in VIXY that has historically tested short positions before the window’s typical downward bias reasserted itself.
Sources
About this seasonal analysis
Seasonal pattern data is sourced from TradeWave.ai, which analyzes historical price behavior across annual calendar windows going back up to 30 years. Read the full data methodology or the book The 100-Year Pattern by Afshin Moshrefi (2026 edition). Past performance of seasonal patterns does not guarantee future results. This article is for informational purposes only and does not constitute investment advice.