This 50-Day Stretch Has Produced 251% Cumulative Short Profits in Trust VIX Short-Term Futures ETF (VIXY)
Trust VIX Short-Term Futures ETF is entering a historically weak 50-day stretch even as the ETF trades just above its 52-week low, putting a sharp seasonal downdraft on volatility hedges back in focus.

What is the seasonal pattern for Trust VIX Short-Term Futures ETF (VIXY)?
Trust VIX Short-Term Futures ETF has fallen in 10 of 10 years during this early-June 50-day window, with an average gain of 13.59% for traders positioned short in winning years.
- 10 for 10 in this window, with an average 13.59% profit for the short trade across winning years.
- Seasonal window starts Jun 2 and runs 50 trading days, a historically weak stretch for long VIXY exposure.
- Percent Profitable is 100%, with 10 winners and 0 losers for the short-side pattern over the past decade.
- Annualized return for the pattern is 13.4%, with a cumulative 251% gain for the short trade across 10 years.
- Typical volatility is high, with individual years showing large peak run-ups and deep drawdowns inside the window before finishing lower.
- TradeWave Ratio of 2.51 signals that price has historically traveled meaningfully in the short direction during this VIXY seasonal trend.
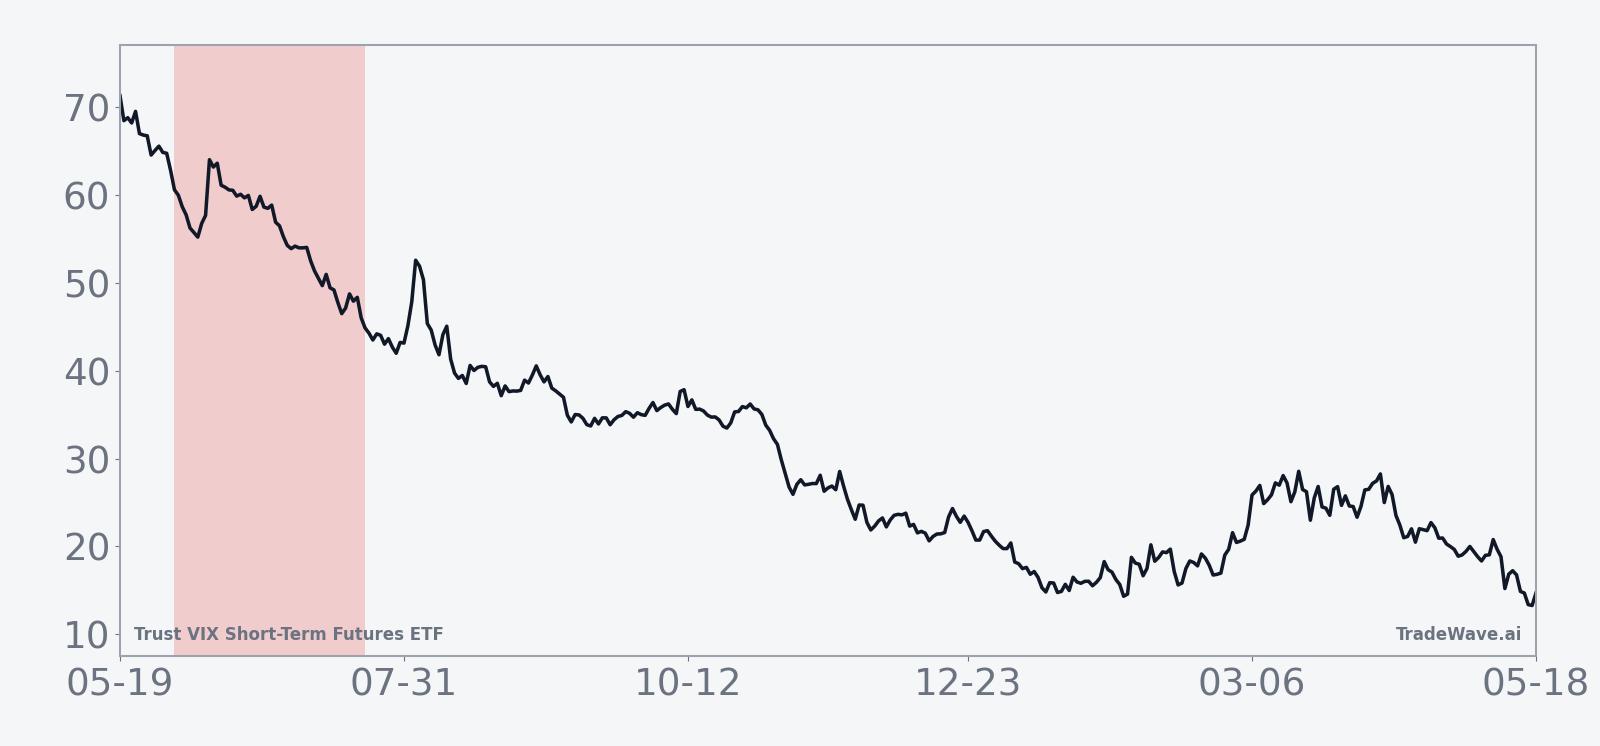
According to historical data from TradeWave.ai, this early-summer stretch has behaved very differently from an average month for VIXY, with a consistent short-side bias that many volatility traders overlook.
How has Trust VIX Short-Term Futures ETF (VIXY) traded in this 50-day seasonal window?
Trust VIX Short-Term Futures ETF has delivered a profitable short trade in every single iteration of this 50-day window over the past decade, with an average 13.59% gain for traders betting against the ETF. The latest window begins on Jun 2, 2026, with VIXY closing at 23.72, up 1.8% on the day and sitting about 3.1% above its 52-week low of 23.01 while more than 50% below its 52-week high of 54.68. That combination of a fresh seasonal regime, depressed spot levels and a perfect 10-for-10 record makes this one of the more striking volatility patterns on the calendar.
Across the 10-year sample, the short-side pattern has an annualized return of 13.4% and a cumulative gain of 251%, with every year finishing lower for VIXY by the end of the 50-day stretch. Average winner profit of 13.59% reflects the typical move in favor of the short trade, while the median outcome of 12.88% shows that results have not been skewed by a single outlier year. The Sharpe ratio of 1.89 indicates that, on a risk-adjusted basis using end-of-window outcomes, this has been a relatively efficient seasonal trade compared with many volatility strategies.
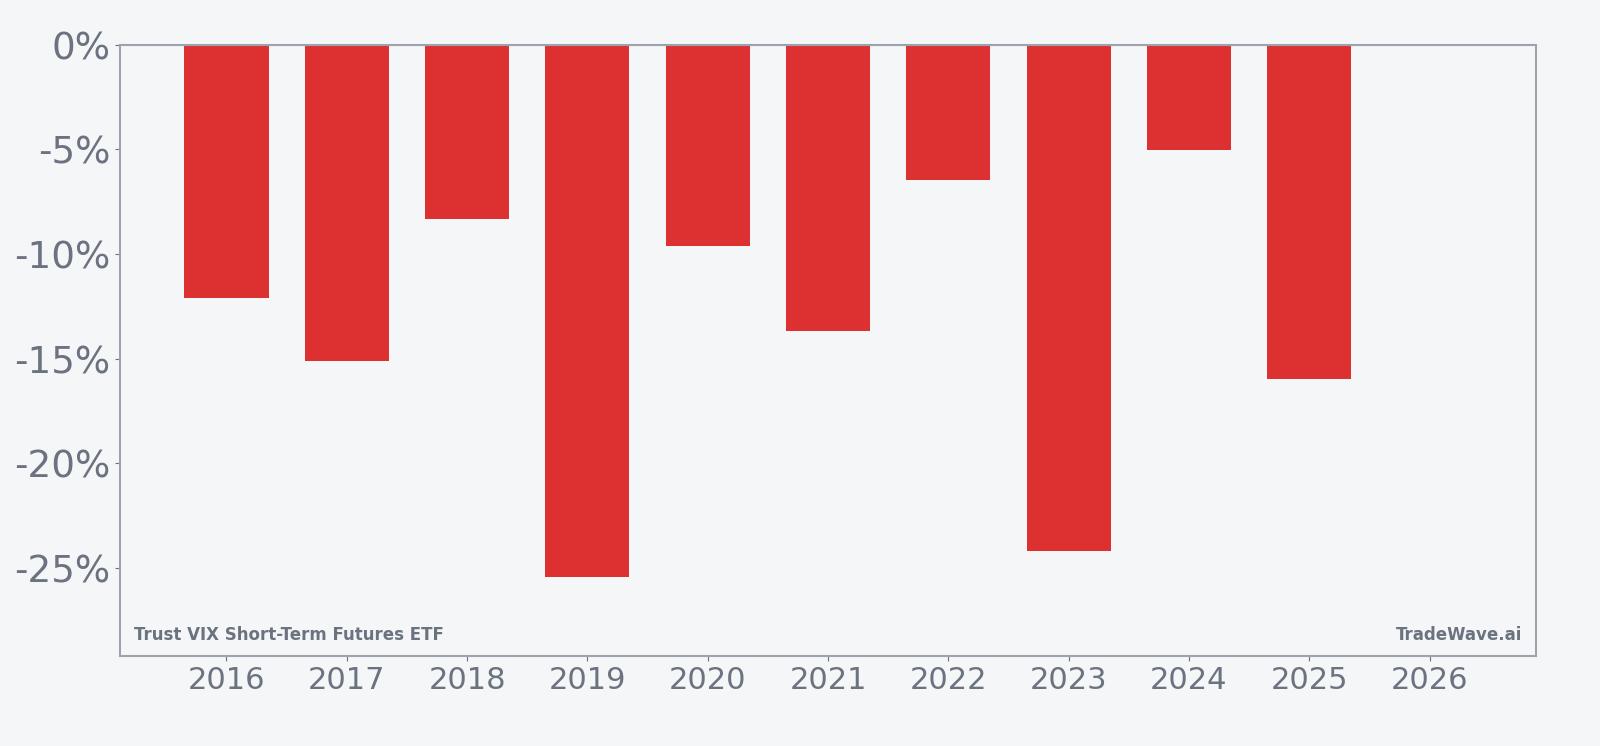
The historical seasonal average shows VIXY tending to drift lower fairly steadily across the window, with the short trade’s gains building over time rather than arriving in a single air pocket. In several years, including 2019 and 2023, the ETF saw especially sharp declines, with net returns of about -25.41% and -24.19% respectively for long holders, which translated into strong gains for shorts. Even the “milder” years such as 2024 and 2022 still finished with VIXY down 5.01% and 6.47%, keeping the pattern’s win rate intact.
Year-by-year bars that combine net results with peak favorable and adverse moves show how choppy the ride has been inside this otherwise consistent pattern.
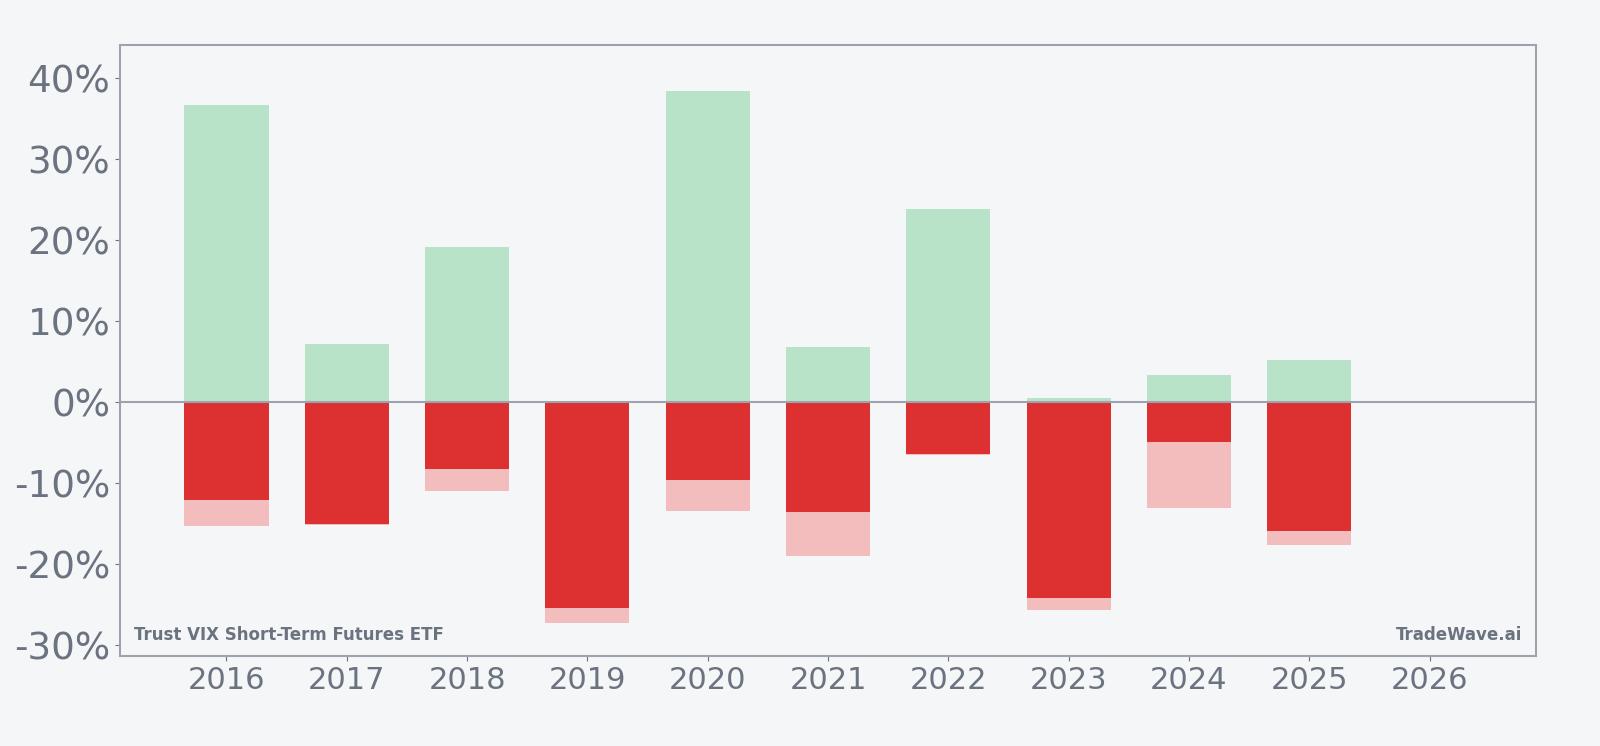
The MFE/MAE profile shows that even in winning years, the path has rarely been smooth. In 2016, for example, VIXY’s best intraperiod move was a 36.72% spike against the short before the ETF ultimately finished 12.12% lower by the end of the window. In 2020, the maximum favorable move for shorts reached 38.37%, but the worst drawdown from entry still hit -13.49% at one point. Years like 2019 and 2023 saw relatively contained upside squeezes, with maximum favorable moves for longs of only 1.51% and 0.48% before the ETF slid more than 24% lower, underscoring how some iterations have been one-way volatility crushes.
History does not guarantee future results; adverse excursions can be large even in winning windows, and traders positioned short VIXY have repeatedly had to sit through double-digit spikes before the seasonal pattern played out.
Why does Trust VIX Short-Term Futures ETF (VIXY) follow this seasonal pattern?
This VIXY seasonal trend likely reflects a mix of summer equity-market behavior and the mechanics of VIX futures. One likely driver is that early summer has often brought calmer equity trading after spring macro and earnings catalysts, which tends to pressure implied volatility and the VIX futures curve that VIXY tracks. On top of that, the ETF’s daily roll into short-term VIX futures can erode value when the curve is in contango, so a quiet stretch for realized volatility often translates into a steady grind lower for long VIXY exposure during this window.
What is driving Trust VIX Short-Term Futures ETF (VIXY) today?
VIXY closed Monday at 23.72, up 1.8% on the session, as traders paid modestly higher prices for short-term volatility hedges. Even after that bounce, the ETF sits just above its 52-week low of 23.01 and far below its 52-week high of 54.68, reflecting how aggressively volatility products have been repriced lower over the past year. One-month performance tells the same story: VIXY is down 13.05% over the last 30 days, with the 50-day moving average up at 28.95 and 20-day average volume around 3.3 million shares, a setup that leaves the ETF trading below a falling trend line with liquidity still ample for tactical positioning.
The chart below situates the latest move against the past year of trading and overlays the next 60 days of seasonal projection.
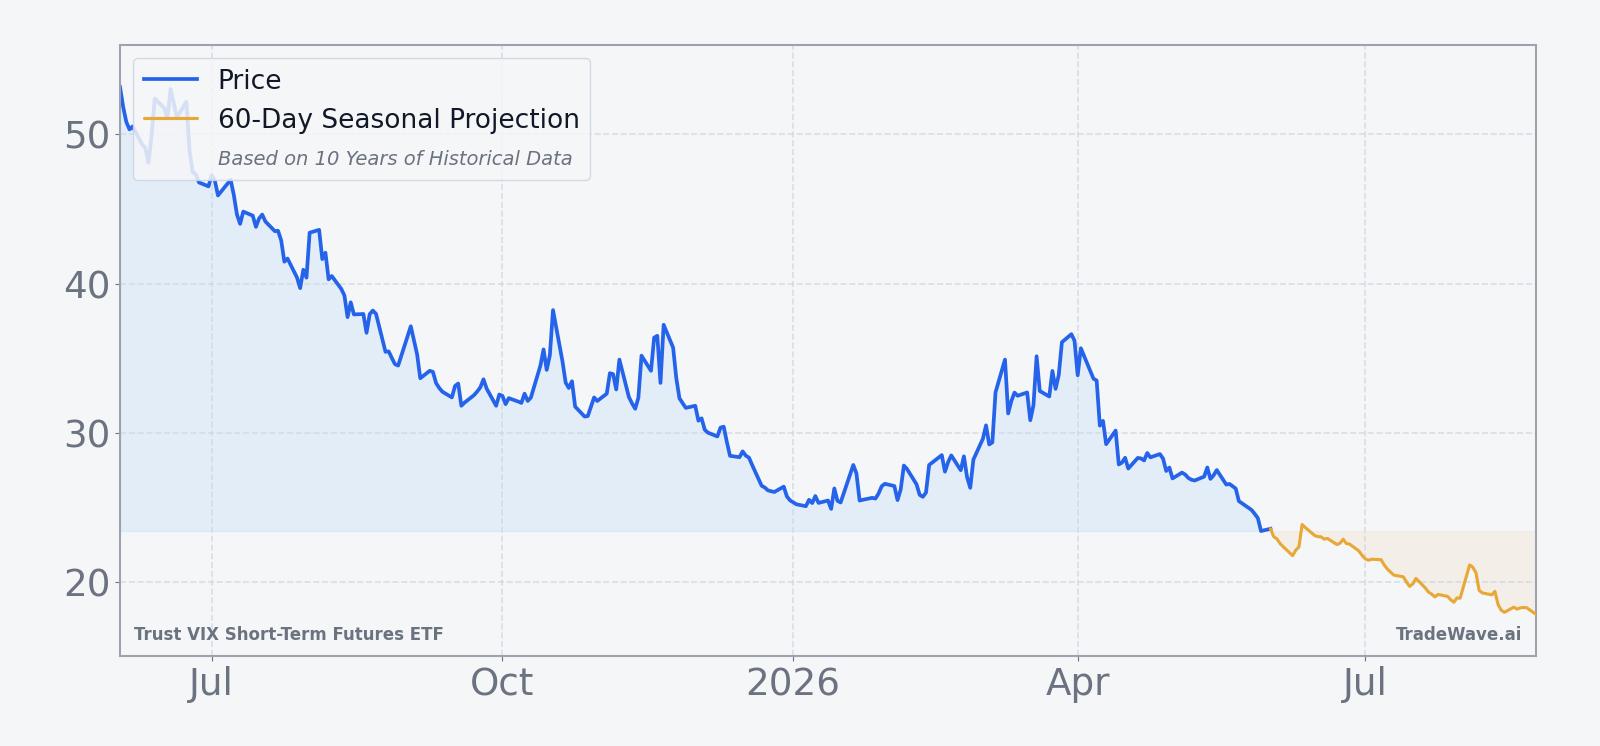
Structurally, Trust VIX Short-Term Futures ETF offers long exposure to a rolling basket of short-term VIX futures, giving traders a liquid way to express views on equity volatility rather than on the S&P 500 itself. That design means the ETF is highly sensitive to both realized and implied volatility, as well as to the shape of the VIX futures curve and the daily roll cost embedded in its strategy. When markets are calm and the curve is upward sloping, VIXY tends to bleed lower as contracts roll from cheaper front-month futures into more expensive later months, a dynamic that has dominated much of the past year.
Against that backdrop, the early-June seasonal window takes on added importance. The historical pattern suggests that, even when VIXY starts the period from already depressed levels, the combination of quiet summer trading and roll decay has often produced another leg lower for the ETF. For investors who use VIXY as a hedge, that history is a reminder that timing matters: buying and holding long volatility through this specific 50-day stretch has been a tough proposition over the last decade, while systematic short exposure has fared far better.
What should traders watch in this VIXY seasonal window?
Three things will matter most as this 50-day Trust VIX Short-Term Futures ETF trading window unfolds. First, watch whether VIXY can reclaim and hold above its 50-day moving average near 28.95; in prior years, sustained trading below that kind of trend line has often coincided with the seasonal pattern continuing to favor shorts. Second, monitor realized equity volatility and the VIX futures curve: if summer remains calm and the curve stays in contango, the historical seasonality argues that roll decay could keep pressure on long VIXY positions. Third, track how closely the ETF’s behavior lines up with the 10-year seasonal average path; a quick squeeze higher followed by renewed weakness would fit the historical script, while a durable breakout above recent ranges would mark a clear departure from the pattern.
Sources
- No external news or macro sources were used; all price and seasonal statistics are drawn from the TradeWave.ai dataset and associated market context for VIXY as of Jun 2, 2026.
About this seasonal analysis
Seasonal pattern data is sourced from TradeWave.ai, which analyzes historical price behavior across annual calendar windows going back up to 30 years. Read the full data methodology or the book The 100-Year Pattern by Afshin Moshrefi (2026 edition). Past performance of seasonal patterns does not guarantee future results. This article is for informational purposes only and does not constitute investment advice.