CORN Slips in 9 of Last 10 Years as June Seasonal Window Nears
CORN is hovering near the middle of its 52-week range just as a historically bearish 23-day June trading window for the ETF comes back into view.

What is the seasonal pattern for CORN (CORN)?
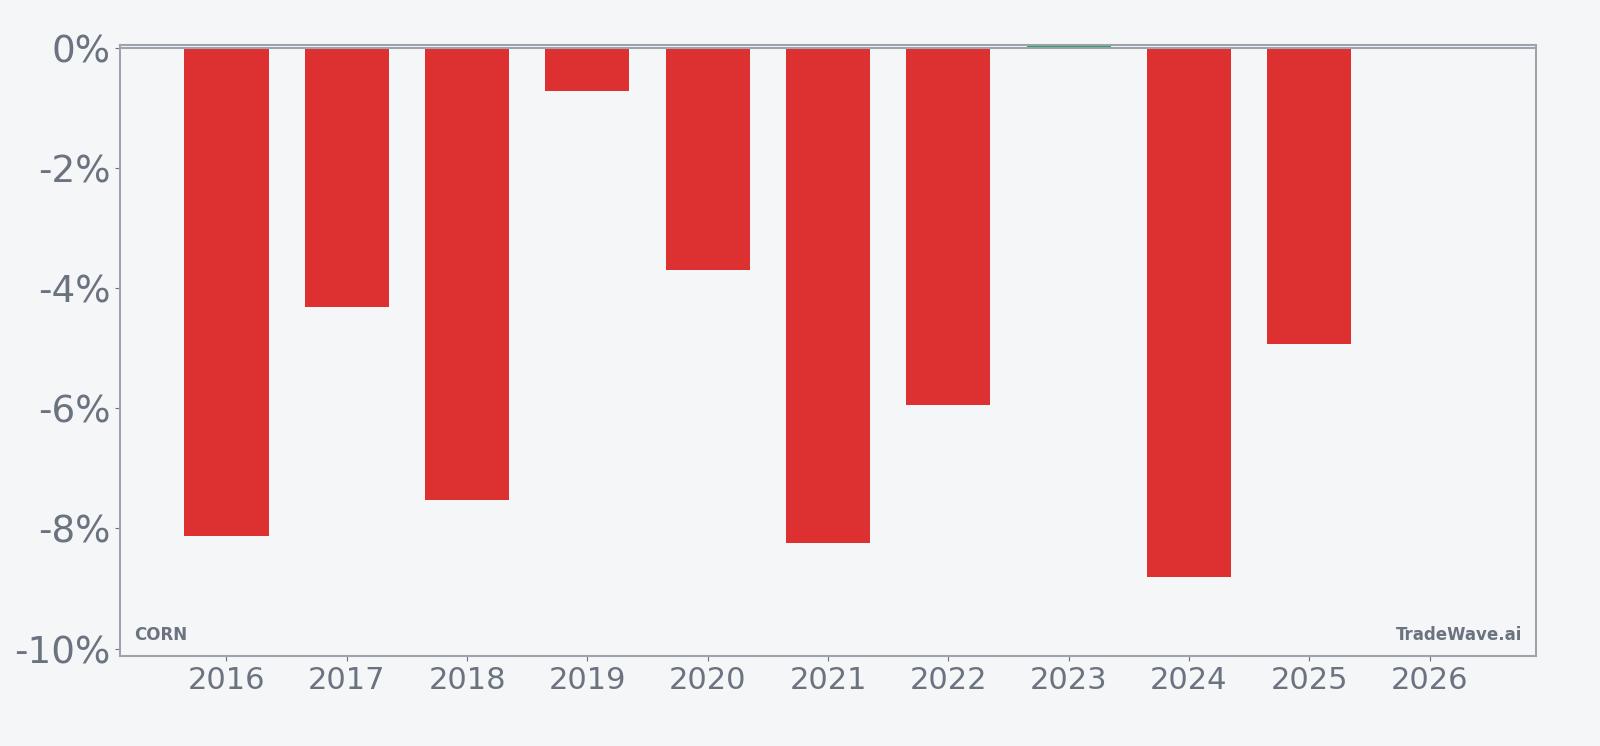
CORN has fallen in 9 of 10 years during this early-June 23-day window, with an average 5.81% gain in winning years for short positions.
- 9 for 10 in this window, with short trades averaging 5.81% gains in winning years over the past decade.
- The 23-day seasonal window begins Jun 6 and has historically favored downside moves in CORN rather than rallies.
- Percent Profitable sits at 90%, with 9 winning years for shorts and just 1 losing year across the sample.
- Avg Profit - All, which includes the lone losing year, is still a solid 5%, pointing to a persistent bearish seasonal bias.
- Intraperiod swings have been meaningful, with years showing both sharp favorable drops and sizable adverse bounces before the move plays out.
- For traders watching the CORN seasonal trend, this window has historically been one of the ETF’s most reliable short-side stretches on the calendar.
According to historical data from TradeWave.ai, this upcoming June stretch in CORN behaves very differently from an average month on the calendar. The next section walks through how that pattern has played out over the past decade and what it means for traders tracking the ETF’s seasonal behavior.
How has CORN (CORN) traded in the upcoming June seasonal window?
CORN has delivered profitable short-side results in 9 of the past 10 years during the 23 trading days starting Jun 6, with average gains of 5.81% in winning years. Today the ETF closed at 18.02, down 0.9% on the session and sitting about 5.8% below its 52-week high of 19.13 while holding roughly 8.5% above its 52-week low of 16.61.
Trade direction for this pattern is explicitly short, which means the historical “wins” are years when CORN finished the window lower than it started. Across the decade, the ETF has produced a 65% cumulative return for short positions in this slice of the calendar, translating to a 5.19% annualized return and a Sharpe ratio of 1.6 for the end-of-window outcomes. The median profit for shorts is 5.44%, which lines up closely with the 5.81% average gain in winning years and suggests the typical payoff has not been skewed by a single outlier.
The lone losing year in the sample still saw CORN move, just not in favor of the short. In 2019, for example, the ETF finished the window down only 0.72% from entry, but at one point during the stretch it had rallied as much as 5.98% before rolling back over. That kind of path is a reminder that even in a bearish seasonal window, intraperiod bounces can be sharp enough to challenge risk limits before the broader pattern reasserts itself.
On the downside, several years have featured deep adverse moves for longs that translated into strong gains for shorts. In 2016, CORN dropped 8.12% over the window with a worst intraperiod drawdown of 10.06% from the entry level, while 2024 saw a 8.81% net decline and a 10.21% worst drawdown. Those episodes illustrate how the maximum favorable excursion for shorts and the maximum adverse excursion for longs have often expanded well beyond the final close-to-close result.
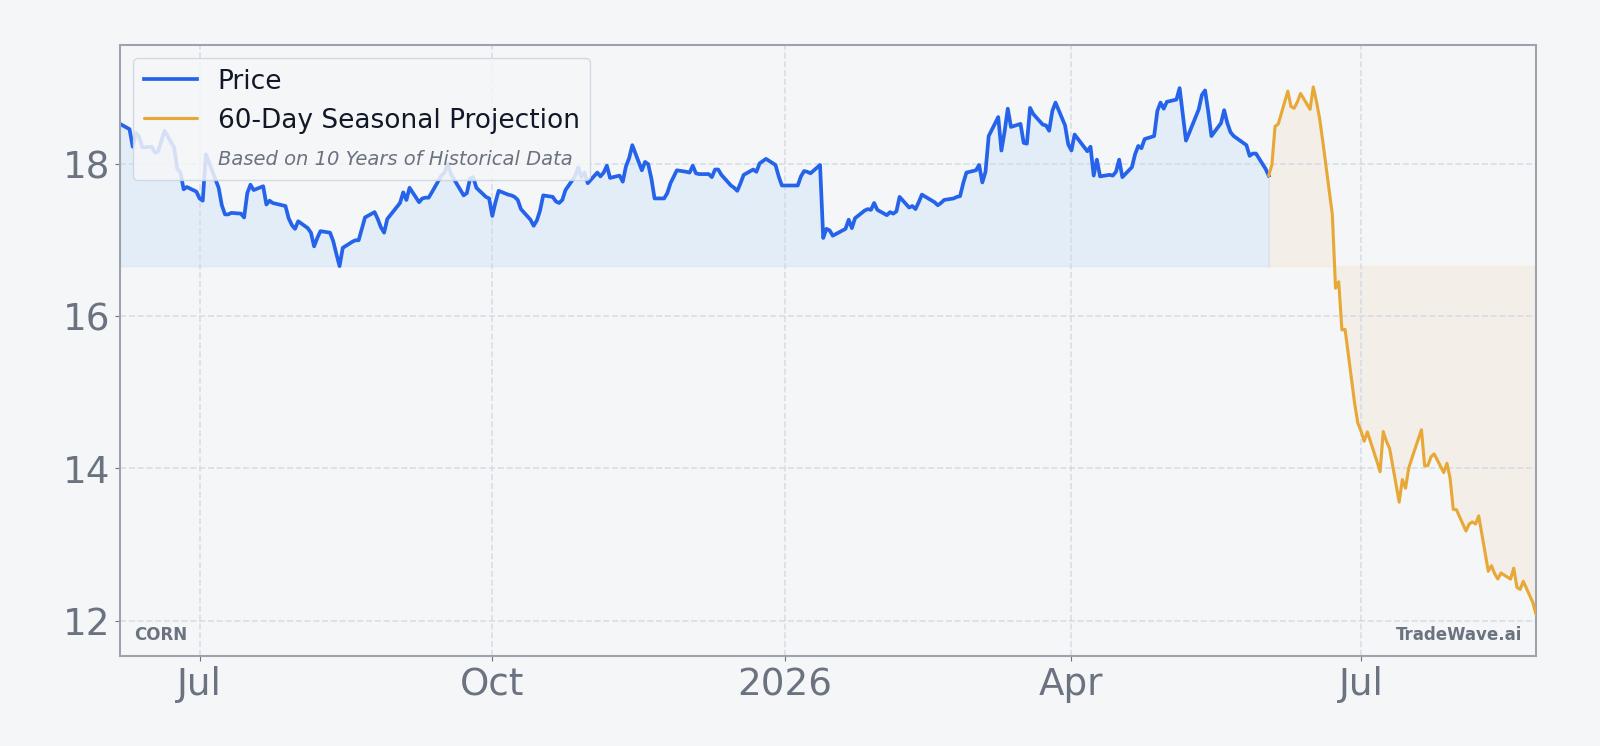
The typical shape of the CORN seasonal trend in this window is a grind lower rather than a single air pocket. The 10-year average path shows pressure building early in the period, with weakness tending to accumulate across the full 23 days instead of clustering in just one or two sessions. That profile fits with a market that reprices corn exposure as new crop conditions and acreage expectations firm up into early summer.
A stacked view of yearly net returns alongside peak favorable and worst adverse moves shows how often this window has rewarded shorts while still delivering sizable swings.
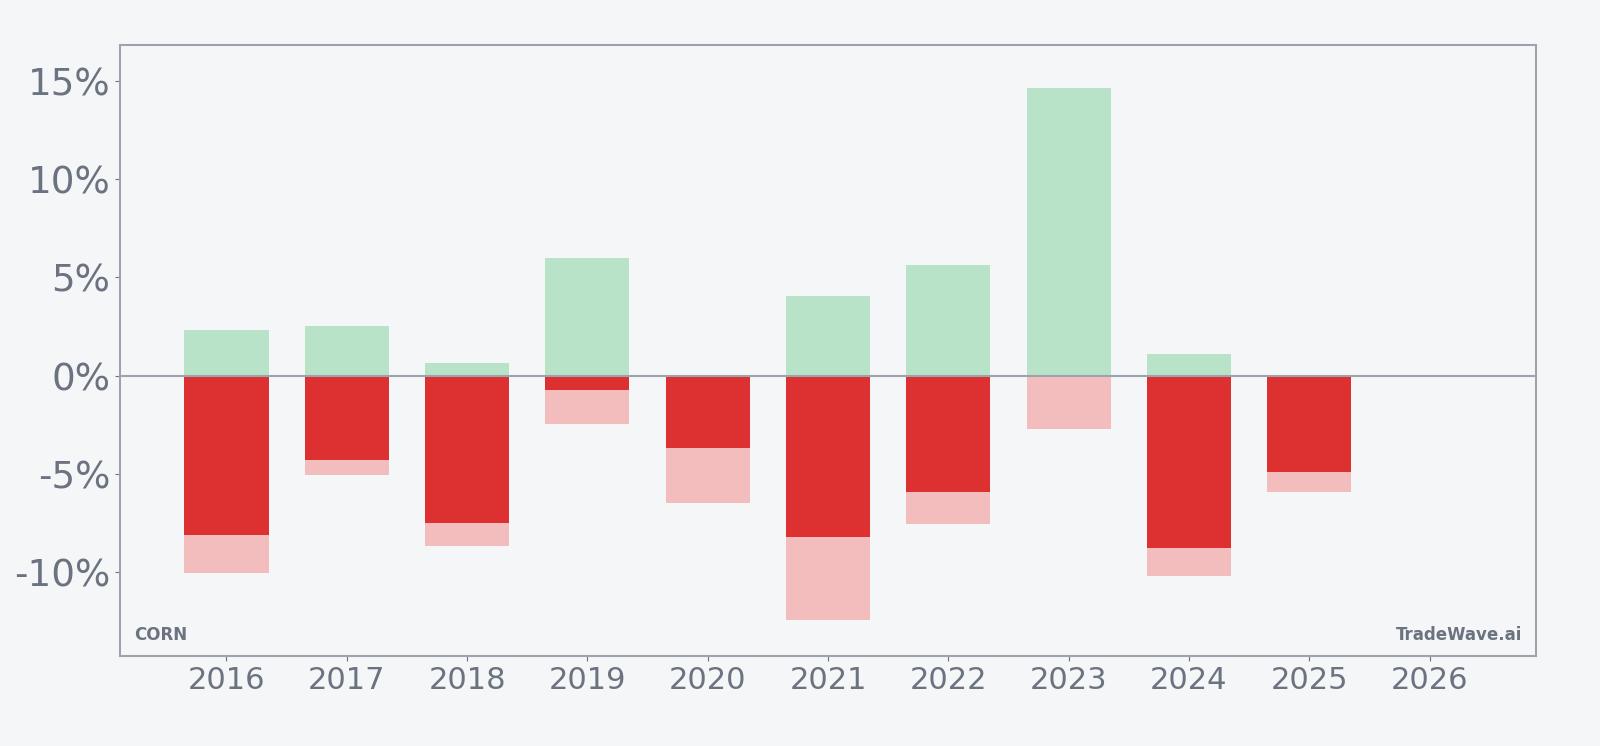
Across the decade, the pattern is clear: this early-June window has favored short exposure in 9 of 10 years, with consistent mid-single-digit gains for winning trades and enough intraperiod movement to matter for risk management.
Why does CORN (CORN) follow this seasonal pattern?
One likely driver is the crop calendar that underpins the corn market itself. By early June, U.S. planting progress, weather trends and acreage estimates are usually well known, which can shift attention from planting risk toward yield and supply expectations that often pressure prices. Analysts have also pointed to hedging flows from producers and rebalancing in grain-focused portfolios around this time, both of which can lean against CORN and help explain why this specific trading window has historically skewed bearish for the ETF.
History does not guarantee future results; adverse excursions can be large even in winning windows, so traders using this pattern still face meaningful downside risk if the market behaves differently this year.
What is driving CORN (CORN) today?
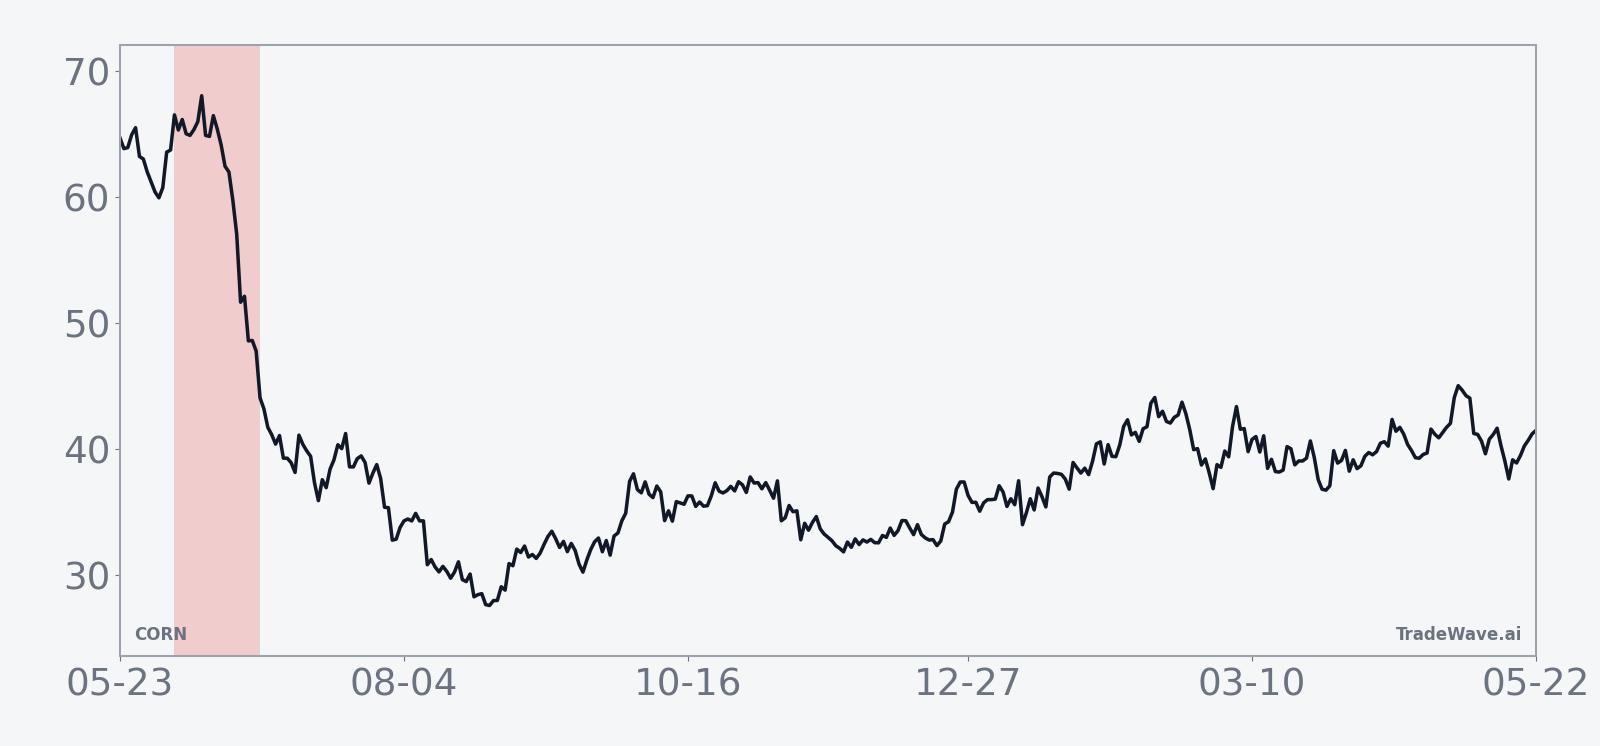
CORN slipped 0.9% to 18.02 on Thursday, trading between 18.00 and 18.18 on the day and closing with volume of about 879,000 shares against a 20-day average near 683,000. The ETF, which tracks front-month corn futures exposure, is sitting roughly 5.8% below its 52-week high of 19.13 and about 8.5% above its 52-week low of 16.61, with price also modestly under its 50-day moving average of 18.41, a sign that the near-term trend has softened after a recent bounce.
The chart below situates the latest move in its recent multi-month context and overlays the upcoming seasonal projection.
Flows data for CORN in the research window are limited, but the trading pattern fits a familiar grain ETF script: liquidity tends to build into the U.S. growing season as weather risk and yield expectations dominate positioning. With the ETF already backing off from its recent highs and trading below its 50-day moving average, the upcoming early-June seasonal window arrives against a backdrop of cautious price action rather than a runaway rally.
For investors using CORN as a proxy for corn prices in broader portfolios, the key takeaway is that this ETF’s seasonal outlook into June has historically leaned bearish even when the fundamental narrative felt balanced. The historical seasonality does not override supply-and-demand shocks or surprise weather events, but it does suggest that this particular slice of the calendar has often coincided with pressure on corn exposure rather than relief rallies.
What should traders watch as CORN enters this seasonal window?
First, watch how CORN behaves as Jun 6 approaches relative to its 50-day moving average near 18.41 and the recent 52-week band between 16.61 and 19.13. A decisive break lower into the window would align with the historical pattern, while a squeeze back toward the highs would mark a clear divergence from the usual CORN trading window behavior.
Second, monitor volume and liquidity in the ETF as the window opens. The historical pattern has delivered meaningful moves over just 23 trading days, so a pickup in trading activity could signal that futures markets and ETF investors are leaning into the same early-summer corn seasonal trend. Conversely, a quiet tape with muted volume would suggest that other macro forces are dominating the grain complex this year.
Third, keep an eye on how closely CORN tracks its underlying corn futures benchmark through this period. Tracking differences can widen around roll dates or in volatile markets, and the seasonal pattern is based on the ETF’s own price history, not the futures curve in isolation. If futures sell off but CORN lags, or vice versa, that gap will matter for anyone trying to use the historical seasonality as a guide.
Finally, the most important confirmation or contradiction will come from the path of returns inside the window itself. A steady grind lower with occasional bounces would echo the 10-year seasonal trend, while a sustained rally through the 23-day stretch would mark only the second losing year for shorts in this sample and signal that the CORN seasonal trend may be shifting. Either way, the early-June window has a track record of producing moves that are large enough to matter for traders who care about timing their exposure to the corn market.
Sources
About this seasonal analysis
Seasonal pattern data is sourced from TradeWave.ai, which analyzes historical price behavior across annual calendar windows going back up to 30 years. Read the full data methodology or the book The 100-Year Pattern by Afshin Moshrefi (2026 edition). Past performance of seasonal patterns does not guarantee future results. This article is for informational purposes only and does not constitute investment advice.