DB Agriculture Fund Invesco (DBA) Has Dropped in 10 of 10 Early-June Windows for Shorts
DB Agriculture Fund Invesco is trading just below its 52-week high as it approaches a 21-day early-June window that has historically favored short positions, setting up a tension between bullish crop-year hopes and a decade of bearish seasonality.
What is the seasonal pattern for DB Agriculture Fund Invesco (DBA)?
DB Agriculture Fund Invesco has fallen in 10 of 10 years during this early-June 21-day window, with an average gain of 3.96% for traders positioned short in winning years.
- 10 for 10 in this window, with an average 3.96% profit in winning years for short positions over the past decade.
- The 21-day seasonal window begins on Jun 8 and has historically been a bearish stretch for DBA prices.
- Percent Profitable is 100%, with 10 winners and 0 losers for the short-side pattern across the 10-year lookback.
- The TradeWave Ratio is 1.9, indicating DBA typically travels meaningfully in the trade direction within the window before it closes.
- The Sharpe ratio of 1.8 points to strong risk-adjusted returns for the historical short setup in this specific slice of the calendar.
- Intraperiod swings have still been sizable in some years, with adverse moves against the short side before prices ultimately finished lower.
According to historical data from TradeWave.ai, this early-June stretch has behaved very differently from an average month for DBA, and the next iteration is about to open again.
How has DB Agriculture Fund Invesco (DBA) traded in this early-June window?
DB Agriculture Fund Invesco has declined in every single early-June 21-day window over the past 10 years, with the short-side pattern averaging a 3.96% profit. The next window begins on Jun 8, with DBA last changing hands at 27.46, about 4.8% below its 52-week high of 28.84 and still near the top of its one-year range.[5]
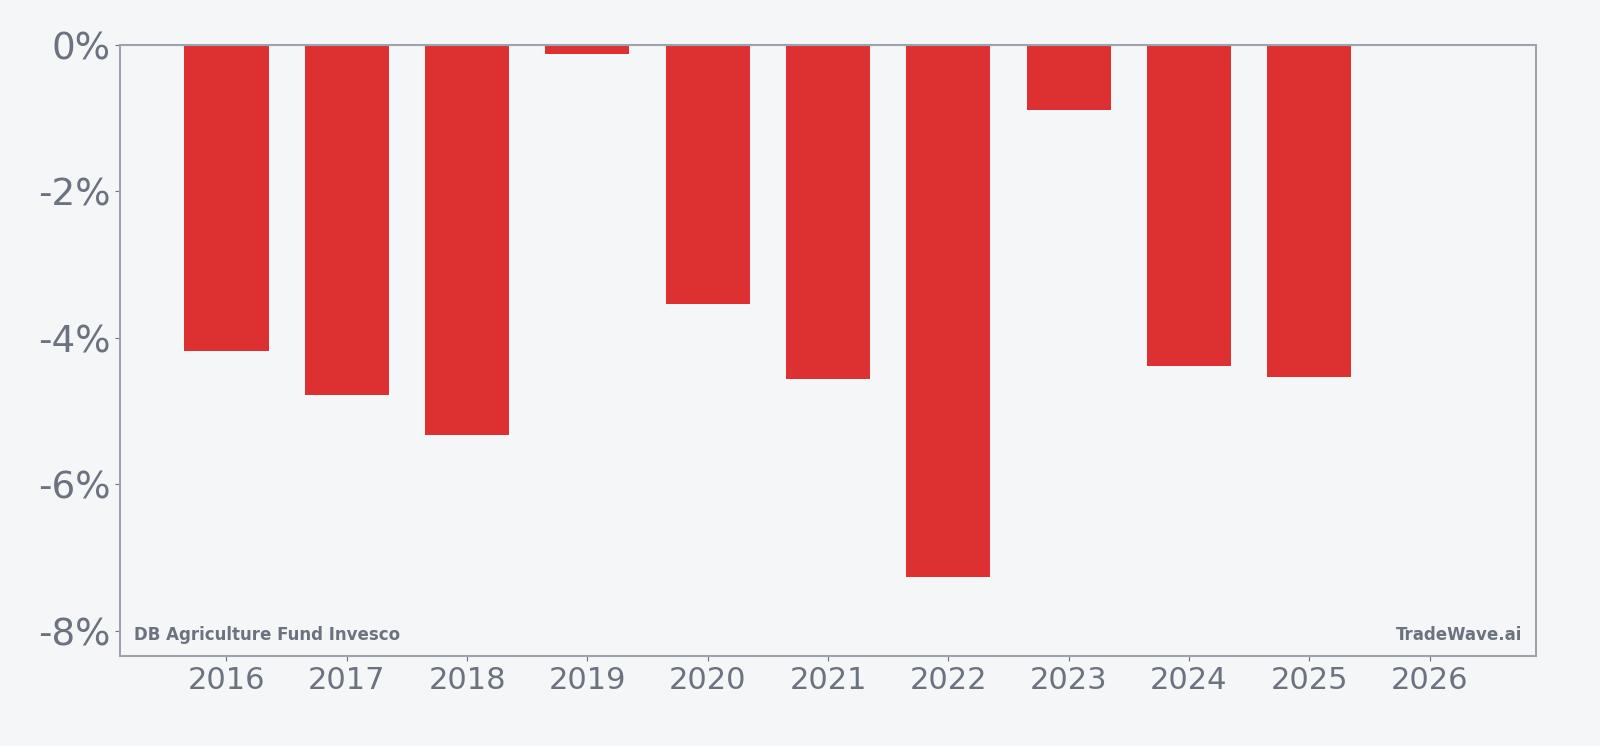
Across the 10-year sample, every iteration of this DBA seasonal trend has finished with the ETF lower over the 21-day span, which is why the pattern is classified as a short-direction trade. The strongest year for the setup was 2022, when DBA fell 7.26% from entry to exit during the window, while the softest outcome was 2019, when the net move was a marginal 0.12% decline. Even in quieter years like 2019 and 2023, the pattern still ended with prices slightly below where they started.
The average winner profit of 3.96% lines up closely with the 4% all-years average, since there were no losing years in the sample. That consistency is unusual for a commodity-linked ETF, where weather, geopolitics and positioning can easily scramble short-term patterns. A Sharpe ratio of 1.8 for this window suggests that, historically, the risk-adjusted payoff for traders leaning short during this slice of the calendar has been strong compared with many other 3-week stretches.
The historical seasonal average shows DBA prices tending to drift lower fairly steadily through the 21 days rather than collapsing in a single air pocket. In several years, including 2016, 2017 and 2021, the ETF saw modest early strength before rolling over, which fits a pattern where initial optimism around the crop year or macro headlines gives way to selling pressure as the window progresses.
A combined view of yearly net returns and intraperiod swings shows how far DBA has typically moved in both favorable and adverse directions during this window.
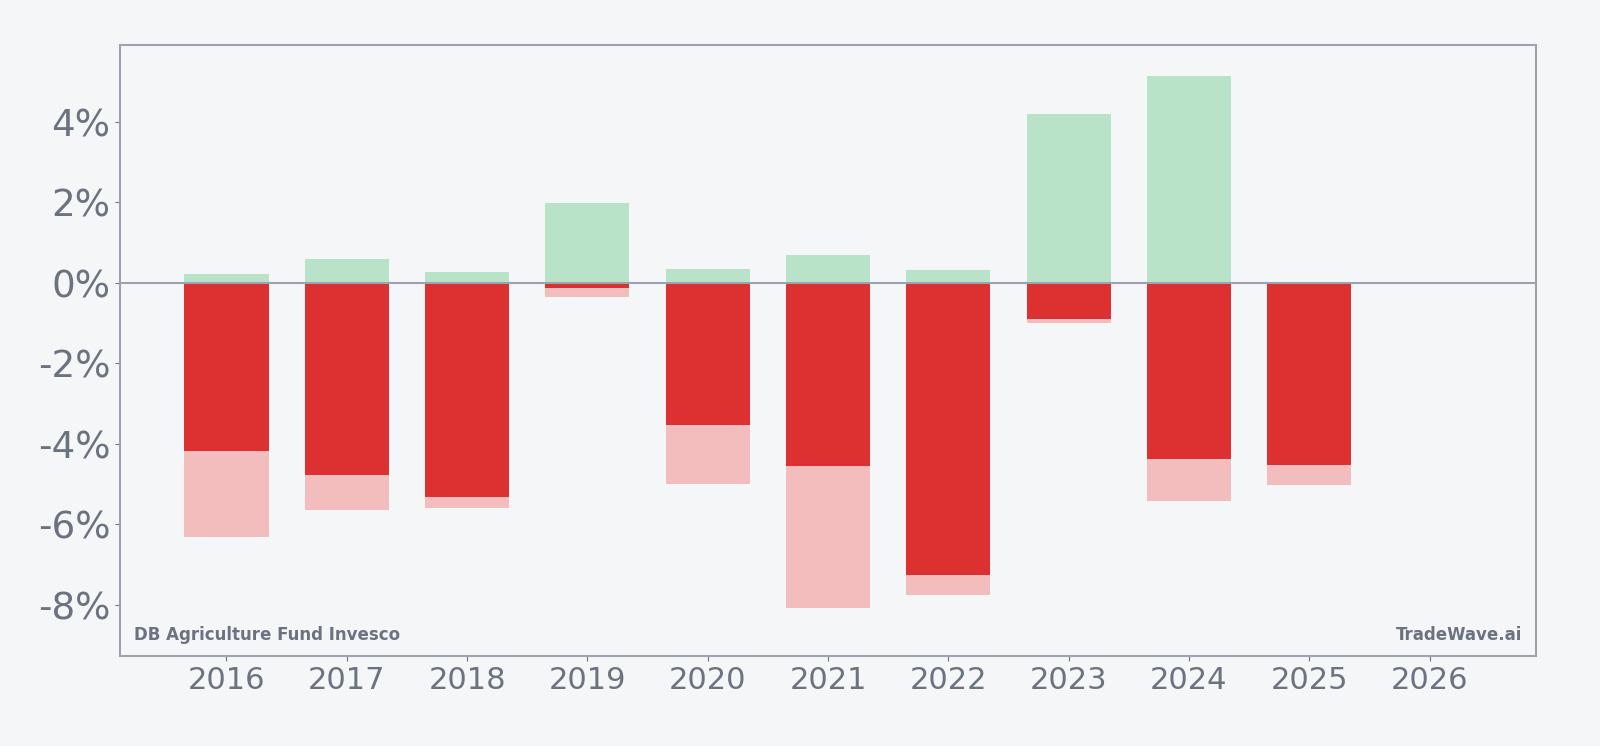
The maximum favorable move in many years has been modest, often under 1% in the direction of the short, while the maximum adverse move has at times been deeper, with drawdowns against the short position reaching more than 6% in 2016 and over 7% in 2022. That MAE profile means traders who lean into this historical seasonality have needed to tolerate meaningful countertrend rallies before the pattern ultimately resolved lower. Add it up: 10 straight down windows for DBA prices, but with enough intraperiod noise that risk management has mattered as much as the edge itself.
History does not guarantee future results, and adverse excursions within the window can be large even when the final outcome has favored the short side.
Why does DB Agriculture Fund Invesco (DBA) follow this seasonal pattern?
One likely driver is the way crop-year expectations and hedging flows cluster around early summer, when planting progress, weather models and early yield estimates start to firm up. Analysts have pointed to a tendency for optimism on grains and oilseeds to build into late spring, followed by position adjustments as more concrete information arrives, which can pressure broad agriculture baskets like DBA.[1] The pattern may also reflect institutional portfolio rebalancing and commodity index roll activity that tends to occur around this point in the calendar, creating a recurring supply of futures selling that filters into the ETF.
What is driving DB Agriculture Fund Invesco (DBA) today?
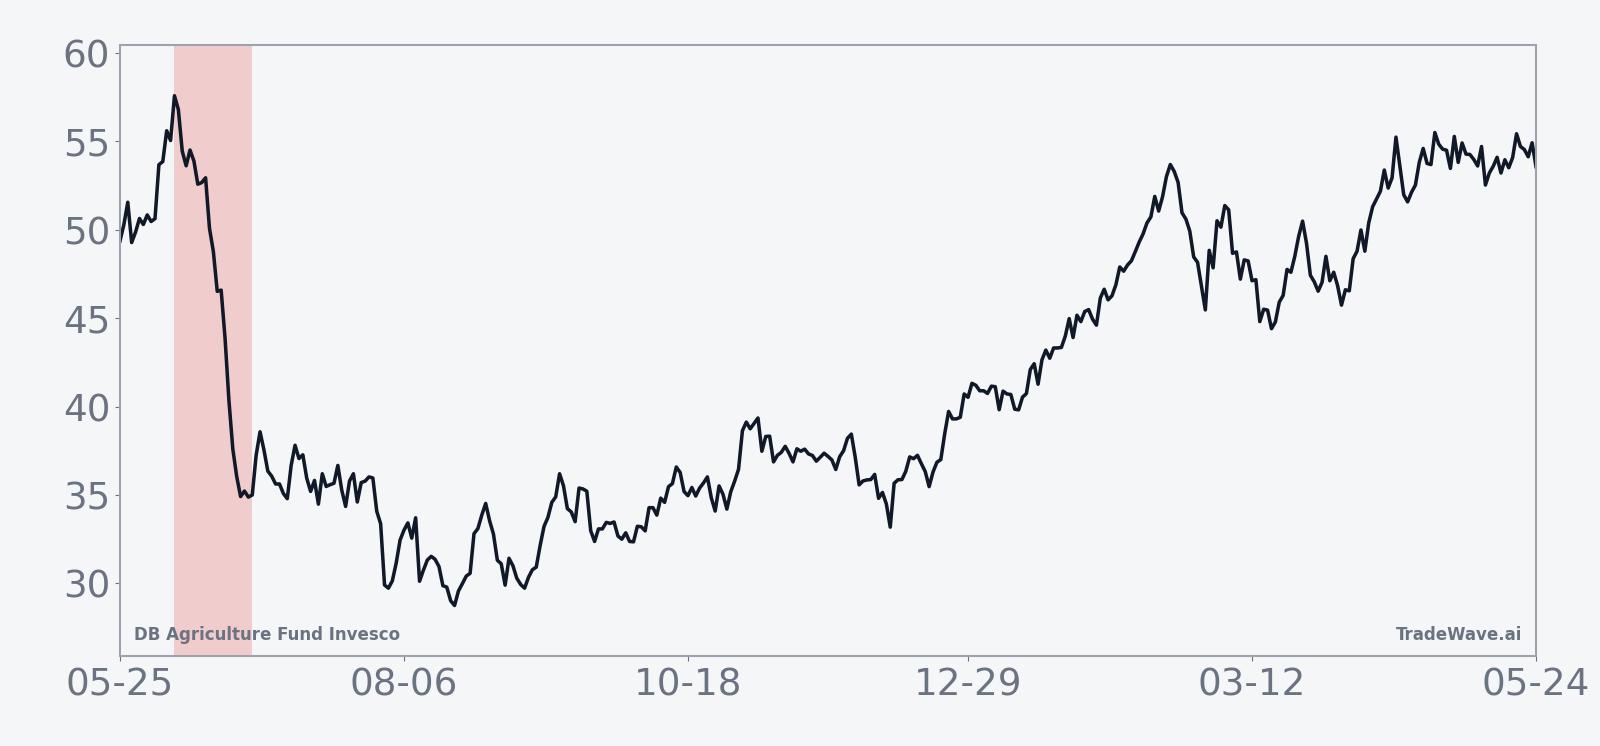
DB Agriculture Fund Invesco slipped 0.04% to 27.46 on Wednesday, holding just below its 52-week high of 28.84 and well above its 52-week low near 23.80, with roughly 1.22 million shares changing hands versus a 20-day average volume of about 1.69 million.[5] The ETF, which bundles futures exposure to grains, oilseeds, animal proteins and soft commodities, has been a popular way for investors to express a broad agriculture view into the 2026 crop year, where analysts see room for recovery from multi-year lows in several contracts as production costs, demand and weather risks intersect.[1]
In February 2026, one Seeking Alpha analysis argued that DBA was positioned for gains as grains, oilseeds and oilseed products worked off a long slump, with inflation-driven input costs and resilient demand setting a constructive backdrop for agriculture prices over the medium term.[1] That bullish case has been echoed in broader macro commentary around fertilizer and energy markets, where elevated risk in the Strait of Hormuz has been cited as a second-order upside driver for agriculture and fertilizer-linked assets, with DBA flagged as a liquid vehicle for that theme.[5]
DBA’s structure means it does not track a single benchmark index in the way an equity ETF might, but instead reflects a rules-based basket of agriculture futures that rolls exposure over time. In November 2025, an earlier update on the fund highlighted its diversified allocation across grains, oilseeds, livestock and softs, along with the impact of roll yields and contract selection on tracking versus spot commodity prices.[3] For investors, that makes DBA less about perfectly mirroring any one crop and more about capturing the sector’s overall seasonal outlook and volatility.
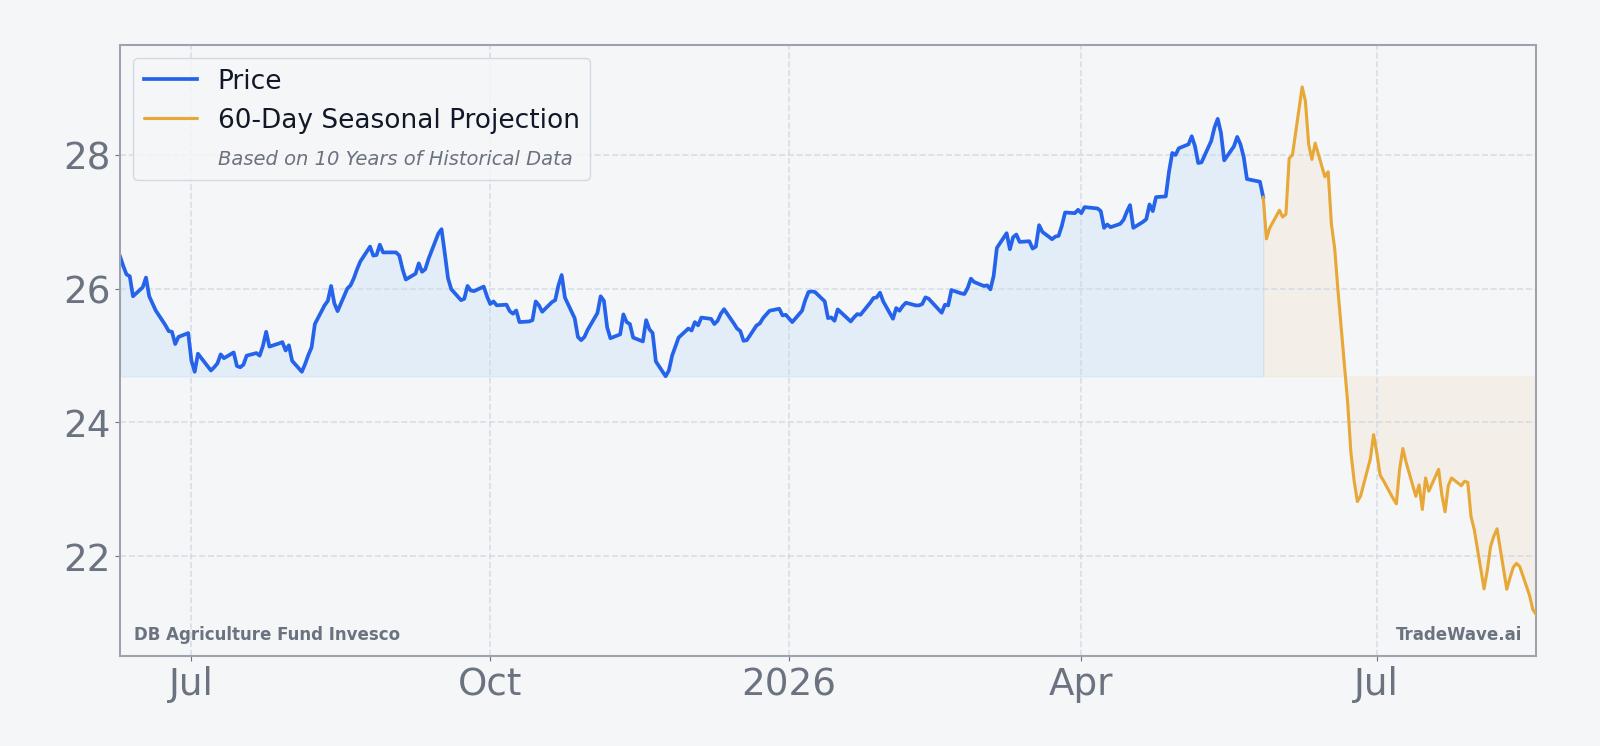
The chart below situates the latest move in its recent multi-month context and overlays a 60-day seasonal projection.
From a flows perspective, detailed ETF creation and redemption data for DBA has been quieter in public commentary this spring, but related research on the no-K-1 PDBA fund in late April 2026 pointed to renewed investor interest in agriculture exposure as a portfolio diversifier.[5] That piece framed DBA and its sibling products as tools for investors looking to hedge inflation risk or bet on a rebound in crop prices after a period of underperformance versus energy and industrial commodities.
Macro drivers remain front and center. Analysts tracking the 2026 crop year have emphasized the combination of rising fertilizer prices, potential supply shortages and weather uncertainty as reasons why agriculture markets could see sharper swings in the months ahead.[1] At the same time, geopolitical tension around key shipping lanes such as the Strait of Hormuz has been flagged as a wildcard for input costs and logistics, which can ripple through to food prices and the performance of agriculture baskets like DBA.[5]
What should traders watch as this DBA seasonal window approaches?
With DBA trading near the upper end of its one-year range and a decade-long pattern of early-June weakness on the calendar, the next few weeks set up as a test of whether historical seasonality or the bullish crop-year narrative has the upper hand. The first checkpoint is the window’s opening on Jun 8: in prior years, DBA has often seen a brief period of stability or even mild strength before rolling over, so traders will be watching whether any early rallies fade or extend. Price action around the 28 to 29 area, close to the 52-week high, will be important for gauging whether supply emerges in line with the historical DBA seasonal trend.[5]
Macro catalysts could either reinforce or overwhelm the pattern. Key items include updated weather forecasts for major growing regions, any escalation or easing of shipping and energy tensions that affect fertilizer and fuel costs, and fresh demand signals from importers. If those headlines line up with the historical tendency for DBA to soften in this 21-day trading window, it would mark an eleventh straight year where the early-June seasonal pattern has leaned in favor of short exposure. A sustained break higher through the recent range, by contrast, would be a clear departure from the past decade’s behavior and a sign that structural demand or supply shocks are rewriting the playbook.
Flows will also matter. While granular creation and redemption data has not been front-page news, any surge in assets under management for DBA or related agriculture ETFs would hint at renewed institutional interest in the theme, which could either amplify downside volatility if those positions are later unwound or cushion pullbacks if buyers step in on dips.[1] For traders who track seasonality closely, the key tell will be whether intraperiod rallies during the window remain contained, as they have historically, or whether adverse moves against the short side start to stretch beyond the typical MAE profile seen in prior years.
Sources
- [1] Seeking Alpha – “The Case For The Agricultural DBA ETF (NYSEARCA:DBA)” (Feb 25, 2026)
- [3] Seeking Alpha – “The Prospects For Agricultural Commodities And The DBA ETF: November Update (DBA)” (Nov 24, 2025)
- [4] Seeking Alpha – “Agricultural Commodities And The DBA ETF (NYSEARCA:DBA)” (Aug 28, 2025)
- [5] Seeking Alpha – “The Case For Agriculture Exposure Through The No-K1 PDBA ETF (NASDAQ:PDBA)” (Apr 30, 2026)
About this seasonal analysis
Seasonal pattern data is sourced from TradeWave.ai, which analyzes historical price behavior across annual calendar windows going back up to 30 years. Read the full data methodology or the book The 100-Year Pattern by Afshin Moshrefi (2026 edition). Past performance of seasonal patterns does not guarantee future results. This article is for informational purposes only and does not constitute investment advice.