CORN Slips Toward 52-Week Low After 9 Losses in Last 10 Junes
CORN is sliding toward the lower end of its 52-week range just as a 23-day June trading window with a long bearish track record comes back onto the calendar.
What is the seasonal pattern for CORN (CORN)?
CORN has fallen in 9 of 10 years during this early-June 23-day window, with an average loss of 5.81% in winning years for the short setup.
- 9 for 10 in this window, with the short side averaging 5.81% gains in winning years over the past decade.
- The 23-day seasonal window begins Jun 6 and has historically been a bearish stretch for CORN.
- Percent Profitable is 90%, with 9 winning years for shorts and just 1 losing year across the sample.
- Including every year, Avg Profit - All comes in at 5%, showing that down years for CORN have outweighed the lone up year.
- Intraperiod swings have been meaningful, with several years showing double-digit peak drawdowns before the window closed.
- The pattern is classified as Trade Direction: Short, aligning the historical bias with downside moves in the ETF.
According to historical data from TradeWave.ai, this early-summer stretch in CORN has behaved very differently from an average month on the calendar. The next section walks through how that pattern has played out over the past decade and what it means for the upcoming window.
Seasonal window
CORN has delivered profitable short trades in 9 of the past 10 years during the 23 trading days starting around Jun 6, with average gains of 5.81% in those winning years. The ETF last closed at 17.70, down 1.1% on the day and sitting closer to its 52-week low at 16.61 than its 52-week high at 19.13.[1] That combination of a historically weak June window and a price already leaning toward the bottom of its recent range makes this seasonal regime hard for grain traders to ignore.
Historically, this early-June CORN trading window has been a clear short-biased pattern. Percent Profitable sits at 90%, with 9 winning years for the short side and only 1 losing year across the 10-year lookback. The average gain in those winning short years is 5.81%, while the all-years average, which includes the lone losing year, is still a solid 5% in favor of shorts.
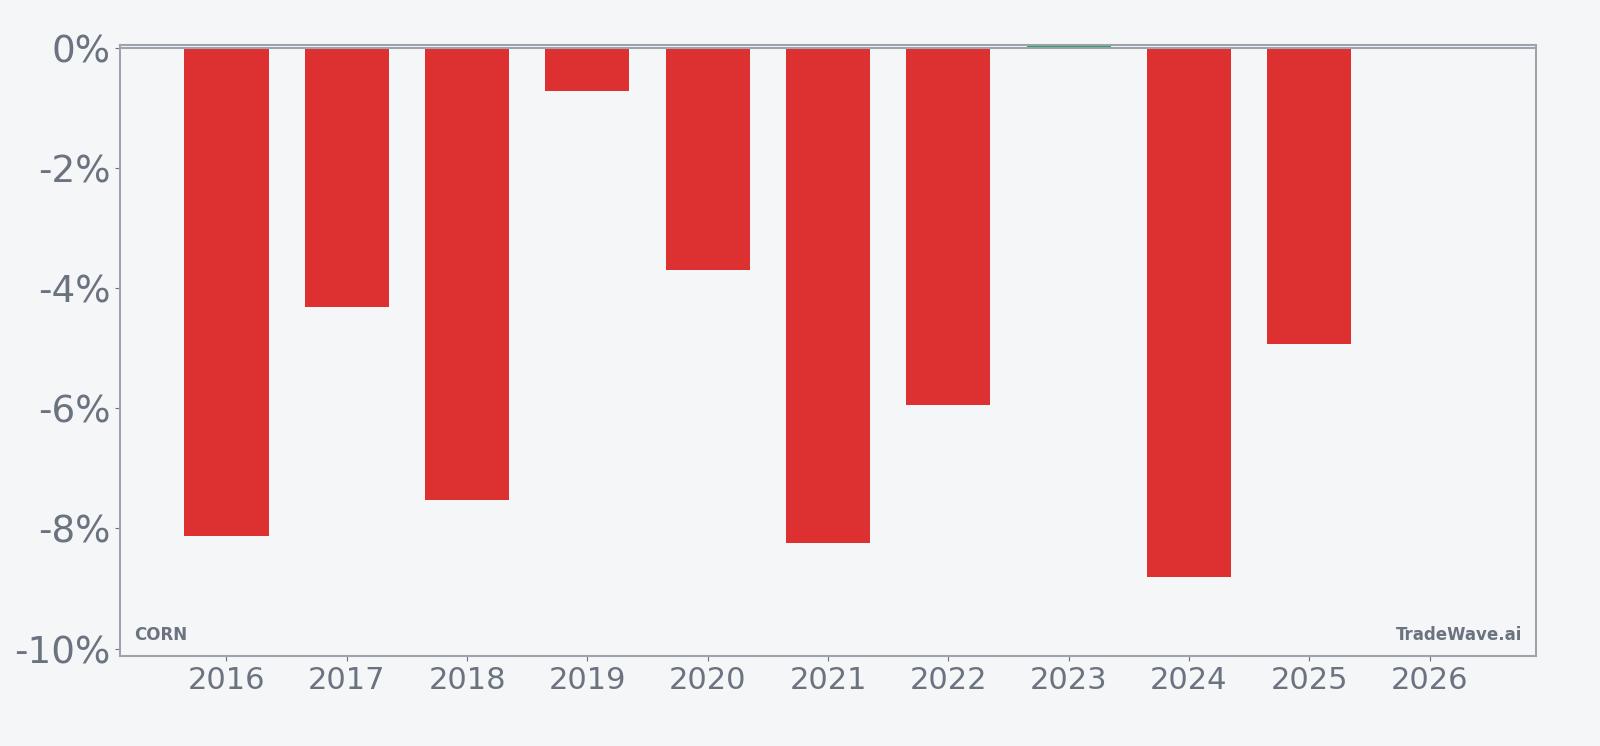
The per-year breakdown shows how consistent that downside bias has been. In 2016, the window delivered an 8.12% drop in CORN, while 2024 saw an 8.81% decline, both aligning with the short setup. The weakest year for the pattern was 2023, when CORN finished the window essentially flat with a 0.04% net move, despite a sharp intraperiod rally that briefly pushed the trade against shorts.
The historical seasonal average trend line slopes lower through most of the 23-day span, with the bulk of the move typically unfolding in the middle of the window. That suggests the pattern has not relied on a single gap or one-off shock, but rather on a steady grind lower as the days progress.
A combined view of net returns and intraperiod swings shows how far CORN has tended to move in both directions during this window.
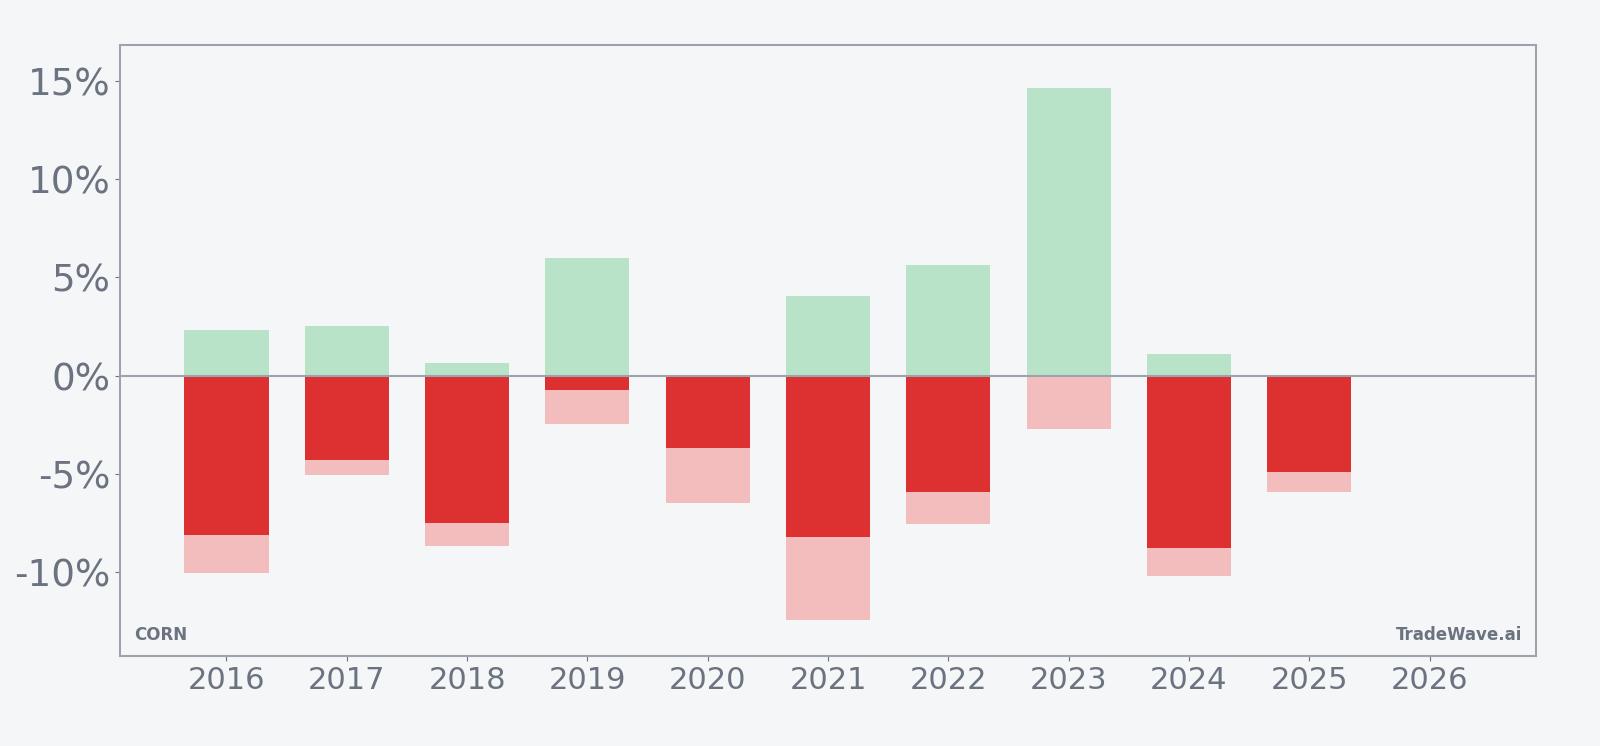
The maximum favorable excursion and maximum adverse excursion profile underlines that this has been a high-conviction but not low-volatility pattern. In several years, such as 2016 and 2024, the worst intraperiod drawdowns for shorts were around 10% before the trade moved back in their favor by the close of the window. In 2023, the best move against shorts was a 14.66% rally at one point, even though the final result was flat, showing that squeezes can be violent even when the seasonal tendency ultimately reasserts itself.
Put simply, the record is striking: 9 of 10 years have rewarded short exposure in this early-June CORN window, with meaningful average gains but also sizable swings along the way.
Why does CORN (CORN) follow this seasonal pattern?
This CORN seasonal trend likely reflects the grain market’s supply and demand calendar. Early summer is when U.S. corn crop conditions, planting progress, and weather risk become clearer, which can pressure prices if supply looks ample. Analysts often point to this period as one where optimism about yields collides with still-muted demand data, creating a tendency for corn-related instruments to soften as expectations reset.
History does not guarantee future results; adverse excursions (MAE) can be large even in winning windows.
What is driving CORN (CORN) today?
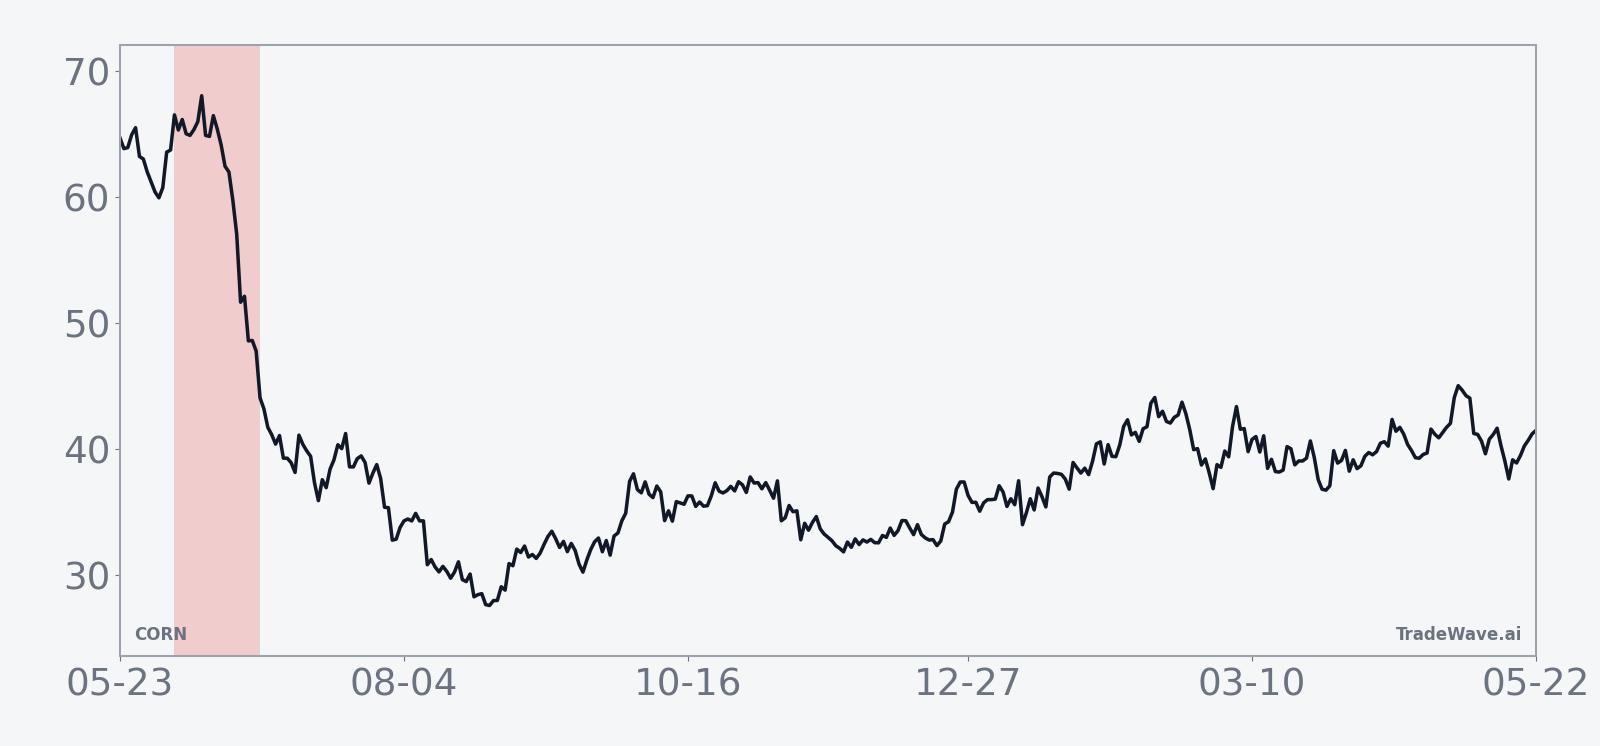
CORN slipped 1.1% to 17.70 on Jun 3, extending a one-month decline of 7.37% and leaving the ETF about 5.0% below its 52-week high of 19.13 and roughly 6.6% above its 52-week low of 16.61.[1] Trading volume of about 437,000 shares came in below the 20-day average of roughly 633,500, and the fund now sits under its 50-day moving average at 18.35, reinforcing a short-term downtrend on the chart.[1]
The chart below situates the latest move in its recent multi-month context and overlays a 60-day seasonal projection.
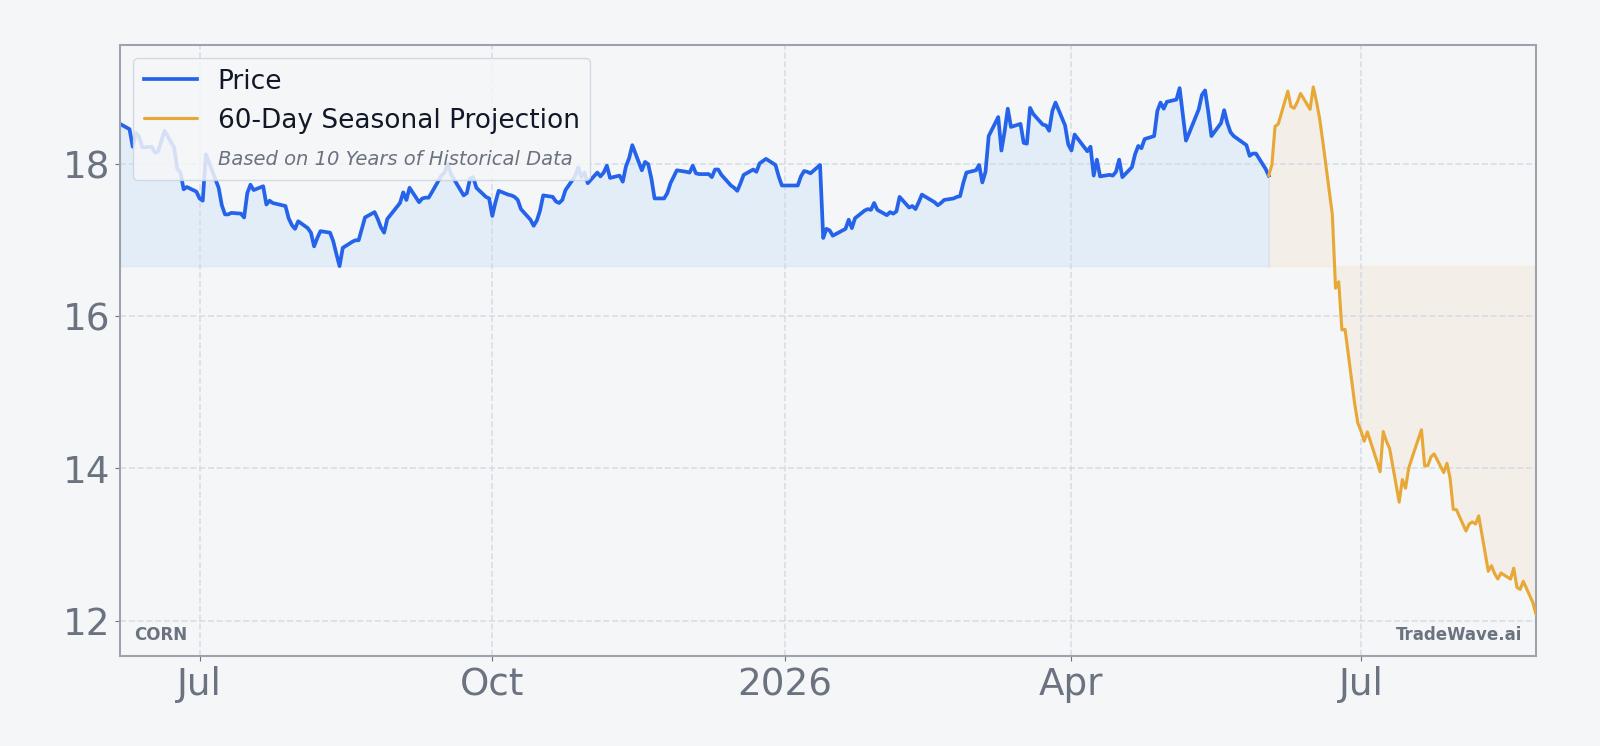
Structurally, CORN is designed to give investors exposure to corn futures, so its performance is tightly linked to expectations for crop yields, global feed demand, and biofuel usage. The ETF’s recent slide has tracked softer corn prices as markets weigh solid planting progress against uncertain demand from livestock producers and ethanol refiners. With the fund already trading below its 50-day moving average and closer to the bottom of its 12-month range, the upcoming seasonal window arrives against a backdrop of existing weakness rather than strength.
For investors using CORN as a proxy for agricultural inflation or as a tactical trading vehicle, the key tension is between that ongoing downtrend and the potential for weather or policy surprises. Any shift in U.S. weather patterns, export restrictions from key producers, or changes in biofuel mandates could quickly alter the supply-demand balance. Against that macro backdrop, the historical seasonality does not predict an outcome, but it does show that this specific slice of the calendar has often coincided with meaningful moves in the same direction the ETF is already leaning.
What should traders watch in this CORN seasonal window?
As the 23-day early-June window opens, the first thing to watch is whether CORN continues to respect the 50-day moving average as resistance. Sustained trading below that line while the ETF drifts toward the 52-week low would be consistent with the historical pattern of weakness in this seasonal stretch.[1]
Second, intraday volatility will matter as much as closing prices. Past years have shown that even successful short windows can feature sharp countertrend rallies, with maximum adverse excursions for shorts reaching double digits before the trade ultimately worked. If CORN stages fast squeezes that fade rather than stick, that would echo the historical MFE and MAE profile for this window.
Third, traders should track how closely CORN’s behavior lines up with developments in the underlying corn futures market. Strong crop condition reports, benign weather forecasts, or signs of soft export demand would all fit the historical script of pressure on corn-linked instruments in early summer. Conversely, a sudden weather scare or supply shock that drives futures higher and pushes CORN back above its 50-day moving average would mark a clear break from the usual seasonal script.
Finally, the most telling signal will be how CORN trades into the back half of the 23-day span. In prior years, the bulk of the move has often unfolded after the first week of the window, as more data on crop progress and demand filters through. If the ETF is still hovering near current levels by mid-window, traders may want to pay extra attention to whether the familiar late-window acceleration shows up again or whether this is the year the pattern fails to repeat.
Sources
About this seasonal analysis
Seasonal pattern data is sourced from TradeWave.ai, which analyzes historical price behavior across annual calendar windows going back up to 30 years. Read the full data methodology or the book The 100-Year Pattern by Afshin Moshrefi (2026 edition). Past performance of seasonal patterns does not guarantee future results. This article is for informational purposes only and does not constitute investment advice.