Six-for-Six: Nasdaq QQQ Invesco ETF (QQQ) Has Gained in Every Midterm Window Since 2002
Nasdaq QQQ Invesco ETF is trading just shy of a fresh 52-week high as it approaches a midterm-year seasonal window that has delivered double-digit gains in every prior cycle.
What is the seasonal pattern for Nasdaq QQQ Invesco ETF (QQQ)?
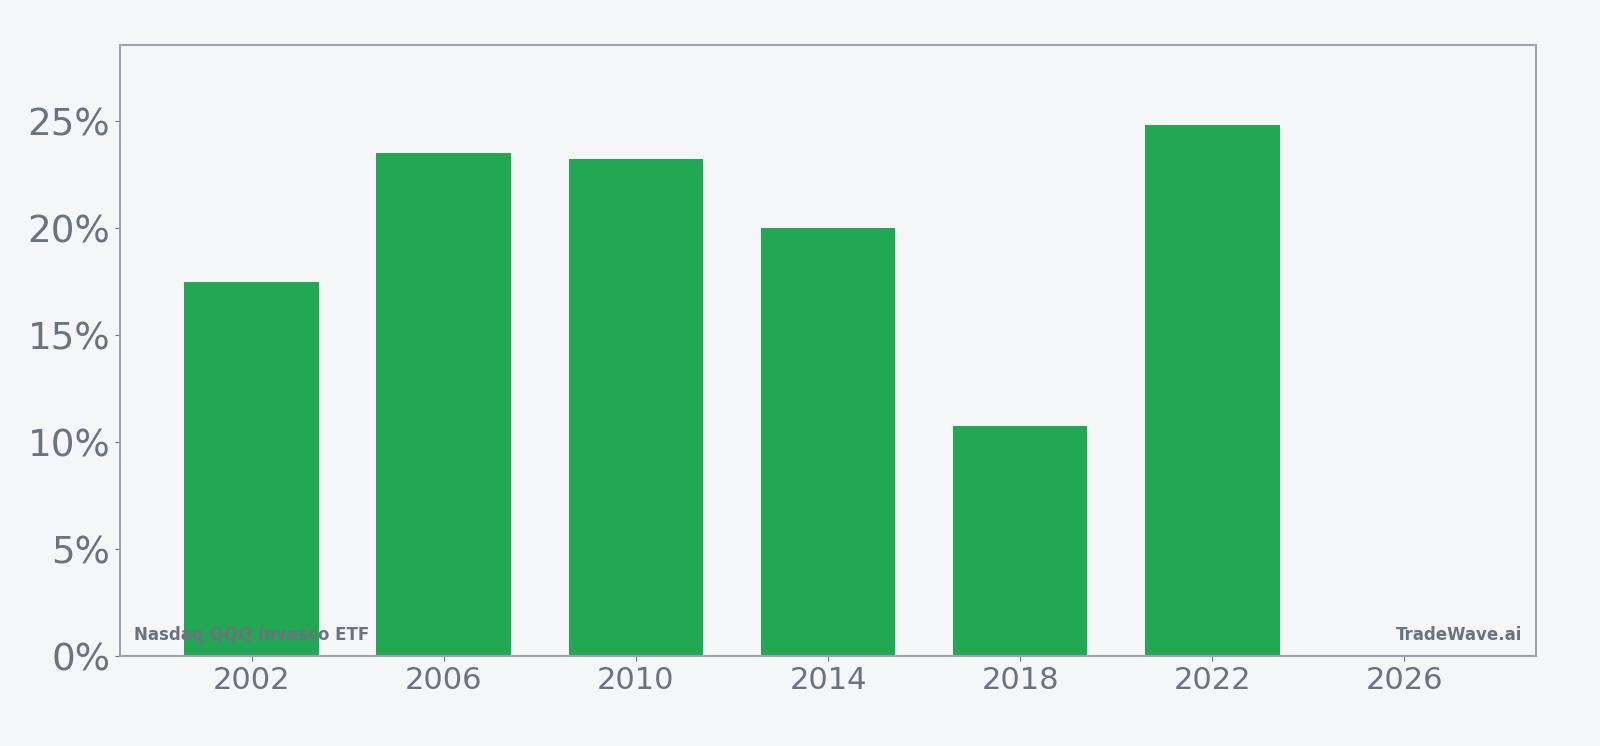
Nasdaq QQQ Invesco ETF has risen in 6 of 6 midterm-election-year windows since 2002, with an average gain of 19.97% in winning years.
- 6 for 6 in this window, averaging 19.97% gains in winning years across the last six midterm election cycles.
- The upcoming window begins Jun 25, 2026 and runs for 364 trading days, covering the heart of the midterm year into the following summer.
- Percent Profitable is 100%, with 6 winners and 0 losers across the historical sample.
- Average winner gains range from 10.75% to 24.85% by year, with a median profit of 21.62%.
- Intraperiod swings have been meaningful, with some years seeing adverse moves deeper than 20% before finishing higher.
- Risk-adjusted performance is strong, with a Sharpe ratio of 3.04 and a TradeWave Ratio of 2.9 for this long setup.
According to historical data from TradeWave.ai, this midterm-election-year stretch has behaved very differently from an average calendar year for QQQ. The next section walks through how that pattern has played out and why it matters as the 2026 window approaches.
How has Nasdaq QQQ Invesco ETF (QQQ) traded in past midterm-year windows?
Nasdaq QQQ Invesco ETF has posted gains in every single midterm-election-year window since 2002, averaging just under 20% per cycle for long positions. The next iteration of this 364-day window begins on Jun 25, 2026, with QQQ currently at 742.99, about 0.4% below its 52-week high of 745.64.[2] For a vehicle that anchors the Nasdaq’s tech-heavy leadership, a clean 6-for-6 record across two decades is a seasonal trend traders cannot ignore.
The pattern is grouped by the presidential election cycle, focusing on the last six midterm election years rather than consecutive calendar years. That matters because policy uncertainty, rate paths and fiscal debates tend to cluster in midterm years, shaping how growth and tech-heavy benchmarks like QQQ trade around Washington’s calendar.
Across those six midterm-year windows, QQQ’s cumulative return for the pattern is 196%, with an annualized return of 19.87% for the long setup. Individual years range from a 10.75% gain in 2018 to a 24.85% gain in 2022, while the median profit sits at 21.62%, showing that the typical outcome has been a solid double-digit advance rather than a one-off outlier.
Intraperiod swings have been real. In 2002, QQQ finished the window up 17.48% but at one point was down 22.39% from the entry before recovering. In 2018, the ETF endured a 15.9% drawdown inside the window yet still closed 10.75% higher, underscoring that even “all green” seasonal patterns can involve uncomfortable volatility along the way.
The favorable side of the ledger has also been sizable. Maximum favorable moves within the window have ranged from 12.37% in 2018 to 31.83% in 2010, showing that when QQQ trends in this regime, it often travels far in the trade direction before the window ends. The combination of strong average gains and a TradeWave Ratio of 2.9 points to a window where upside travel has historically been meaningful relative to the risk taken.
The historical seasonal average trend line slopes higher through most of the 364-day span, with relatively steady accrual rather than a single explosive burst. That suggests prior midterm-year windows have tended to reward patience, with gains building over months instead of hinging on one or two headline days.
A closer look at yearly net returns and intraperiod swings shows how consistently this window has favored the long side while still delivering sizable drawdowns.
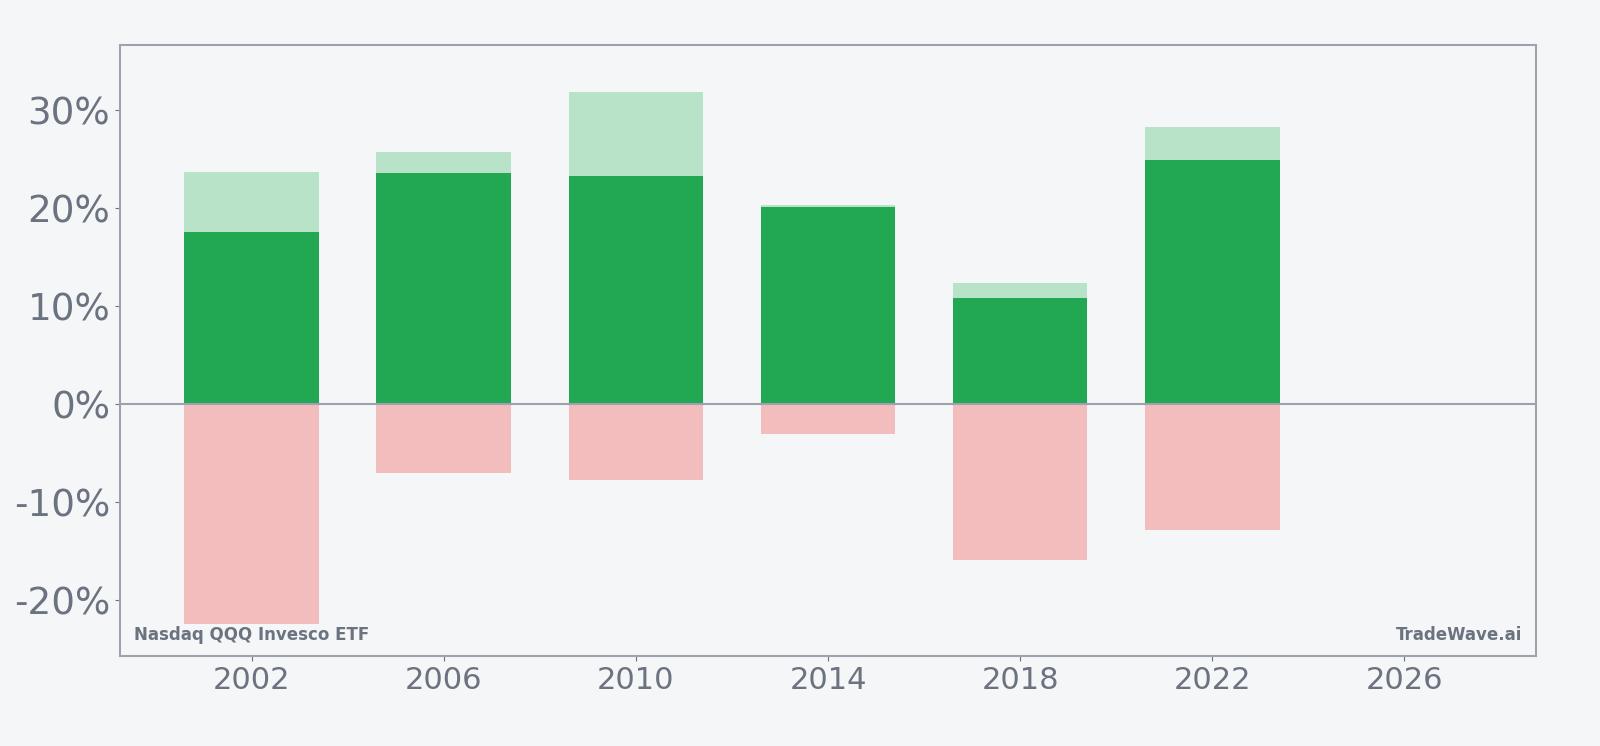
The stacked net/MFE/MAE profile shows a clear pattern: every bar ends above zero, but the downside wicks are long in several years, especially 2002 and 2018, where intraperiod drawdowns exceeded 15% before the window finished higher. Upside wicks are also substantial, with multiple cycles seeing 20% to 30% peak gains inside the window, reinforcing that this has been a high-conviction but not low-volatility stretch for QQQ.
History does not guarantee future results; even in windows where every past year finished higher, adverse excursions can be large and uncomfortable before any gains materialize.
Why does Nasdaq QQQ Invesco ETF (QQQ) follow this seasonal pattern?
One likely driver is the way the tech earnings calendar and policy debates bunch up in midterm years, with repeated guidance updates and rate expectations resetting around Washington headlines. Analysts have also pointed to institutional portfolio repositioning, as large managers often lean back into growth and innovation once early-year midterm volatility passes. This pattern may reflect that shift, with QQQ benefiting from renewed risk appetite as the policy path into the pre-election year becomes clearer.
What is driving Nasdaq QQQ Invesco ETF (QQQ) today?
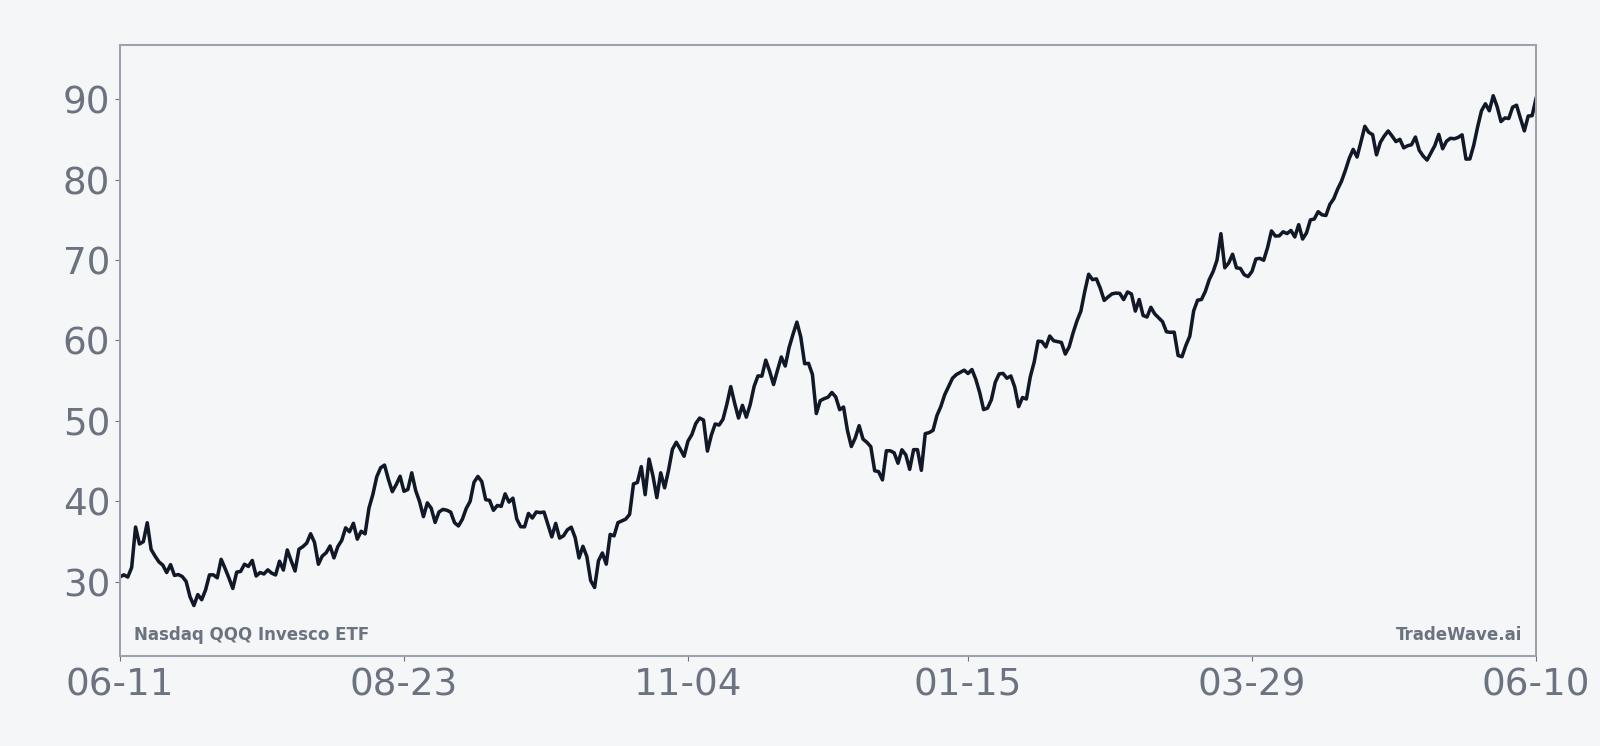
QQQ closed Monday at 742.99, up 0.63% on the day and sitting about 0.4% below its 52-week high of 745.64, after a month in which the ETF gained 10.17%.[1] Trading volume of roughly 28.4 million shares came in below the 20-day average of 38.98 million, suggesting the latest push toward new highs has not yet attracted a surge of incremental participation.[1]
Intraday QQQ quotes on MarketBeat pages show the ETF continuing to serve as the shorthand for Nasdaq and broader tech sentiment, with moves in the fund often cited alongside single-stock headlines in semiconductors, software and AI.[2][3] In December 2025, live coverage from The Wall Street Journal highlighted how a tech slide weighed on the Nasdaq, underscoring QQQ’s role as the transmission belt between megacap growth volatility and the broader equity tape.[6]
Macro commentary around those sessions has focused less on QQQ itself and more on the backdrop of shifting rate expectations, oil prices and index-level swings, but the ETF’s steady climb back toward record territory suggests investors are again leaning into the growth trade.[6] With QQQ now well above its 50-day moving average of 655.90 and trading on relatively calm volume, the setup heading into late June looks more like a grind higher than a panic chase.[1]
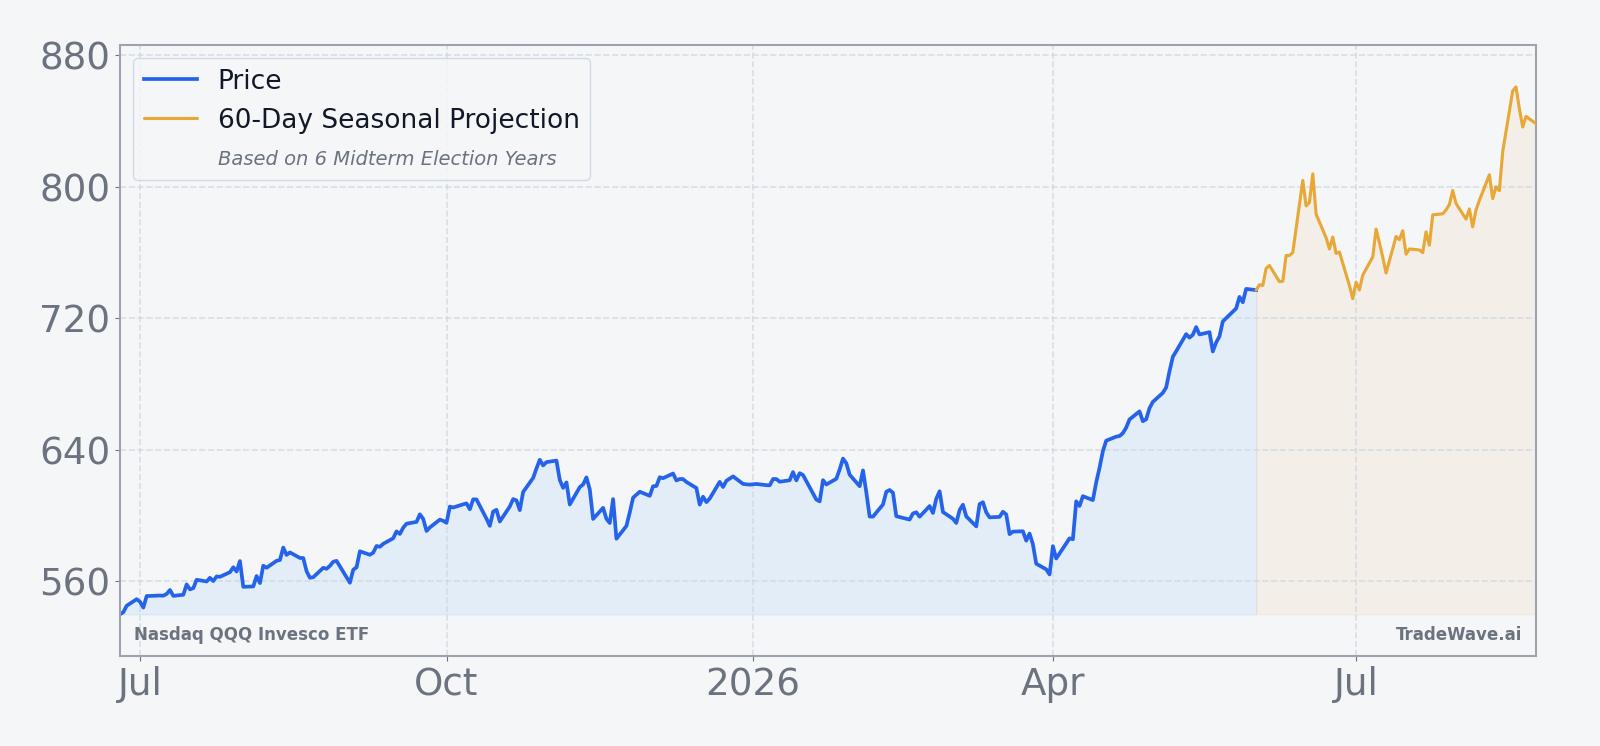
The chart below situates the latest move in its recent multi-month context, alongside a short-term seasonal projection.
What should traders watch as this midterm-year window approaches?
First, the calendar. The 364-day midterm-year window kicks off on Jun 25, 2026, and runs deep into the following summer, overlapping the transition from the midterm election year into the year before the presidential election. Historically, that shift has coincided with a friendlier policy and liquidity backdrop for risk assets, which has lined up with QQQ’s strong seasonal record in this regime.
Second, levels. With QQQ already pressing against its 52-week high, traders will be watching whether the ETF can sustain closes above the 745 area on normal volume, or whether a pullback toward the 50-day moving average near 656 emerges before the seasonal window opens.[1] A breakout that holds through early July would rhyme with prior midterm-year patterns where QQQ spent much of the window grinding higher after an initial consolidation.
Third, macro and policy catalysts. While the research set here does not enumerate specific upcoming events, prior midterm years have seen volatility cluster around rate decisions, fiscal debates and regulatory headlines that disproportionately affect tech and communication services.[6] How QQQ behaves around those dates will help confirm whether the historical midterm-year seasonal bias is reasserting itself or being overwhelmed by a new macro regime.
Finally, volatility inside the window. Past cycles show that even winning years have featured double-digit drawdowns before finishing higher, so traders may focus less on whether QQQ ticks higher every month and more on how deep any pullbacks run relative to those historical adverse excursions. If dips remain shallower than the 15% to 20% drawdowns seen in 2002 and 2018 while upside travel stays robust, it would mark an even stronger iteration of an already powerful seasonal pattern.
Sources
- [1] MarketBeat, “QQQ intraday quote shown on MarketBeat pages,” data via EODHD quote context.
- [2] MarketBeat, “Wesley Hastie Williams Sells 28,169 Shares of Cipher Mining Stock”, May 8, 2026.
- [3] MarketBeat, “Insider Selling: Cipher Mining Director Sells 20,000 Shares of Stock”, May 8, 2026.
- [6] The Wall Street Journal, “Stock Market News, Dec. 17, 2025: Tech Slide Weighs on Nasdaq; Oil Prices Gain”, Dec 17, 2025.
About this seasonal analysis
Seasonal pattern data is sourced from TradeWave.ai, which analyzes historical price behavior across annual calendar windows going back up to 30 years. Read the full data methodology or the book The 100-Year Pattern by Afshin Moshrefi (2026 edition). Past performance of seasonal patterns does not guarantee future results. This article is for informational purposes only and does not constitute investment advice.