REMX Near 52-Week High Despite History of June Losses
REMX is surging toward its 52-week high just as a 13-day June seasonal window that has historically favored short positions comes back into view.
What is the seasonal pattern for REMX (REMX)?
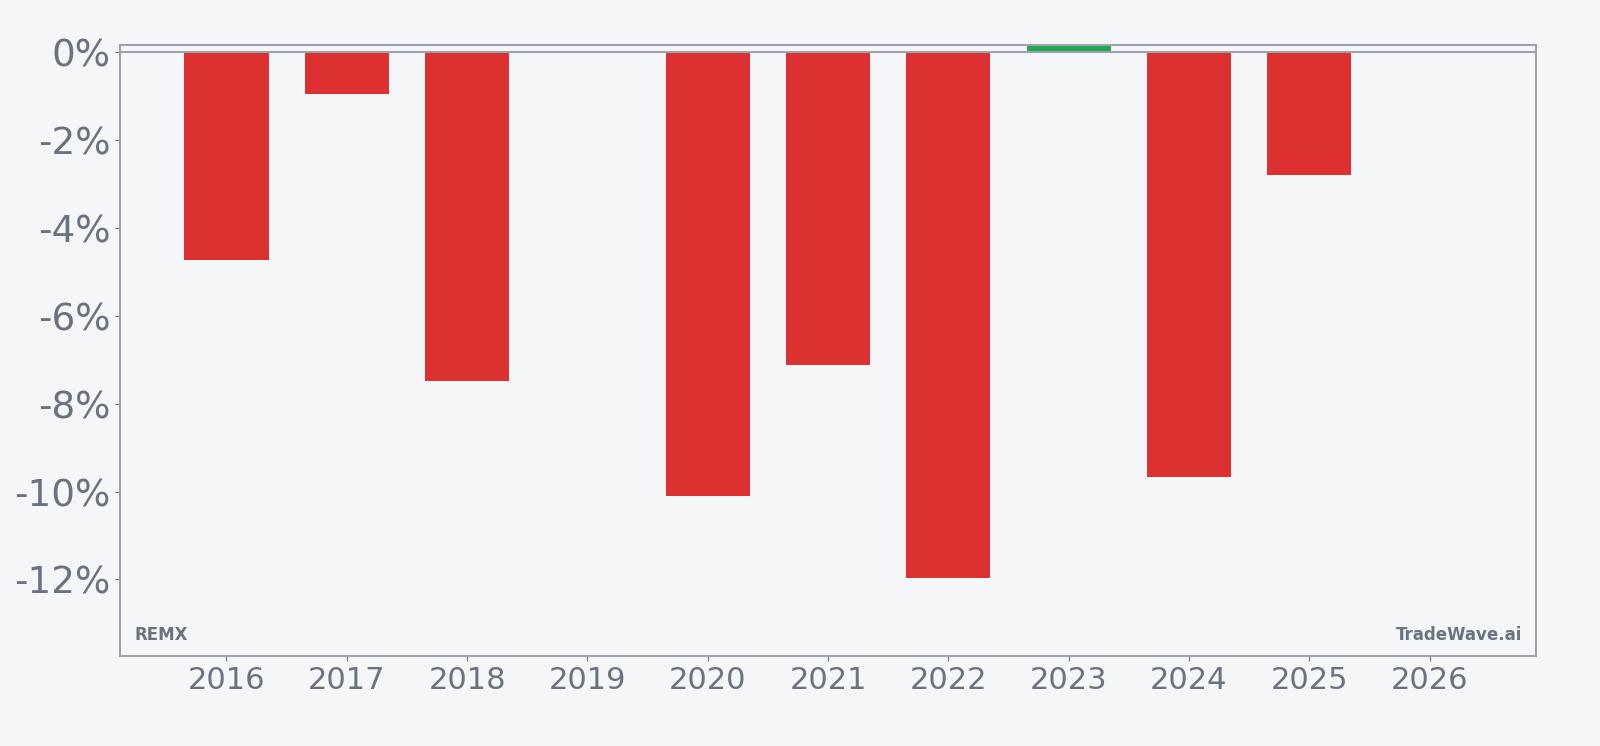
REMX has fallen in 8 of 10 years during this early-June 13-day window, with an average loss of 6.09% in winning short years.
- 8-for-10 record in this window, with short positions gaining an average 6.09% in winning years.
- The 13-day pattern that begins around Jun 8 has been historically bearish for REMX, aligning with a short trade direction.
- Percent Profitable stands at 80%, with 8 winners and 2 losers across the past decade of this REMX trading window.
- Including all years, the average outcome is a 5% decline, showing that losing years have been relatively contained.
- Intraperiod swings have been meaningful, with several years showing deep adverse moves before the short-side trend reasserted.
- For traders watching REMX seasonal trends, this has been one of the more consistent short-biased stretches on the calendar.
According to historical data from TradeWave.ai, this early-June window has behaved very differently from an average month for REMX, and the next iteration is approaching quickly.
How has REMX (REMX) traded in this early-June window?
REMX has delivered profitable short-side outcomes in 8 of the past 10 years during the 13 trading days that start around Jun 8, making this one of its most reliable bearish seasonal stretches. The ETF last closed at 101.57, up 3.6% on the day and sitting about 8.9% below its 52-week high of 111.55, after a modest 0.46% gain over the past month.
Historically, this REMX seasonal trend has been cleanly aligned with the short trade direction. Percent Profitable sits at 80%, with 8 winning short years and just 2 losing ones, and the average gain in those winning years is 6.09%, compared with a 5% average decline when every year is included. That gap tells you the losing years have been relatively shallow, while the winners have delivered meaningful downside moves.
The per-year table shows some of the strongest short years came in 2020 and 2022, when the ETF dropped 10.09% and 11.96% respectively over the 13-day span. In those years, the maximum favorable move for shorts was large, while the worst intraperiod drawdowns were also sizable, underscoring that the path to those gains was not smooth. Even in milder years such as 2017 and 2019, where net returns were roughly flat, the window still featured tradable swings in both directions.
The 10-year average seasonal curve slopes lower through most of the window, with the bulk of the decline typically accruing in the middle days rather than at the open or close of the period. That profile suggests REMX has tended to roll over after the window begins, rather than front-loading the move on day one. For traders, the typical pattern has been a grind lower rather than a single air pocket.
Year-by-year bars that combine net results with peak favorable and adverse moves show how much REMX has tended to swing inside this window.
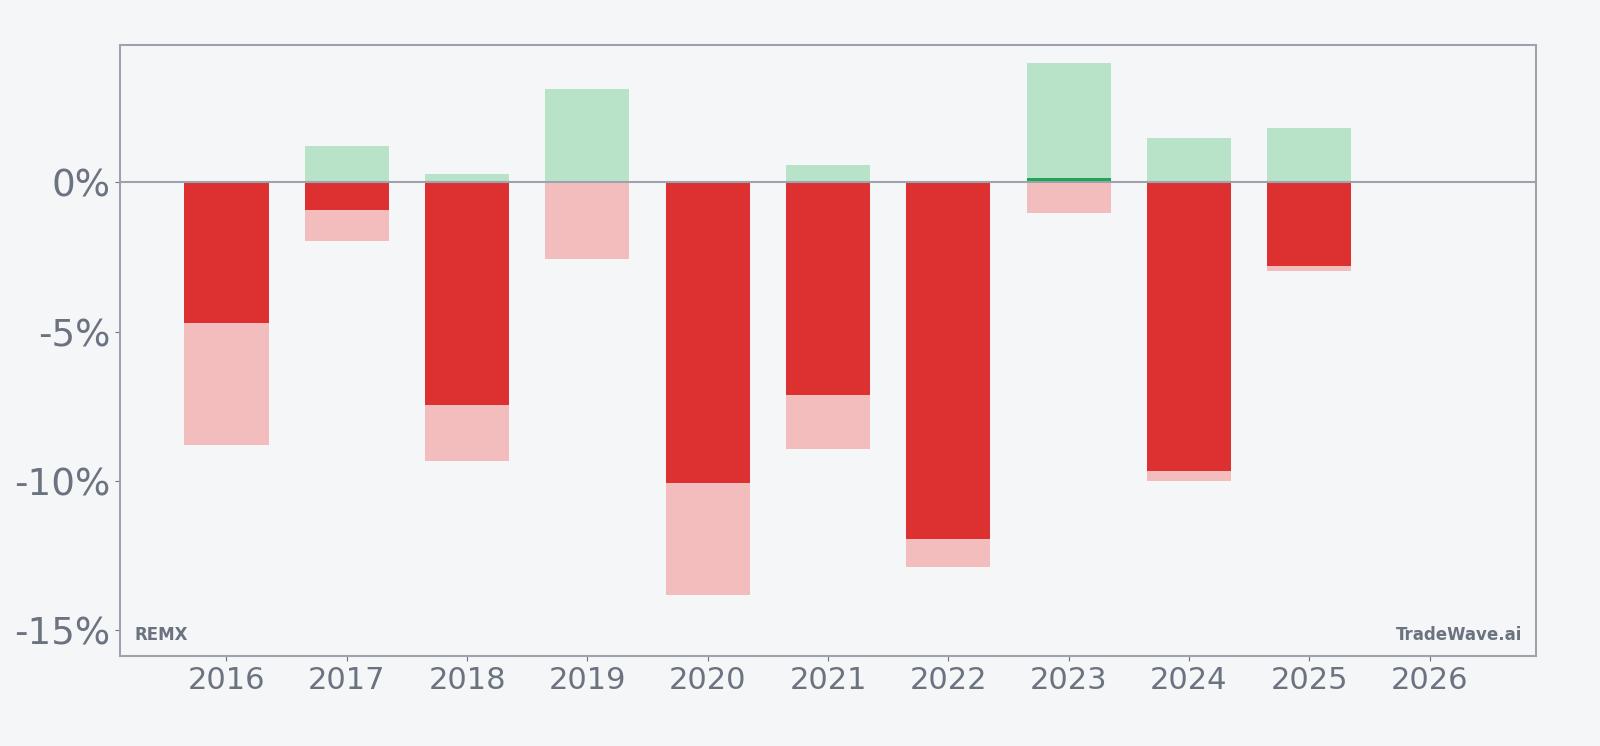
The combined net, maximum favorable excursion and maximum adverse excursion bars make clear that this is a high-variance stretch. In several of the best short years, REMX first moved against the trade by several percentage points before reversing and extending lower, which shows up as large adverse excursions even in winning outcomes. In other years, the ETF dropped quickly with relatively modest countertrend rallies, creating a cleaner path for shorts but still reminding traders that intraday and intraperiod volatility can be sharp.
History does not guarantee future results; adverse excursions can be large even in windows that have often finished in the trade direction.
Why does REMX (REMX) follow this seasonal pattern?
This REMX seasonal pattern likely reflects how rare earth and strategic metals equities respond to early-summer positioning shifts. One likely driver is institutional portfolio rebalancing around midyear, when managers adjust exposure to cyclical materials and commodity-linked themes. The pattern may also capture recurring swings in expectations for industrial demand and clean-energy policy, which often reset as new data and guidance emerge ahead of the second half of the year.
What is driving REMX (REMX) today?
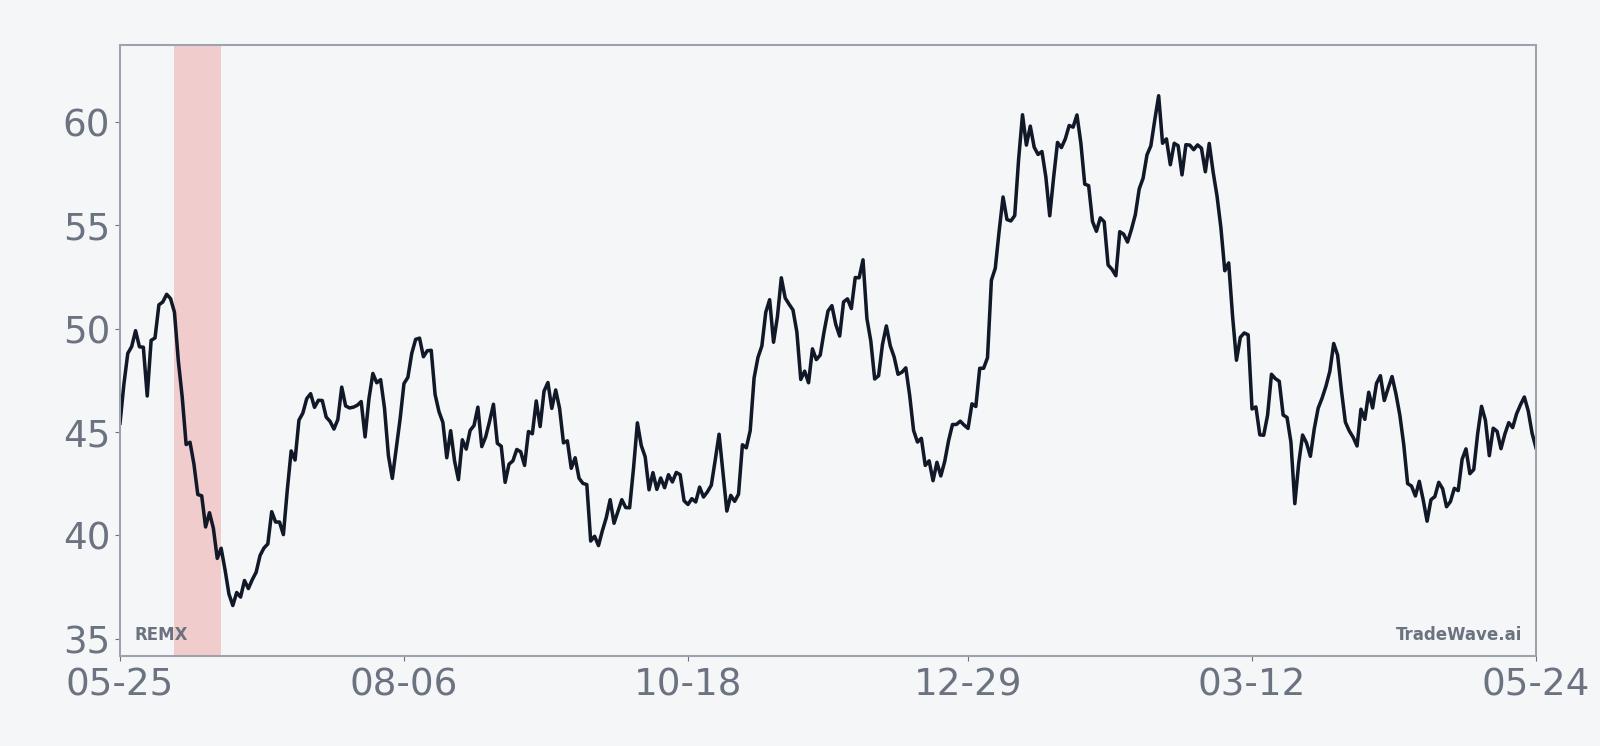
REMX closed at 101.57, up 3.6% on the day, after trading between 98.12 and 101.80 on volume of about 851,000 shares, below its 20-day average of roughly 1.38 million. That puts the ETF within sight of its 52-week high at 111.55 and well above its 52-week low near 34.45, with the price also sitting above its 50-day moving average of 96.48. The one-month gain of just 0.46% shows that most of the recent progress has come in the latest session rather than through a steady climb.
The chart below situates the latest move in its recent multi-month context and overlays a 60-day seasonal projection.
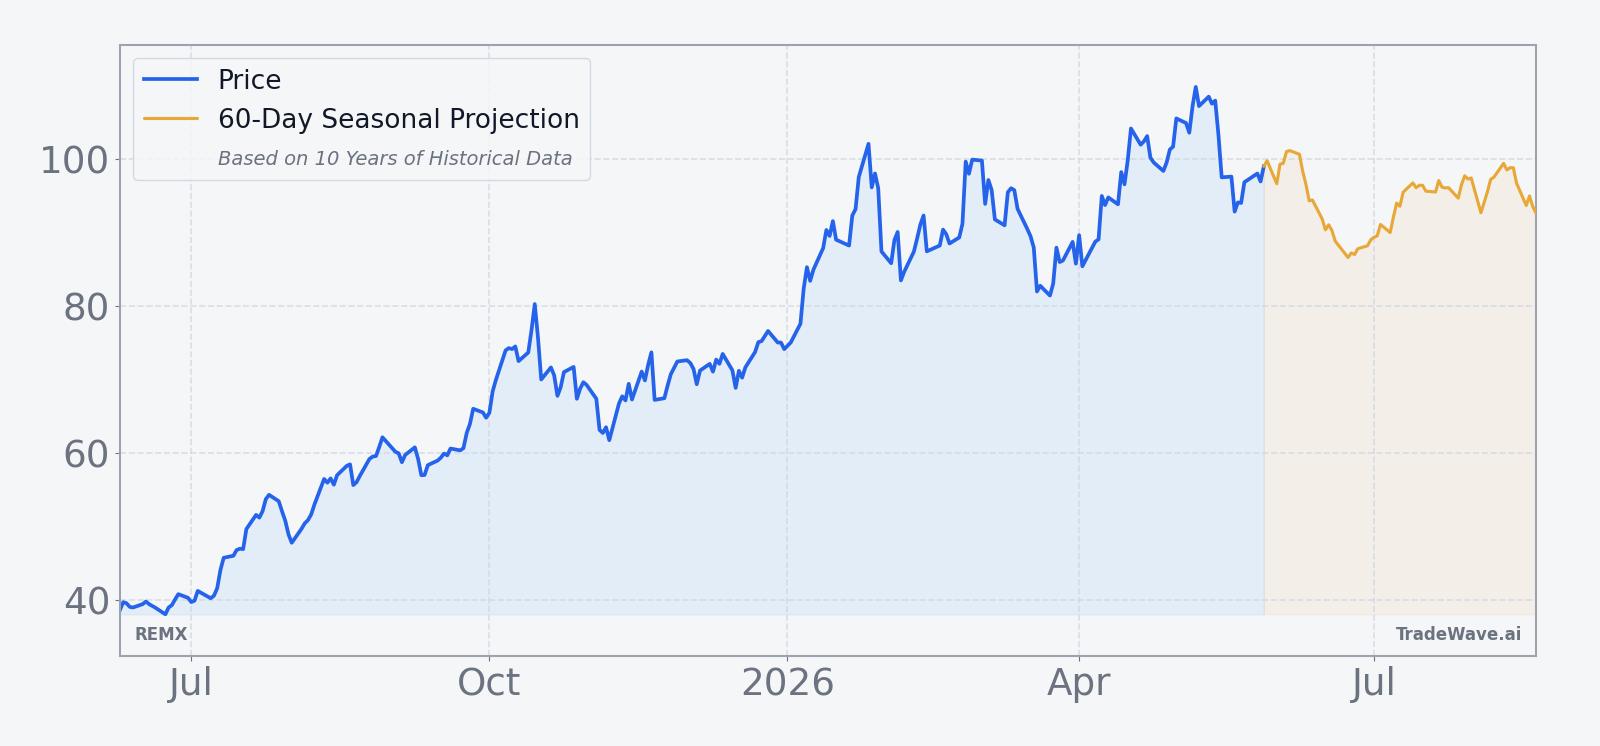
Flows data for REMX are quiet in the latest dataset, so the story is more about price than about large-scale money moving in or out of the ETF. With the fund trading above its 50-day moving average and within 10% of its 52-week high, the current setup looks like a firm uptrend heading into a historically weak seasonal stretch for the underlying rare earth and strategic metals exposure. That tension between trend and historical seasonality is what makes this upcoming window worth watching for traders who track ETF stock pattern analysis and sector seasonal outlooks.
What should traders watch in this REMX (REMX) seasonal window?
The first marker is timing. The 13-day REMX trading window that has historically favored shorts begins on Jun 8 and runs for roughly three weeks of market sessions, so price action in the days just before and after that date will show whether the pattern is lining up again or being overwhelmed by other forces.
Second, watch how REMX behaves relative to its recent highs and the 50-day moving average. A failure to hold above that moving average during the window, especially if the ETF starts rolling over from levels still below the 52-week high, would be consistent with the historical seasonal trend. On the other hand, a decisive breakout toward or through the 111.55 high with only shallow pullbacks would contradict the typical early-June weakness and signal that this cycle is trading on a different playbook.
Third, monitor volume and any pickup in ETF flows as the window progresses. Historically, some of the biggest short-side years in this pattern have coincided with macro or sector headlines that pushed investors to de-risk rare earth and strategic metals exposure, even if the flows data in the current snapshot are muted. If volumes expand on down days during the window, that would echo the prior pattern of selling pressure building once the calendar flips into this stretch.
Finally, keep an eye on how intraperiod swings evolve. The historical record shows that even winning short years have seen sizable adverse moves before the trend reasserted, so sharp rallies inside the window do not automatically negate the seasonal bias. What matters is whether those bounces are quickly sold and followed by fresh lows, which would fit the established REMX seasonal trend, or whether they hold and build into a sustained breakout that leaves the early-June pattern behind.
Sources
About this seasonal analysis
Seasonal pattern data is sourced from TradeWave.ai, which analyzes historical price behavior across annual calendar windows going back up to 30 years. Read the full data methodology or the book The 100-Year Pattern by Afshin Moshrefi (2026 edition). Past performance of seasonal patterns does not guarantee future results. This article is for informational purposes only and does not constitute investment advice.