DB Agriculture Fund Invesco (DBA) Has Dropped 10 of 10 Times in This 21-Day June Window
DB Agriculture Fund Invesco is approaching a 21-day June seasonal window that has been consistently weak, even as the ETF trades about 6.8% below its 52-week high in a macro backdrop that still favors agriculture exposure.
What is the seasonal pattern for DB Agriculture Fund Invesco (DBA)?
DB Agriculture Fund Invesco has fallen in 10 of 10 years during this late-June 21-day window, with an average loss of 3.96% in winning short years.
- 10 for 10 in this window for short positions, with average gains of 3.96% for the short side across the past decade.
- The upcoming 21-day trading window begins Jun 8, 2026 and has historically been a bearish June seasonal pattern for DBA.
- Percent Profitable is 100%, with 10 winners and 0 losers for the short trade direction in this DBA seasonal trend.
- Average annualized return in the window is 3.94% for shorts, with a Sharpe ratio of 1.8 that signals unusually consistent outcomes.
- The TradeWave Ratio of 1.9 indicates that price has typically traveled meaningfully in the trade direction within the window, even before final closes.
- Individual years have seen net drops between about 0.1% and 7.3% for DBA, showing that while the direction has been reliable, the size of the move can vary.
According to historical data from TradeWave.ai, this specific June stretch has behaved very differently from an average month for DBA. The next section walks through how that pattern has played out over the past decade and what it means as the 2026 window approaches.
How has DB Agriculture Fund Invesco (DBA) traded in this June window?
DB Agriculture Fund Invesco has declined in this 21-day June window in every one of the past 10 years, with short positions averaging 3.96% gains as DBA slipped each time. The next iteration of the window begins on Jun 8, 2026, with the ETF last closing at 26.88, about 6.8% below its 52-week high of 28.84 and roughly 12.9% above its 52-week low of 23.80. That combination of a still-elevated price versus last year’s lows and a decade-long record of June weakness makes this DBA seasonal pattern hard for commodity traders to ignore.
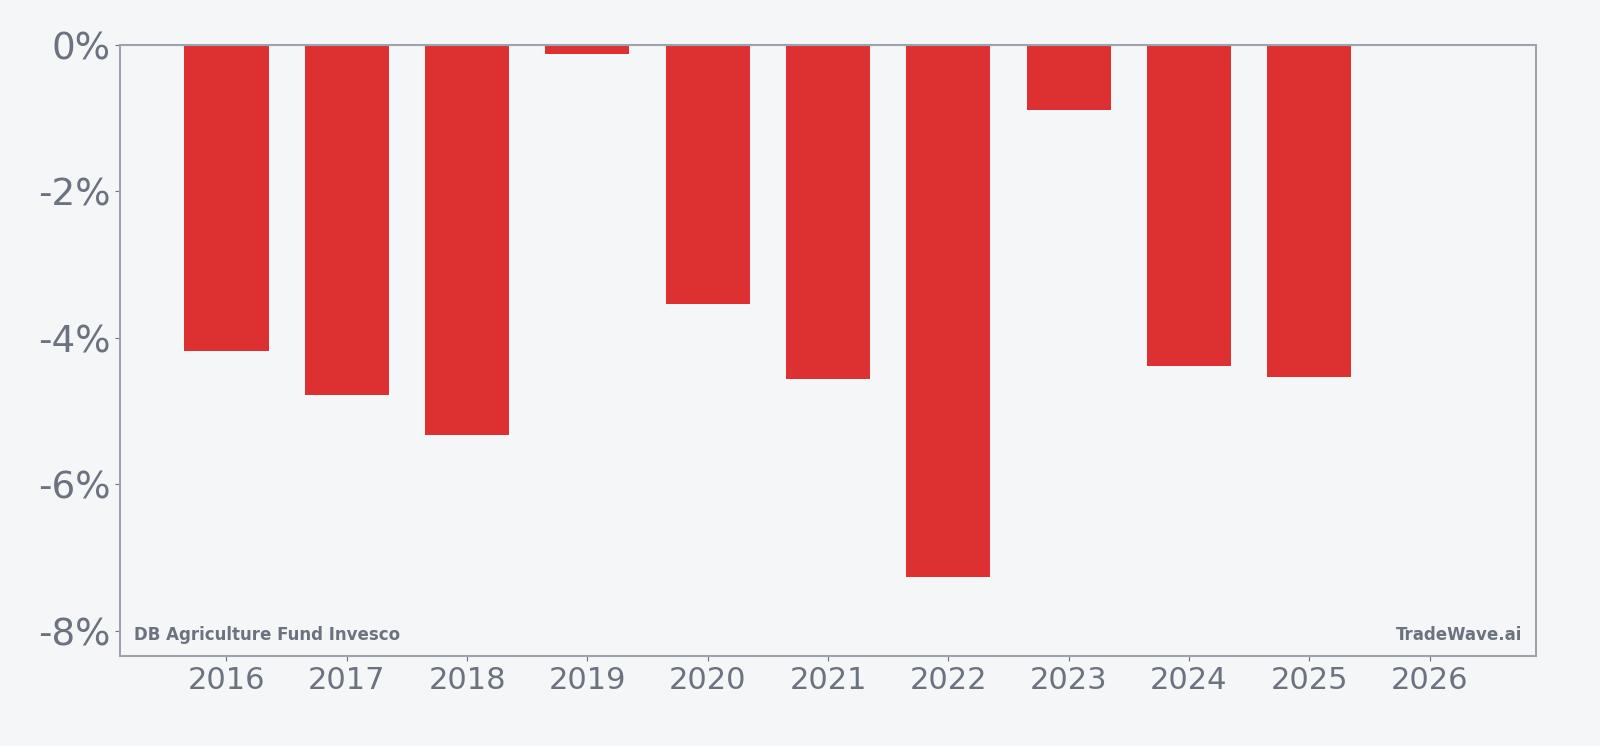
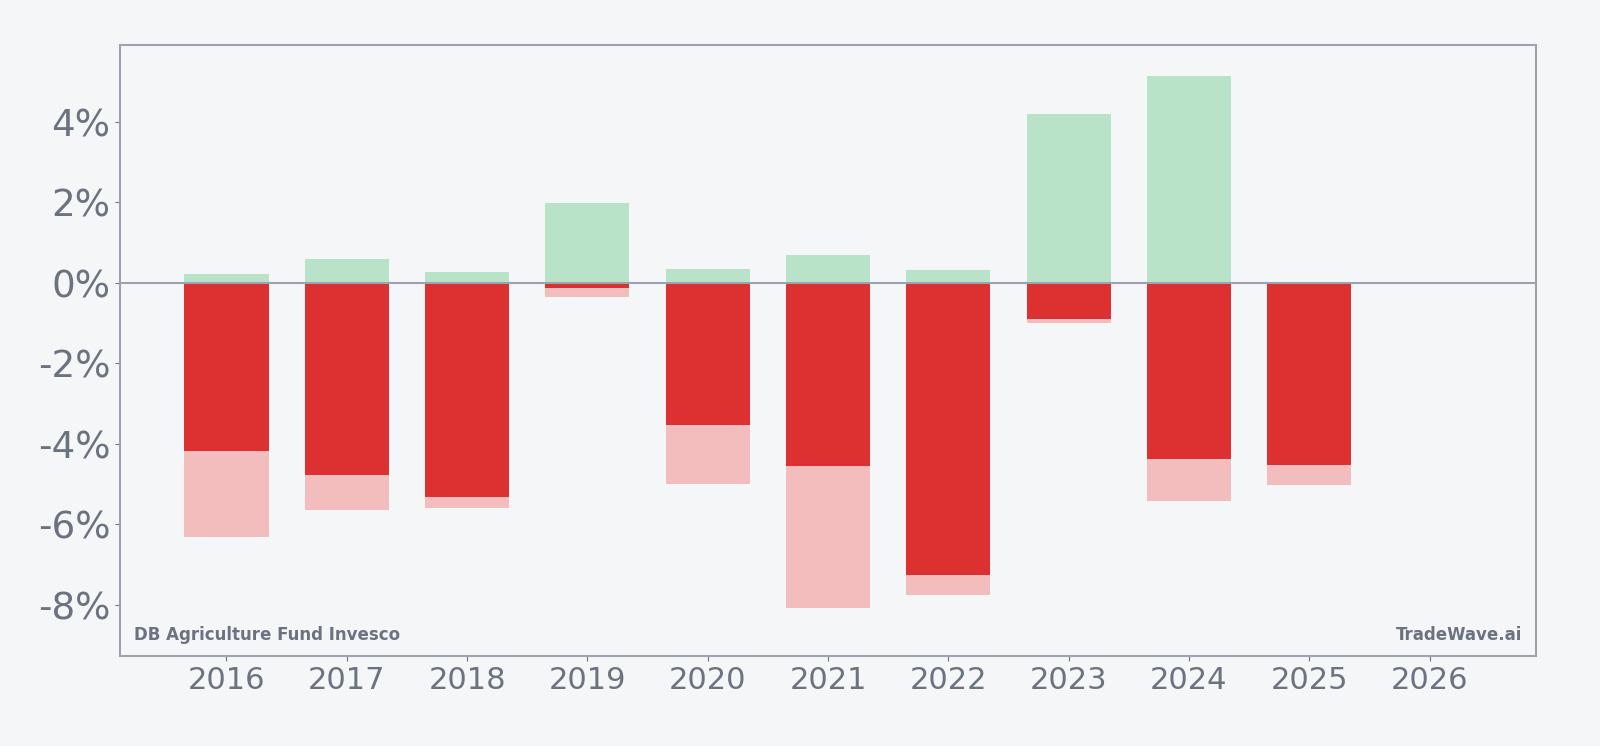
A second view layers in the best and worst intraperiod swings to show how far DBA has tended to move inside the window.
Across the 10-year lookback, every June window produced a negative net return for DBA, ranging from a mild 0.12% drop in 2019 to a 7.26% slide in 2022. For a short trade, those are all winning years, which is why the Percent Profitable metric sits at 100% with 10 winners and 0 losers. The average winner’s gain of 3.96% on the short side lines up closely with the 4% all-years average, since there were no losing years to drag the figure down.
The intraperiod swings tell an important part of the story. In stronger years for the pattern such as 2016, 2017, 2018, 2021, 2022, 2024 and 2025, DBA’s maximum adverse move against the short ranged between about 5% and 8%, while the maximum favorable move in the trade direction was often modest. In 2021, for example, the best point-to-peak move in favor of the short was only 0.68%, while the worst drawdown from entry was 8.07%. That profile shows that even in years that finished solidly lower, DBA could squeeze higher inside the window before rolling over.
Other years flipped that balance. In 2023 and 2024, DBA’s maximum favorable excursions for shorts reached 4.19% and 5.14% respectively, while the worst intraperiod drawdowns were contained to around 1% and 5.42%. Those episodes show how the window can deliver both meaningful downside follow-through and more manageable squeezes, depending on how the underlying grain and soft commodity markets behave in a given year.
The 10-year average seasonal trend chart suggests that the typical pattern is a fairly steady grind lower rather than a single sharp break. The average path slopes down across most of the 21 days, with no obvious mid-window reversal point. That lines up with the Trend Short metrics, which show 60 days of short-favorable behavior versus only 12 days that favored longs across the broader seasonal context around this window.
The cumulative return profile across the decade adds up to a 47% gain for the short side in this specific DBA trading window. Add it up: 10 straight years of negative net returns for the ETF in this slice of the calendar, with a Sharpe ratio of 1.8 that signals relatively consistent risk-adjusted performance for the pattern. History does not guarantee a repeat, but the record is unusually one-sided for a diversified agriculture ETF.
History does not guarantee future results, and even in a window with a perfect track record for shorts, adverse intraperiod moves can be large enough to challenge risk management.
Why does DB Agriculture Fund Invesco (DBA) follow this seasonal pattern?
One likely driver is the way crop-year expectations and planting progress reports cluster in late spring and early summer, which can reset pricing for grains and oilseeds in a short burst. Analysts have also pointed to institutional portfolio rebalancing around midyear, when some managers trim commodity exposure after spring rallies and reallocate into other assets.[5] For DBA, which bundles futures across grains, oilseeds, livestock and softs, that combination of supply updates and positioning shifts may help explain why this late-June window has repeatedly leaned lower.
What is driving DB Agriculture Fund Invesco (DBA) today?
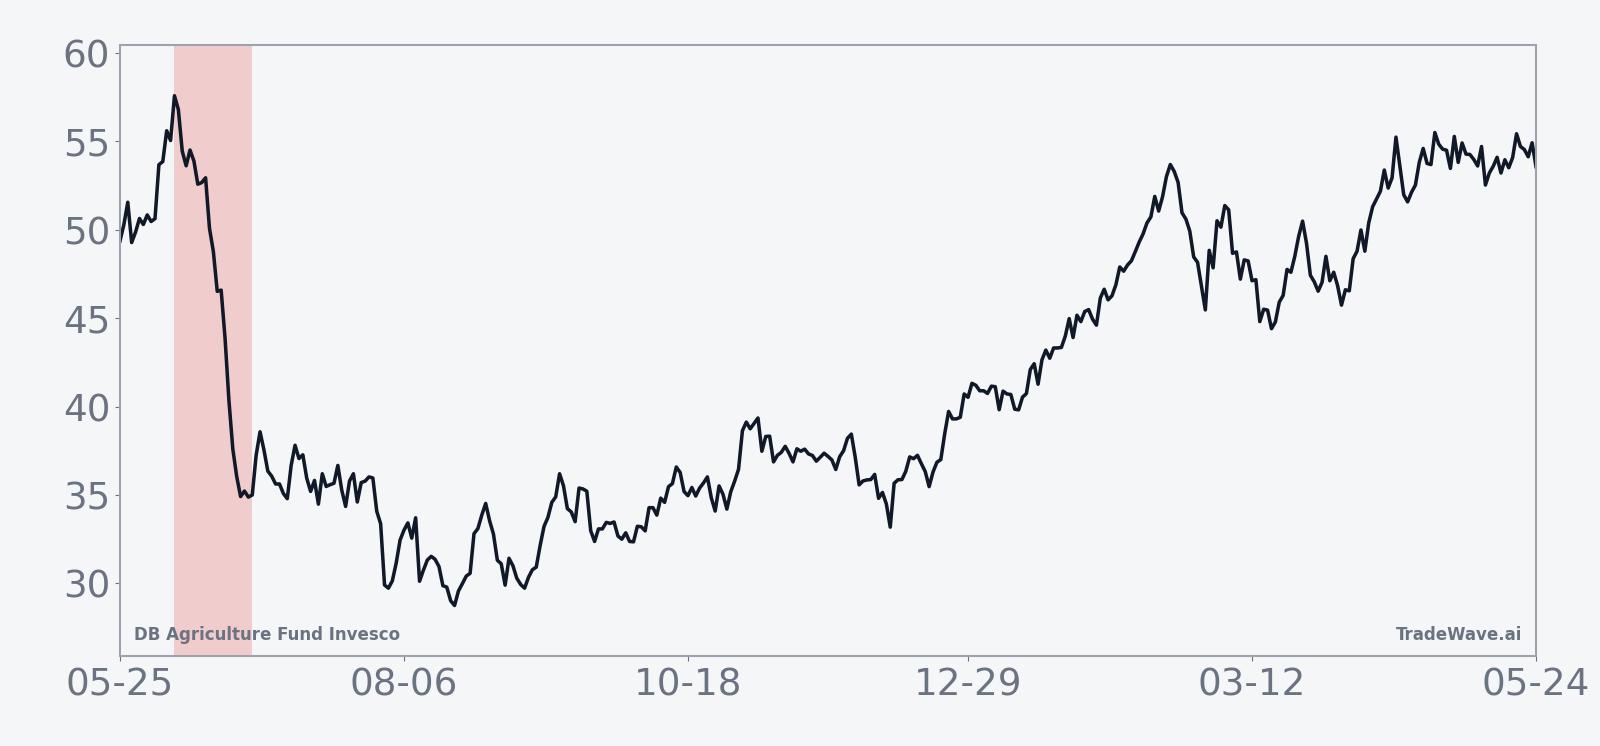
DB Agriculture Fund Invesco slipped 0.9% in the latest session to 26.88, trading in a tight intraday band between 26.88 and 27.18 on volume of about 762,000 shares. That leaves the ETF roughly 6.8% below its 52-week high of 28.84 and about 12.9% above its 52-week low near 23.80, with a one-month return of -5.32% and the price sitting under its 50-day moving average of 27.51. The 20-day average volume of roughly 1.47 million shares suggests liquidity remains solid even as near-term performance has softened.
Macro commentary around agriculture has stayed constructive in 2026, even as DBA has pulled back from its highs. On Apr 30, 2026, a Seeking Alpha analysis highlighted rising fertilizer prices and potential supply shortages as supportive for agricultural ETFs, noting that higher input costs and tight supply can underpin crop prices and, by extension, broad agriculture funds such as DBA.[5] Earlier in the year, another article pointed to elevated geopolitical risk around the Strait of Hormuz as a tail risk that could spill into energy and fertilizer markets, again bolstering the case for agriculture and fertilizer exposure as a hedge.[5] Those themes frame DBA as a way to express a diversified agriculture view rather than a single-crop bet.
DBA’s structure matters for how this price action translates into portfolio behavior. The ETF holds a basket of futures across grains, oilseeds, livestock and soft commodities, giving investors exposure to a broad agriculture complex instead of one contract.[5] That diversification can smooth out idiosyncratic shocks in any single market, but it also means the fund can lag the strongest individual contracts in a rally and remain vulnerable when weakness is broad-based across the complex.
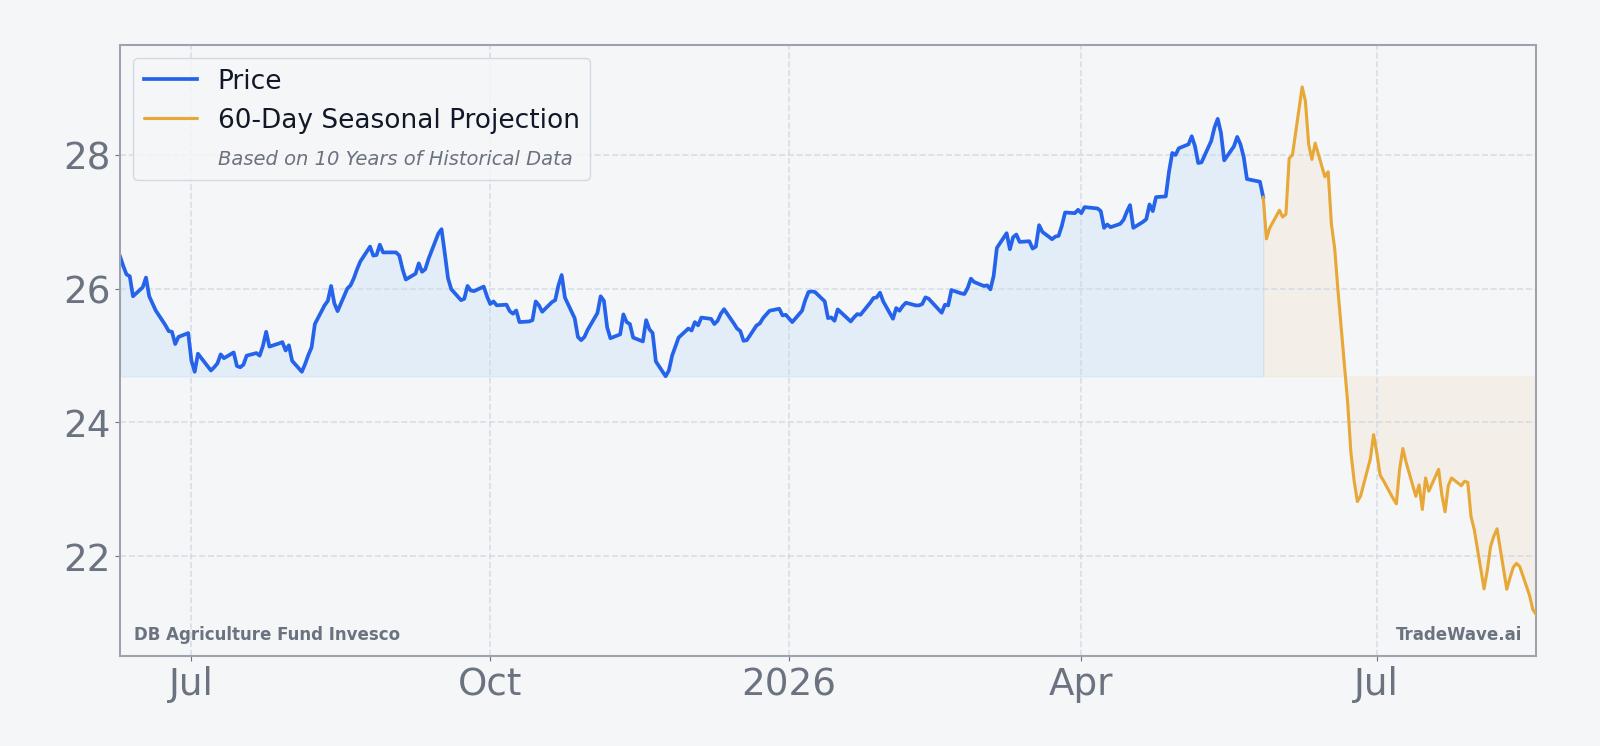
The chart below situates the latest pullback against DBA’s past year of trading and a 60-day seasonal projection overlay.
What should traders watch as this DBA seasonal window approaches?
First, watch how DBA behaves as Jun 8 approaches relative to its 50-day moving average around 27.51. A failure to reclaim that level before the window opens would fit the historical pattern of June softness, while a decisive move back above it would signal that buyers are willing to lean into the agriculture story despite the seasonal headwind.
Second, keep an eye on macro catalysts tied to fertilizer prices and energy markets. Any fresh headlines around supply disruptions or cost spikes could reinforce the longer-term bullish case for agriculture exposure, even if the short-term seasonal window has historically leaned bearish for DBA.[5] A scenario where macro news is supportive but DBA still struggles in the window would underline how powerful this calendar effect has been.
Third, monitor how closely DBA tracks its underlying agriculture futures basket during the window. Tracking differences can widen when volatility picks up or when roll costs in the futures curve change, which can either amplify or mute the seasonal pattern in the ETF relative to the benchmark contracts.
Finally, the most telling signal will be whether DBA’s price action respects the decade-long record of June weakness or breaks it. A quick slide that lines up with the historical average decline would confirm that this 21-day stretch remains a problem zone for long exposure. A firm or rising tape through late June, by contrast, would mark the first real failure of this DBA seasonal trend in 10 years and could force traders who rely on calendar patterns to reassess how they use this window in their agriculture playbook.
Sources
- [1] Seeking Alpha, "The Case For The Agricultural DBA ETF (NYSEARCA:DBA)", Feb 25, 2026.
- [3] Seeking Alpha, "The Prospects For Agricultural Commodities And The DBA ETF: November Update (DBA)", Nov 24, 2025.
- [4] Seeking Alpha, "Agricultural Commodities And The DBA ETF (NYSEARCA:DBA)", Aug 28, 2025.
- [5] Seeking Alpha, "The Case For Agriculture Exposure Through The No-K1 PDBA ETF (NASDAQ:PDBA)", Apr 30, 2026.
About this seasonal analysis
Seasonal pattern data is sourced from TradeWave.ai, which analyzes historical price behavior across annual calendar windows going back up to 30 years. Read the full data methodology or the book The 100-Year Pattern by Afshin Moshrefi (2026 edition). Past performance of seasonal patterns does not guarantee future results. This article is for informational purposes only and does not constitute investment advice.