WEAT Has Fallen in 9 of 10 Late-June Windows, With Shorts Averaging 3.58% Profits
Teucrium Wheat is under pressure again as traders head toward a late-June seasonal window that has historically favored short positions and sharp wheat-price swings.

What is the seasonal pattern for Teucrium Wheat (WEAT)?
Teucrium Wheat has fallen in 9 of 10 years during this late-June 10-day window, with an average 3.58% gain in winning short years.
- 9 for 10 in this window, with short trades averaging 3.58% gains in winning years over the past decade.
- The late-June seasonal window begins on Jun 18 and runs for 10 trading days, historically favoring downside moves in WEAT.
- Percent Profitable sits at 90%, with 9 winners and 1 loser for the short-side pattern across the 10-year sample.
- Including every year, Avg Profit - All is 3%, showing that the lone losing year has not erased the typical short-side edge.
- Maximum adverse excursions have reached more than 7% in some years, so short trades have faced meaningful intraperiod drawdowns even when they finished ahead.
- A TradeWave Ratio of 2.12 and a Sharpe ratio of 1.03 point to a historically efficient but volatile short window for wheat exposure.
According to historical data from TradeWave.ai, this specific late-June stretch has behaved very differently from an average month for WEAT, and the next iteration is just days away.
How has Teucrium Wheat (WEAT) traded in the late-June window?
Teucrium Wheat has delivered profitable short trades in 9 of the past 10 years during the 10-day window that starts on Jun 18, with winning years averaging 3.58% gains for bears. Today the ETF closed at 22.655, down 2.1% on the session and sitting about 81.4% below its 52-week high of 121.75, after a choppy month that has already seen a 4.55% decline.
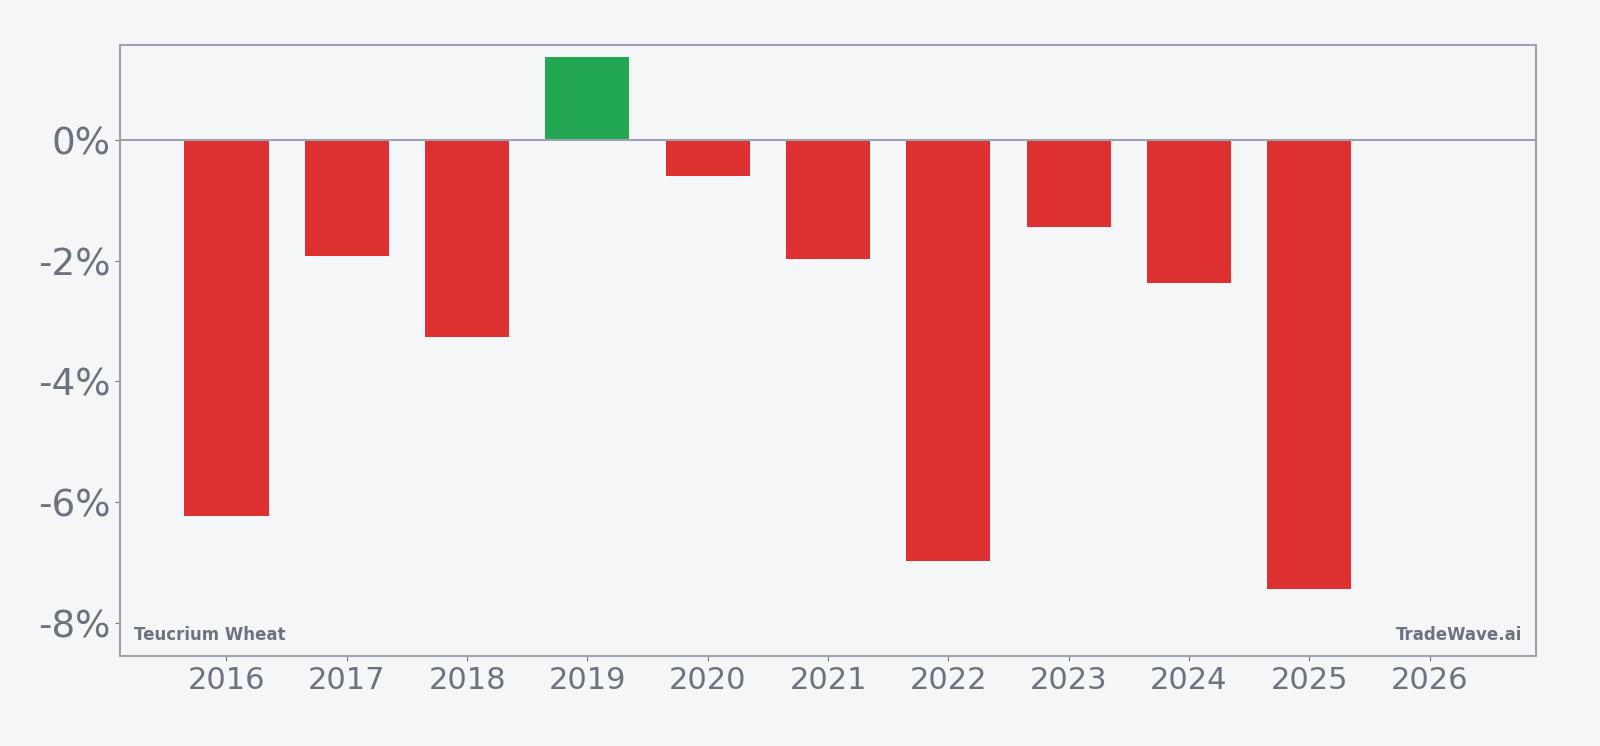
Historically this late-June Teucrium Wheat trading window has been a clean short-side pattern. The trade direction is explicitly short, and 90% of the past 10 years have finished with WEAT lower at the end of the 10-day stretch. The single losing year in 2019 saw a modest 1.37% gain for the ETF, while the worst year for shorts, 2016, delivered a 6.23% rally against the pattern.
Average winner gains of 3.58% for shorts compare with an all-years average of 3% when the lone losing year is included. That gap shows that the occasional countertrend move has not fully offset the typical downside bias in this late-June slice of the wheat calendar. For traders who care about risk-adjusted behavior, a Sharpe ratio of 1.03 over the decade is solid for such a short 10-day window.
The per-year table shows that the strongest short year was 2025, when WEAT fell 7.44% from an entry around 24.20 to an exit near 22.40 during the window. On the other side, 2019 stands out as the only year where the ETF finished higher, with a 1.37% gain that would have hurt shorts but still sat inside the broader historical volatility band for this pattern.
The historical seasonal average suggests that much of the move for shorts has tended to accrue steadily across the 10 days rather than in a single gap. The cumulative return curve slopes lower through the window, with only brief pauses, which fits a pattern of persistent selling pressure rather than one-off shocks.
Year-by-year bars that combine net returns with peak favorable and adverse moves show how far WEAT has typically swung inside the window.
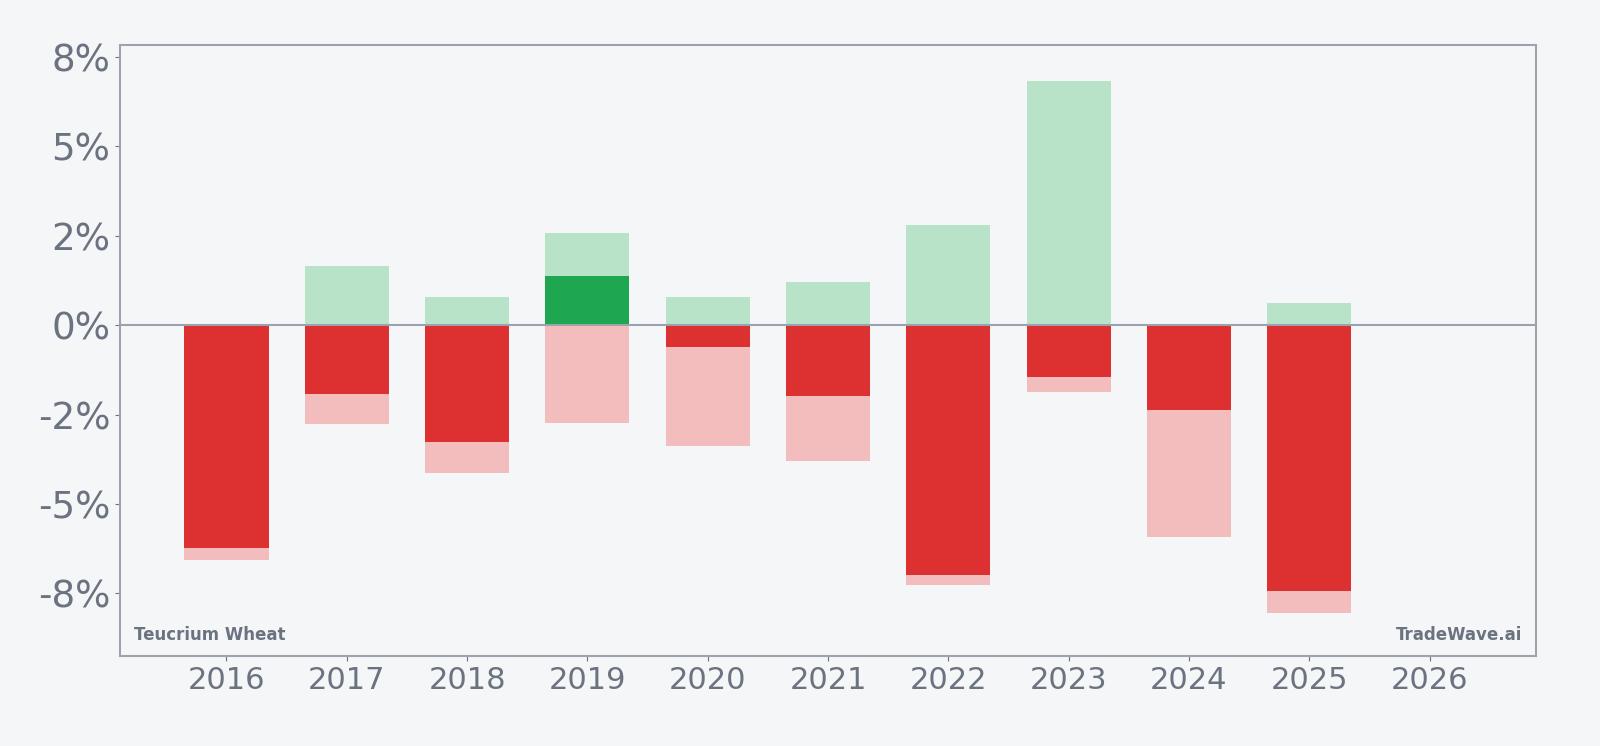
The maximum favorable excursion numbers show that in strong years, WEAT has often moved well beyond the final close in the short direction, giving traders room to scale out or tighten risk. At the same time, maximum adverse excursions have reached between 5% and 8% in several years, including 2016, 2022 and 2025, which means shorts have had to sit through sizable rallies before the pattern reasserted itself. The TradeWave Ratio of 2.12 captures this dynamic by measuring how far price typically travels in the trade direction within the window, independent of where it finishes.
History does not guarantee future results; adverse excursions (MAE) can be large even in winning windows.
Why does Teucrium Wheat (WEAT) follow this seasonal pattern?
This late-June pattern for Teucrium Wheat likely reflects the grain market’s supply and demand calendar. One likely driver is the Northern Hemisphere growing season, when crop condition reports, weather shifts and early yield expectations start to crystallize and can pressure wheat prices. Analysts often point to hedging flows from producers and position adjustments by managed money around these updates as key reasons why wheat-linked instruments like WEAT show repeatable seasonal behavior in this part of June.
What is driving Teucrium Wheat (WEAT) today?
WEAT fell 2.1% on Jun 4 to 22.655, extending a one-month slide of 4.55% and leaving the ETF about 81.4% below its 52-week high of 121.75. Volume of roughly 1.0 million shares ran slightly above the 20-day average of about 904,548, a sign that traders are leaning into the latest leg lower rather than stepping back. With the price also sitting below its 50-day moving average of 23.51, the near-term trend remains soft even before the late-June seasonal window opens.
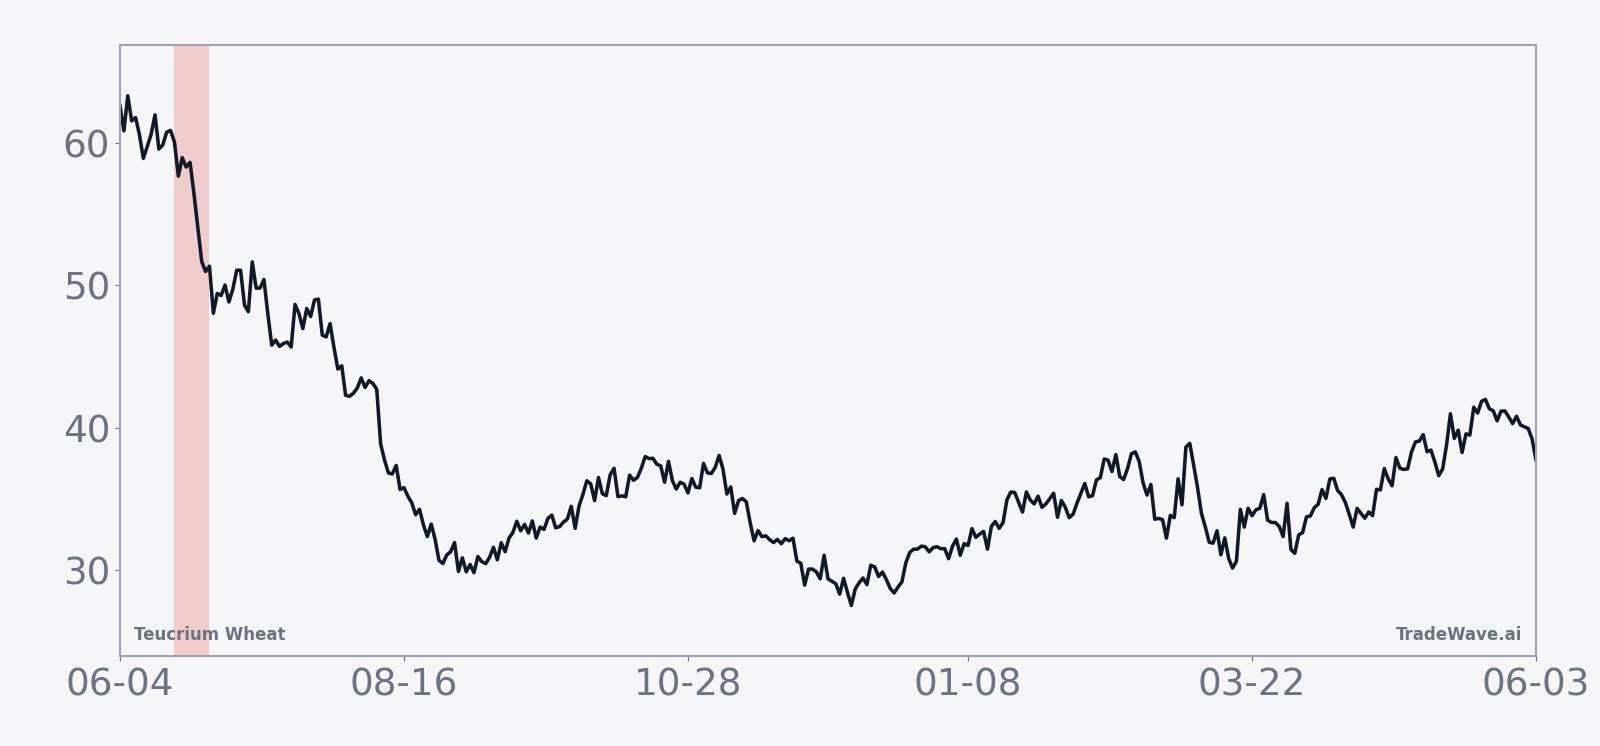
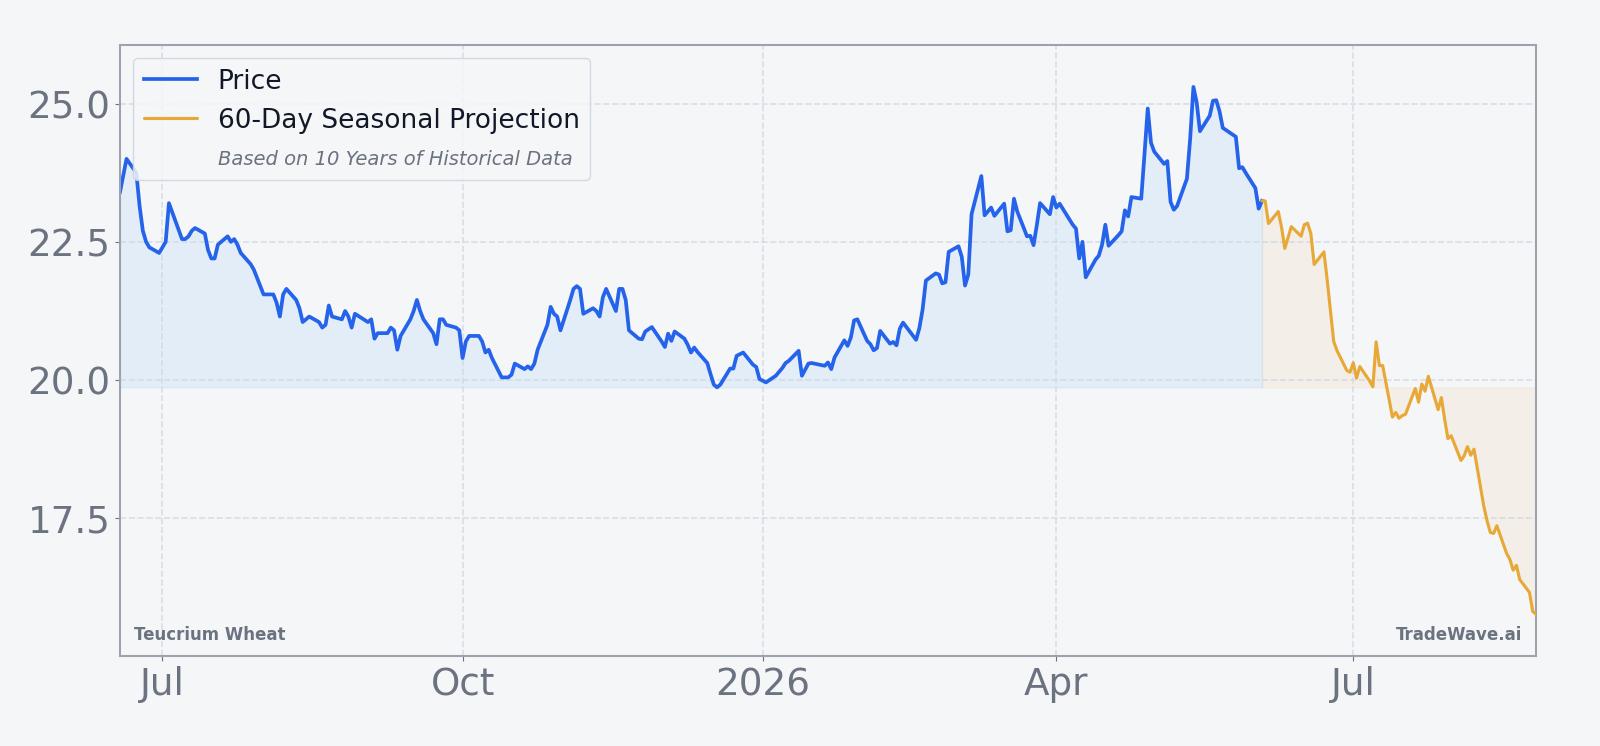
The chart below situates the latest move in its recent multi-month context and overlays the upcoming seasonal projection.
Teucrium Wheat is designed to give investors exposure to wheat futures through a basket of Chicago Board of Trade contracts, so its moves often track shifts in global grain prices and expectations for harvests and exports. The recent pullback comes after a volatile year for agricultural commodities, with traders toggling between weather risk, geopolitical disruptions to Black Sea exports, and shifting demand from major importers. Tracking error versus front-month futures can appear during roll periods, but over multi-week stretches the ETF still functions as a liquid proxy for wheat price direction.
Against that backdrop, the upcoming seasonal window matters because it layers a historically bearish 10-day stretch on top of an already weak tape. For hedgers, the pattern offers one more data point when deciding whether to lock in prices or leave exposure open into late June. For speculative traders, it frames a period where short setups in WEAT have historically had both a statistical edge and meaningful intraperiod volatility.
What should traders watch in the upcoming WEAT seasonal window?
The first marker is timing. The seasonal window begins on Jun 18 and runs for 10 trading days, so price action in the days just before that start date will shape how stretched or compressed WEAT looks going in. A continued slide toward the 52-week low near 19.78 would mean shorts are pressing into weakness, while a bounce back toward the 50-day moving average would give the pattern more room to work.
Second, watch intraday ranges and volume once the window opens. In prior years, some of the best short outcomes have come with elevated volume and steady selling rather than gap-driven collapses. If WEAT trades lower on expanding volume and closes near session lows on multiple days, that would rhyme with the historical seasonal trend. Conversely, repeated intraday reversals higher or closes near the top of the day’s range would signal that this iteration may diverge from the usual pattern.
Third, keep an eye on the broader wheat complex, including front-month futures and relative performance versus other grain ETFs. If wheat futures stabilize or rally on weather or export headlines while WEAT lags, tracking and roll effects could complicate the clean seasonal read. If futures and WEAT both weaken in tandem, the seasonal window would be unfolding inside a more classic macro wheat downturn.
Finally, the behavior of maximum adverse moves inside the window will matter as much as the final result. In past years, shorts have often had to tolerate 3% to 7% rallies before the pattern reasserted itself, so a sharp early bounce would not automatically invalidate the historical tendency. What would contradict the pattern is a sustained break above the 50-day moving average with follow-through buying across the full 10 days. Add it up: the late-June WEAT seasonal trend has been one of the cleaner short-side windows on the agricultural calendar, and how price behaves into and through Jun 18 will show whether 2026 wants to join the 9 winners or the lone outlier.
Sources
About this seasonal analysis
Seasonal pattern data is sourced from TradeWave.ai, which analyzes historical price behavior across annual calendar windows going back up to 30 years. Read the full data methodology or the book The 100-Year Pattern by Afshin Moshrefi (2026 edition). Past performance of seasonal patterns does not guarantee future results. This article is for informational purposes only and does not constitute investment advice.