Trust VIX Short-Term Futures ETF (VIXY) Jumps 8% as a 100% Bearish June Stretch Nears
Trust VIX Short-Term Futures ETF is jumping more than 8% even as it approaches a late-June seasonal window that has quietly delivered 10 straight years of downside for the volatility ETF.

What is the seasonal pattern for Trust VIX Short-Term Futures ETF (VIXY)?
Trust VIX Short-Term Futures ETF has fallen in 10 of 10 years during this late-June 27-day window, with an average gain of 10.6% for traders positioned short in winning years.
- 10 for 10 in this window, with Trust VIX Short-Term Futures ETF moving lower every year from 2016 through 2025 for short sellers.
- The 27-day trading window begins on Jun 18 and has delivered an average 10.6% profit for the short trade direction across winning years.
- Percent Profitable sits at 100%, with 10 winners and 0 losers over the past decade in this specific VIXY seasonal trend.
- The strongest year, 2016, saw a 18.79% net decline in VIXY during the window, while the softest outcome, 2018, still produced a 0.16% drop.
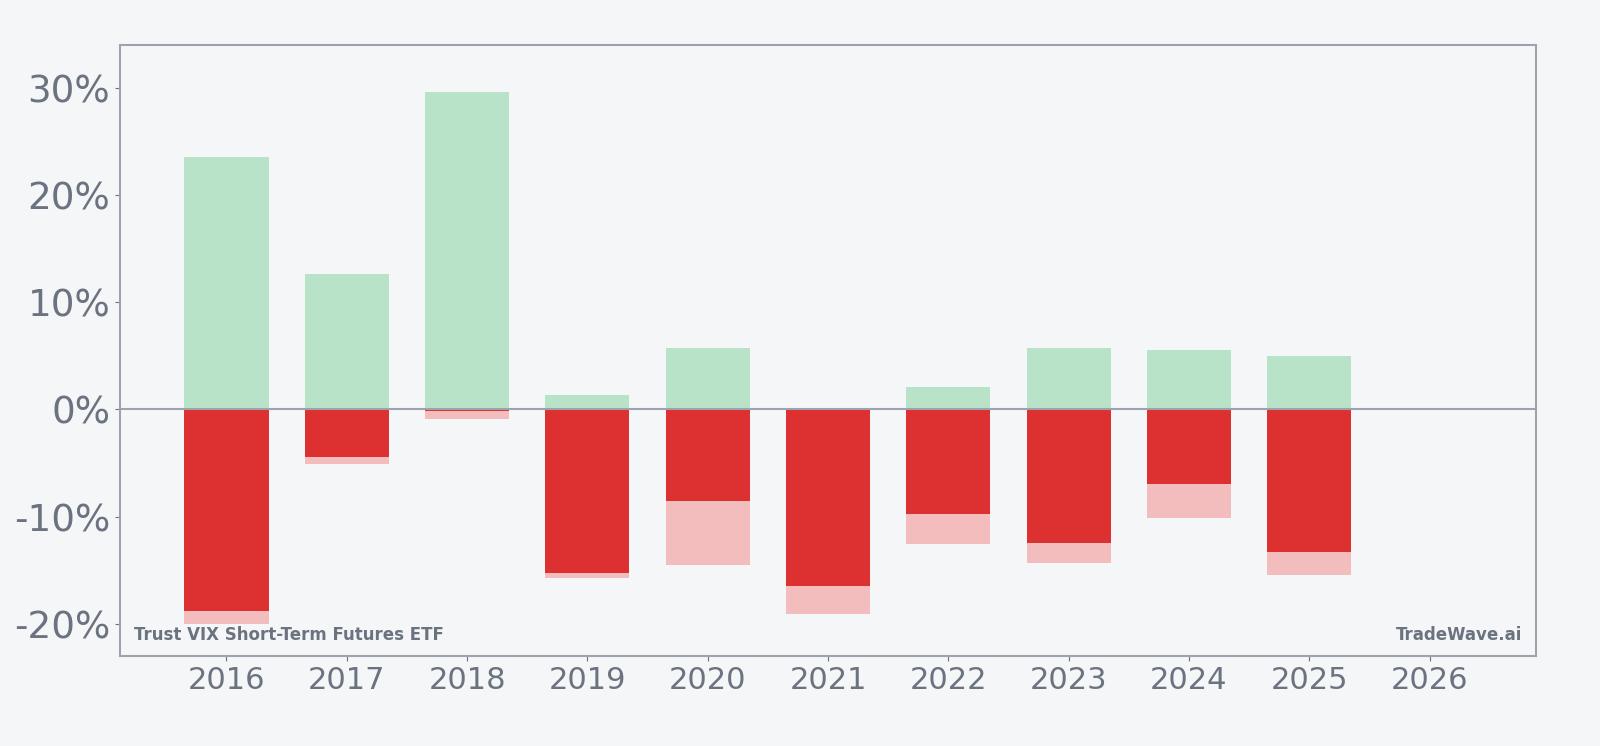
- Intraperiod swings have been large, with some years showing more than 20% adverse moves against the short before the trade finished in the green.
- Add it up: a 170% cumulative return for the short side across ten iterations of this Trust VIX Short-Term Futures ETF trading window.
According to historical data from TradeWave.ai, this late-June stretch has behaved very differently from an average month for VIXY, with a clear directional bias that most volatility traders never see quantified.
Seasonal window
Trust VIX Short-Term Futures ETF has declined in this 27-day window in every one of the past 10 years, a rare clean sweep for a volatility product. The next iteration of that window begins on Jun 18, with VIXY changing hands at 24.57 after an 8.4% jump today and sitting about 55.1% below its 52-week high of 54.68. For traders who traffic in volatility seasonality, that combination of a sharp single-day spike and a historically bearish late-June pattern is a setup that demands attention.
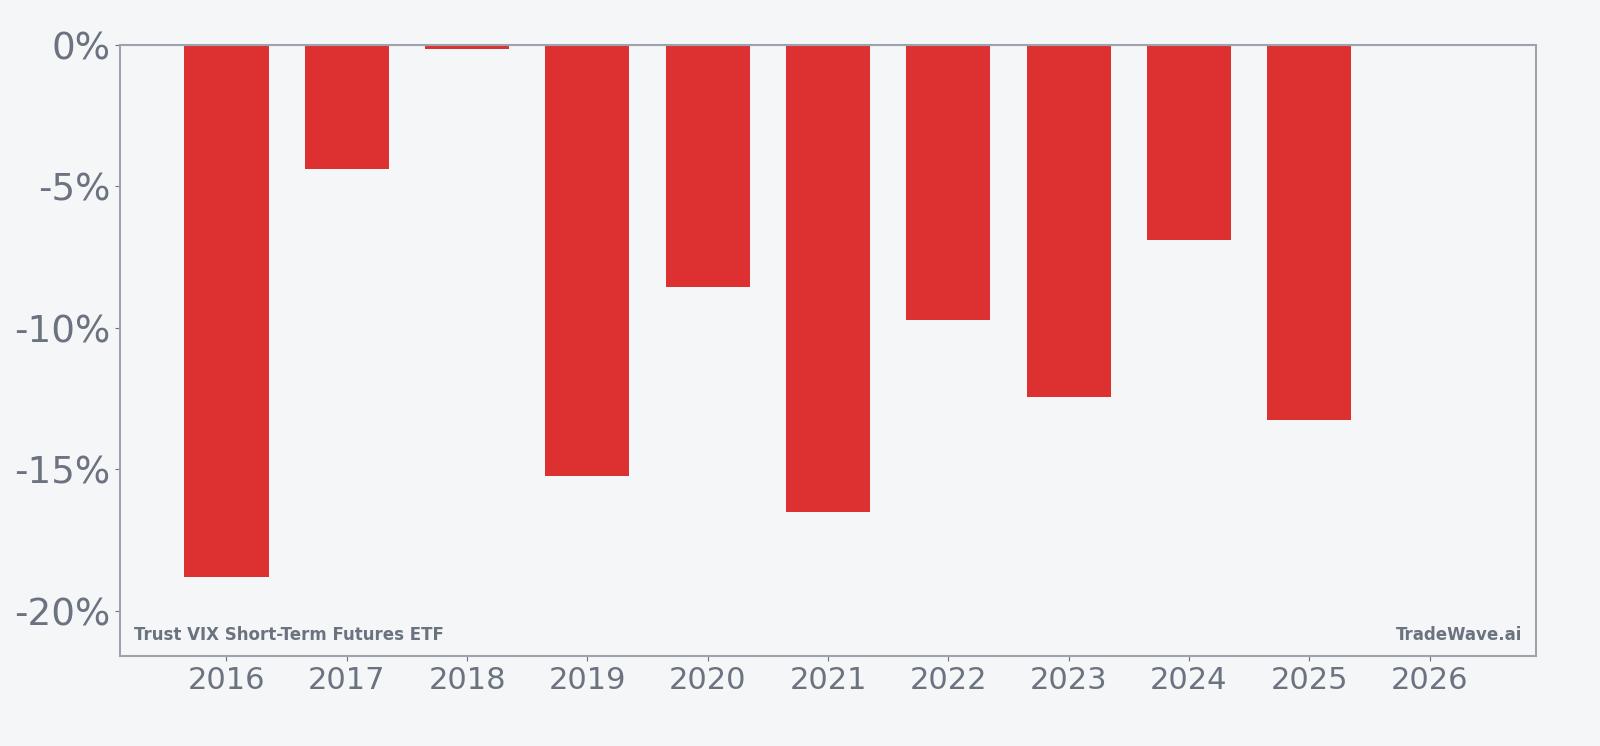
Year-by-year net returns and intraperiod swings show how consistently this window has favored shorts, even with sharp volatility spikes along the way.
Historically, the trade direction for this pattern is short, which means years where VIXY drifts or breaks lower are the “good” outcomes. Across the 2016 to 2025 sample, every iteration delivered a negative net return for the ETF in this window, from a modest 0.16% drop in 2018 to a 18.79% slide in 2016. Average profit for the short side clocks in at 10.6%, with a 170% cumulative gain across the decade, while the standard deviation of 5.77% points to meaningful but not chaotic dispersion.
The maximum favorable move inside the window has often been much larger than the final net result, which is where the TradeWave Ratio of 2.09 comes in. That metric captures how far price typically travels in the trade direction within the window, independent of where it finishes, and it suggests that intraperiod follow-through has been strong when VIXY starts to weaken. At the same time, maximum adverse excursions have been deep in several years, with 2016 and 2021 both showing more than 19% moves against the short before the trade ended profitably.
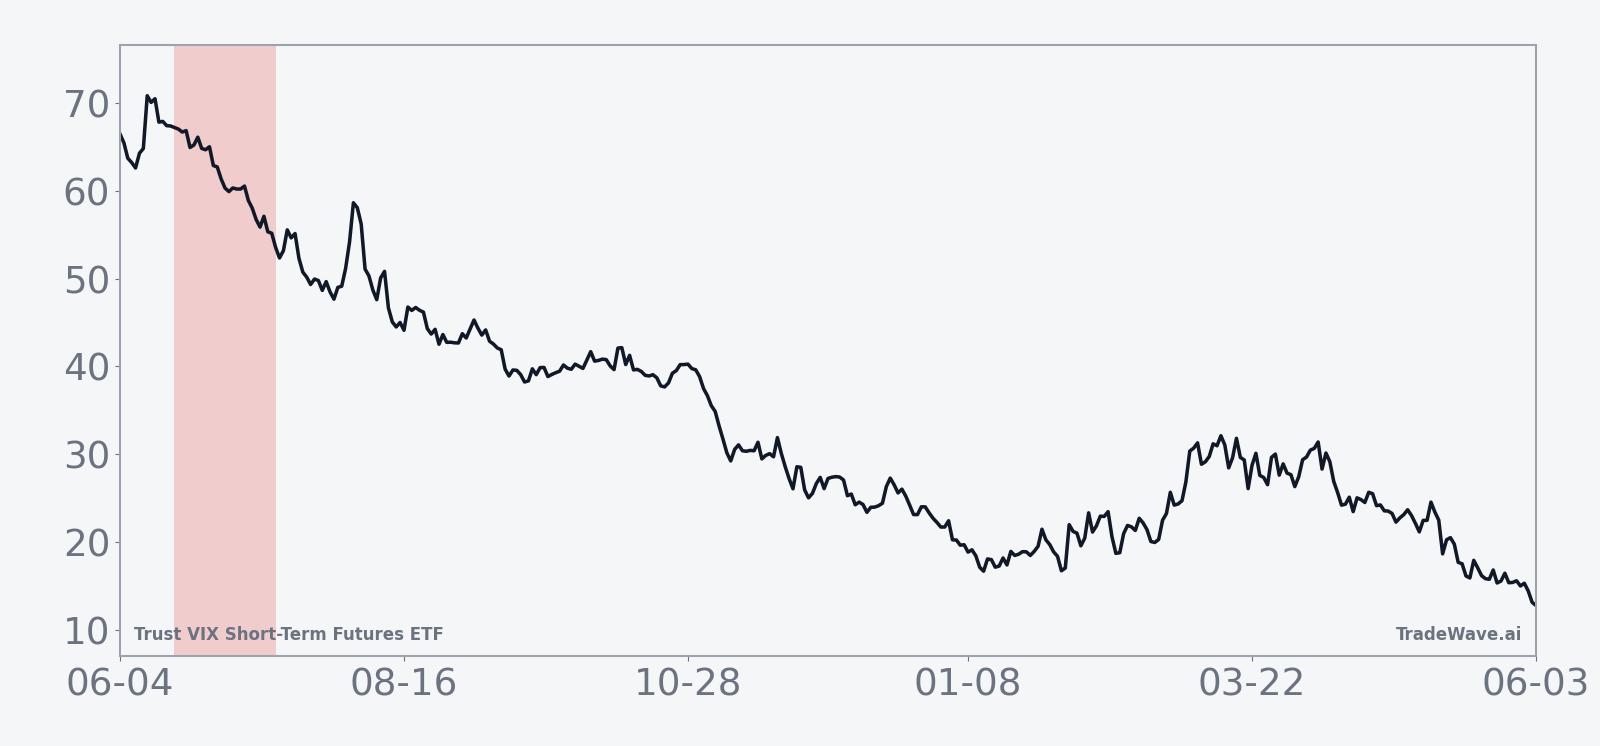
The trend view of the average seasonal path shows a fairly steady grind lower for VIXY across the 27 days rather than a single cliff event. In many years, the ETF has seen a brief early pop or sideways chop in the first week of the window, followed by a more persistent fade into the back half. That profile lines up with the idea that equity markets often stabilize or grind higher into early summer, pressuring volatility products even if there are occasional headline-driven spikes.
The cumulative return chart for this pattern reinforces the message. Instead of a jagged, mean-reverting line, the ten-year cumulative curve slopes consistently in favor of the short side, with only shallow pauses. There are no losing years in the sample, and the weakest outcome still left shorts essentially flat after weathering a sizable intraperiod rally in volatility.
Put simply, the pattern is clear: this late-June window has favored VIXY shorts in 10 of 10 years, with double-digit average gains for traders willing to sit through some sharp but historically temporary volatility bursts.
Why does Trust VIX Short-Term Futures ETF (VIXY) follow this seasonal pattern?
One likely driver is the way equity markets and volatility futures behave around the early-summer lull, when earnings are between seasons and macro calendars often thin out. Analysts have long pointed to institutional portfolio rebalancing and options expiration patterns in June as forces that can suppress implied volatility once big risk events pass. For an ETF that holds short-term VIX futures, that combination of calmer realized volatility and futures curve roll dynamics can translate into a steady bleed lower in prices during this specific slice of the calendar.
History does not guarantee future results; even in a window with a perfect track record, adverse excursions can be large and short volatility trades can move sharply against investors before resolving.
What is driving Trust VIX Short-Term Futures ETF (VIXY) today?
VIXY closed at 24.57 on Jun 8, up 1.90 points or 8.4% on the day, as traders rushed back into volatility exposure after a stretch of weakness that left the ETF about 55.1% below its 52-week high of 54.68 and only 9.4% above its 52-week low of 22.45. The move came on heavy volume of roughly 5.8 million shares versus a 20-day average of about 3.6 million, suggesting short covering and fresh hedging demand in a product that has dropped 9.46% over the past month and sits below its 50-day moving average of 28.13.
The chart below situates the latest spike in VIXY within its choppy, downward-sloping path over the past year and overlays the next 60 days of seasonal tendencies.
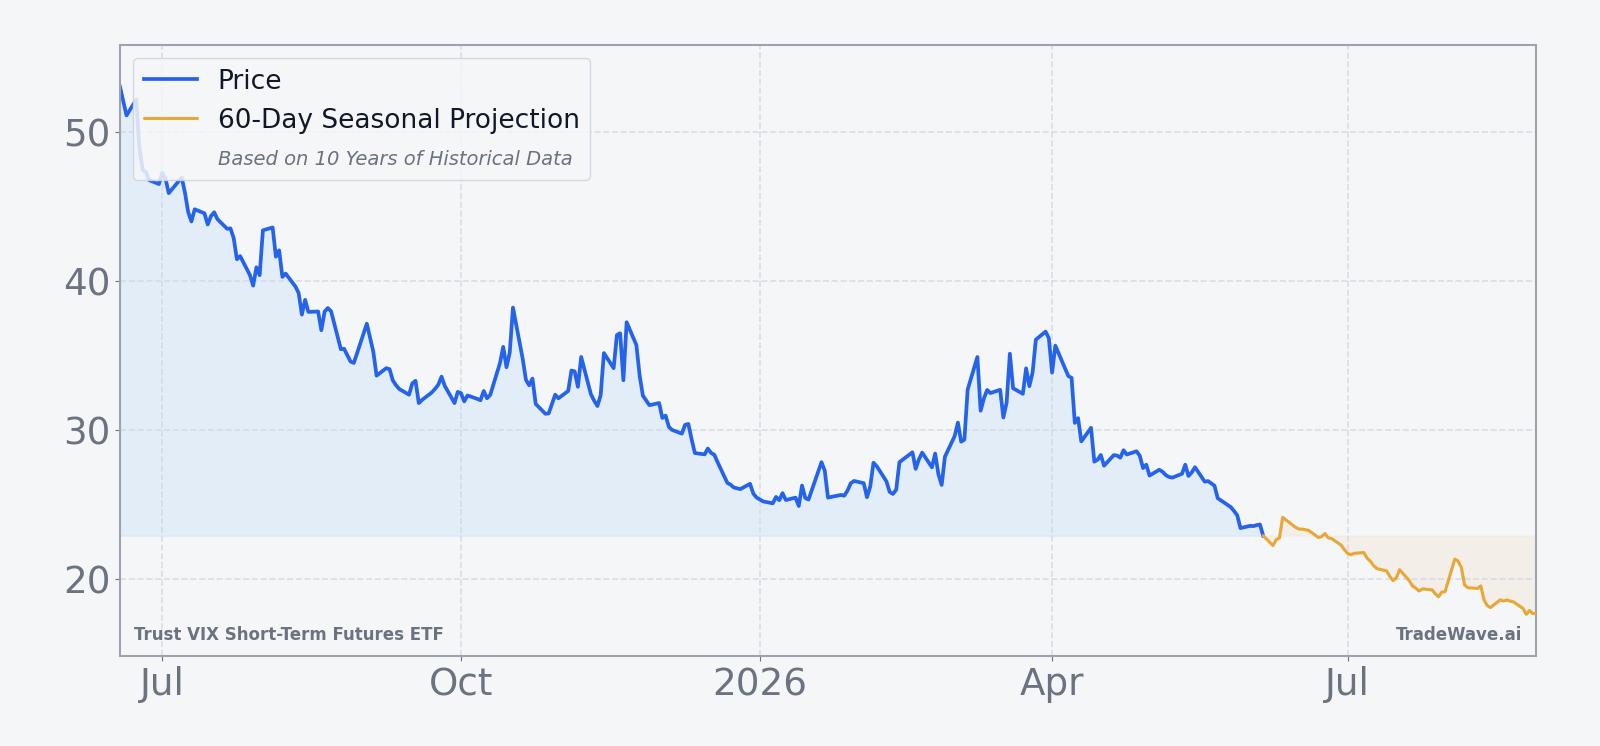
Structurally, Trust VIX Short-Term Futures ETF is designed to track a portfolio of front-month VIX futures, giving traders a liquid way to express views on near-term S&P 500 volatility rather than the index itself. That design means the ETF is highly sensitive to shifts in the VIX futures curve, roll yield, and the gap between implied and realized volatility, which can all move independently of headline equity levels. Over longer stretches, those mechanics have produced a persistent downward bias in VIXY’s price, punctuated by violent spikes when macro shocks or equity selloffs hit.
Against that backdrop, the upcoming seasonal window matters because it lines up with a period when realized volatility has often cooled after spring macro events, leaving short-term VIX futures under pressure. If equities stabilize into late June and early July as they have in many prior years, the historical pattern suggests that VIXY’s rallies during this window have tended to fade rather than extend. Traders watching this ETF will be focused on whether today’s surge proves to be the start of a sustained volatility regime shift or just another spike that fits neatly into a decade-long seasonal downtrend.
What should traders watch in this VIXY seasonal window?
First, watch how VIXY behaves as Jun 18 approaches: if the ETF remains elevated or pushes closer to the mid-20s and low-30s, the historical pattern suggests that late-window weakness has still tended to emerge for shorts. Second, monitor the S&P 500’s tone and realized volatility; a calm equity tape with shrinking intraday ranges would align with the past tendency for VIX futures and VIXY to grind lower through this 27-day stretch. Third, keep an eye on volume and positioning in VIXY and related volatility products: if today’s heavy trading persists without a corresponding pickup in realized volatility, it could signal that hedging demand is front-loaded and vulnerable to decay as the seasonal window unfolds.
Finally, the key tell will be whether any early spikes in VIXY during the window are sold into or build into a new volatility regime. In prior years, even sizable intraperiod rallies have ultimately given way to lower closes by the end of the window, which is why the TradeWave Ratio and the MAE profile both show large swings that still resolved in favor of the short side. A repeat of that behavior would reinforce the decade-long pattern, while a sustained break higher through the window would mark the first real challenge to one of the cleaner seasonal trends in the volatility ETF space.
Sources
About this seasonal analysis
Seasonal pattern data is sourced from TradeWave.ai, which analyzes historical price behavior across annual calendar windows going back up to 30 years. Read the full data methodology or the book The 100-Year Pattern by Afshin Moshrefi (2026 edition). Past performance of seasonal patterns does not guarantee future results. This article is for informational purposes only and does not constitute investment advice.