Teucrium Wheat (WEAT) Short Bias Builds With 90% Win Rate in This June Downside Run
Teucrium Wheat is edging higher ahead of a late-June stretch that has historically favored short positions, setting up a key seasonal test for wheat traders.

What is the seasonal pattern for Teucrium Wheat (WEAT)?
Teucrium Wheat has fallen in 9 of 10 years during this late-June 10-day window, with an average 3.58% gain in winning short years.
- 9 for 10 in this window, with winning short years averaging 3.58% gains and a 35% cumulative return over the decade.
- The 10-day Teucrium Wheat trading window begins on Jun 18 and has historically favored short exposure rather than long wheat bets.
- Percent Profitable sits at 90%, with 9 winners and just 1 loser for the short-side pattern across the 10-year lookback.
- Average profit across all years, including the lone losing season, is still a solid 3%, underscoring a persistent bearish seasonal bias.
- Intraperiod swings have been meaningful, with adverse moves against shorts large enough in some years to test risk limits before prices rolled over.
- The WEAT seasonal trend in this slice of June has typically seen weakness build through the window rather than a single one-day break.
According to historical data from TradeWave.ai, this upcoming stretch has behaved very differently from an average month on the wheat calendar, and the next iteration is just days away.
How has Teucrium Wheat (WEAT) traded in this late-June window?
Teucrium Wheat has delivered profitable short-side results in 9 of the past 10 years during the 10 trading days starting Jun 18, with winning years averaging 3.58% gains for bears. The ETF closed Tuesday at 22.51, up 0.6% on the day, after sliding 6.71% over the past month and trading well above its 52-week low of 19.78 but far below a 52-week high print of 121.75.[1] That combination of a recent pullback and a historically weak late-June seasonal pattern puts wheat traders on alert as the calendar rolls toward the new window.
Historically, this WEAT seasonal trend has been cleanly bearish for long holders. Percent Profitable at 90%, with 9 winners and 1 loser, means that in most years a short position entered at the start of the window and held for 10 trading days finished in the green. The average profit across all years is 3%, only slightly below the 3.58% average for winning years, which tells you the lone losing season did not fully offset the typical downside.
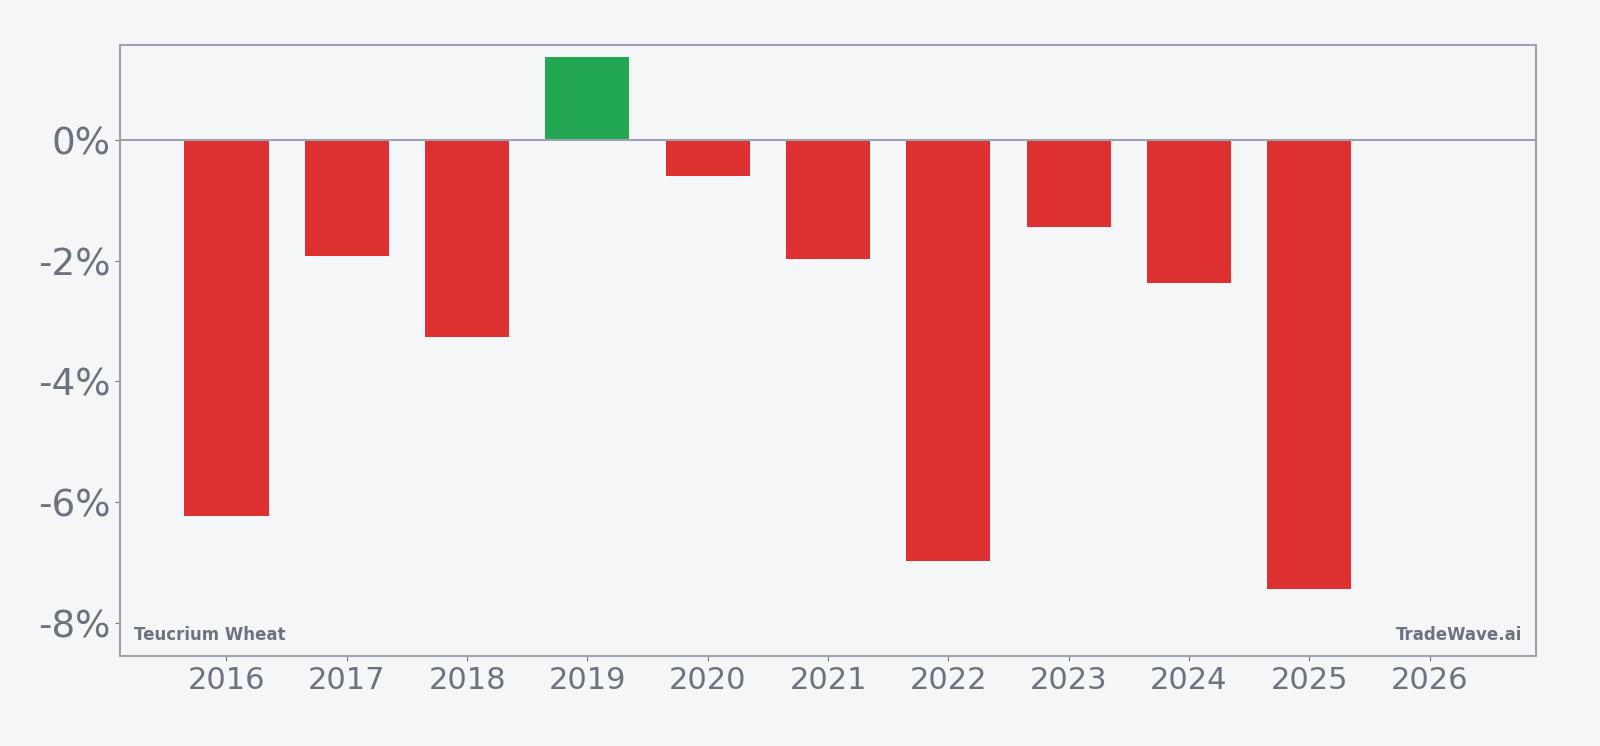
The per-year table shows that 2025 was the toughest year for longs in this slice of June, with WEAT dropping 7.44% over the window and suffering a worst intraperiod drawdown of 8.06% from the entry price before stabilizing. At the other end of the spectrum, 2019 stands out as the only losing year for shorts, with WEAT rising 1.37% over the window and posting a maximum favorable move of 2.57% for longs before giving back some of the rally. That mix illustrates how the pattern has usually rewarded short exposure but has occasionally delivered a squeeze against it.
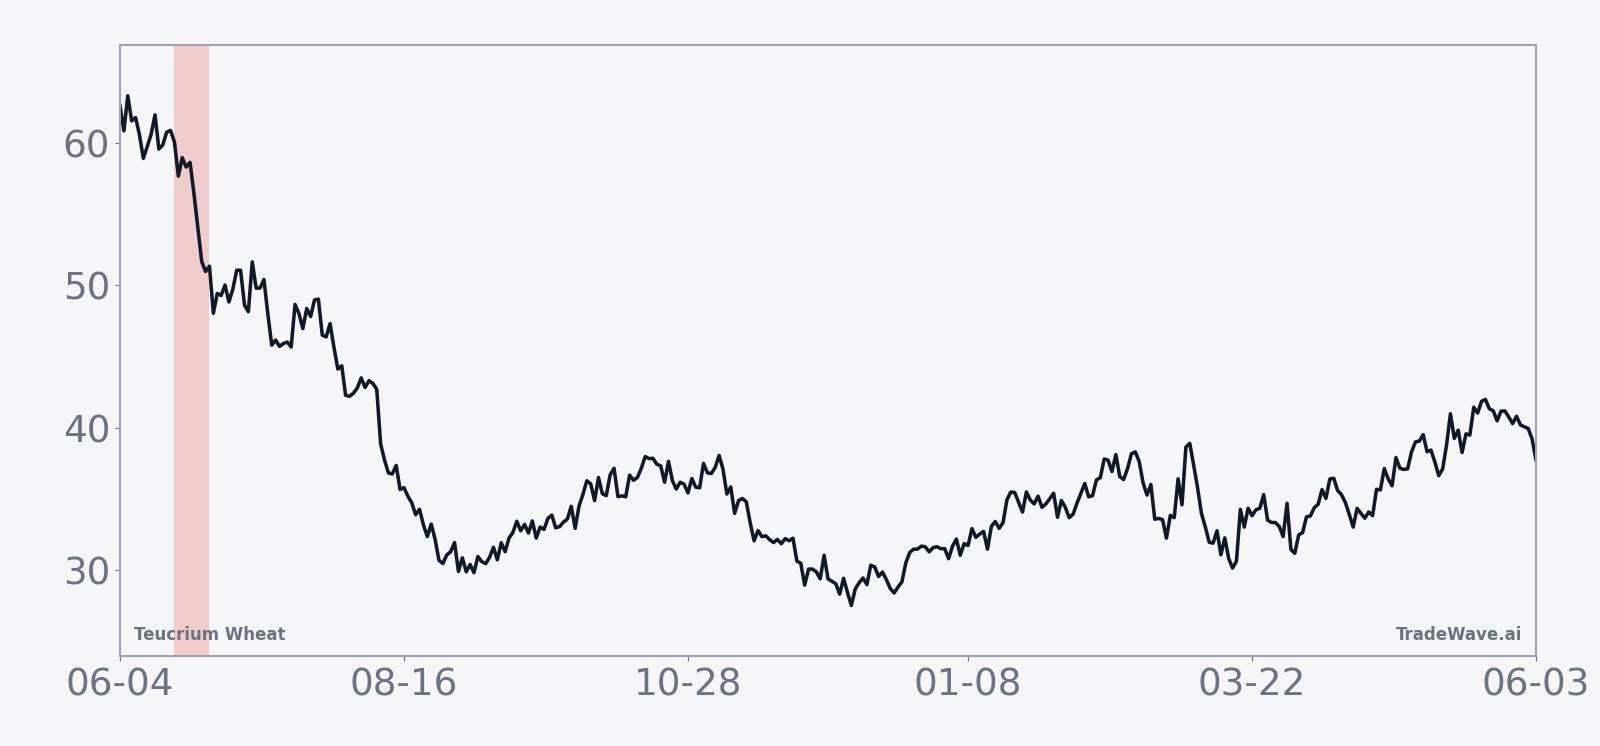
The historical seasonal average suggests that weakness in this window tends to build rather than appear as a single air pocket. The trend chart shows a gradual drift lower across the 10 days, with only brief pauses, which lines up with the idea of steady selling pressure rather than one-off event risk. For traders, that has meant more time to manage positions but also more temptation to fade the move too early.
Year-by-year net returns and intraperiod swings round out the picture of how far WEAT has typically moved in this window.
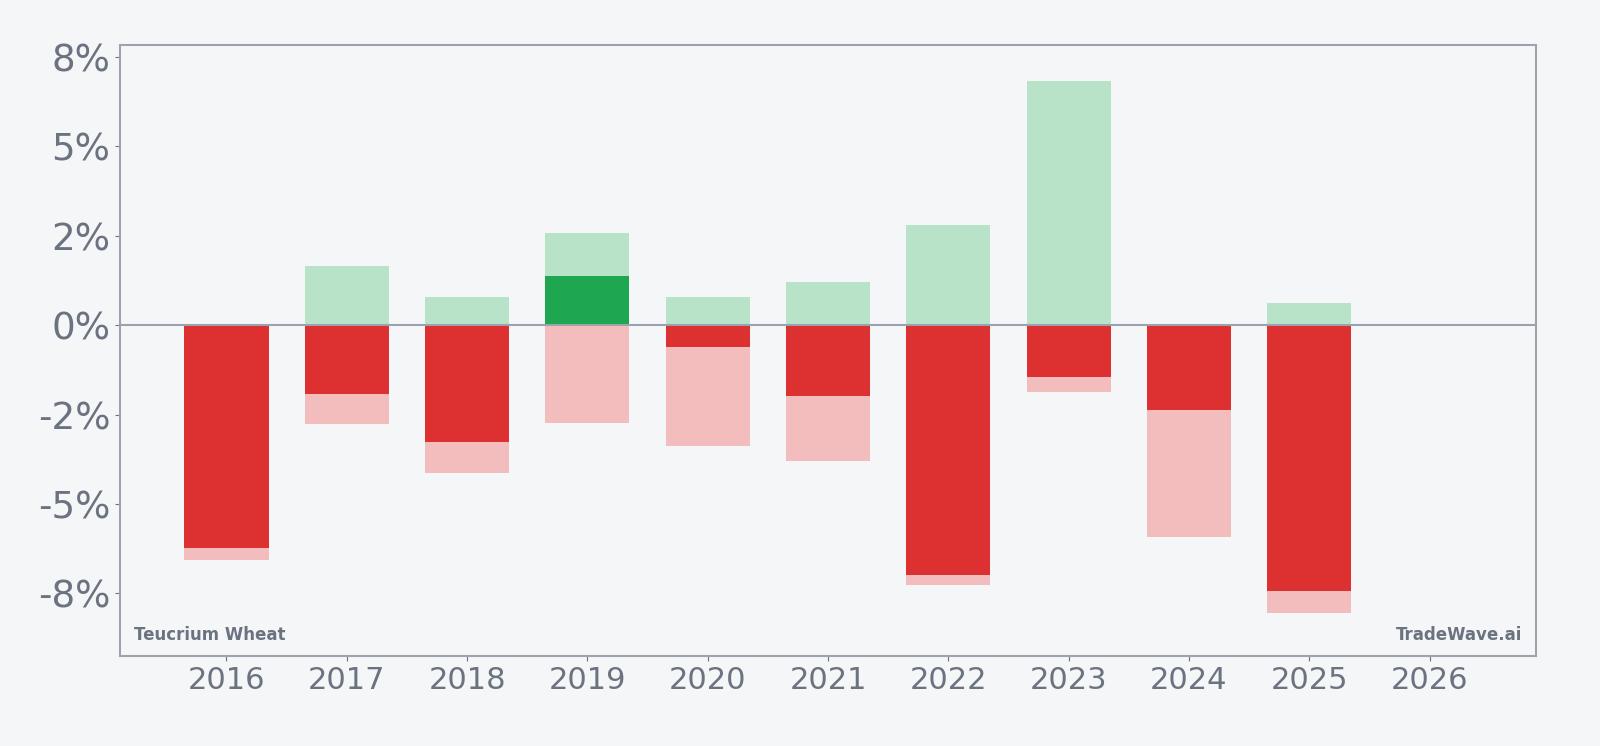
The combined net, maximum favorable excursion and maximum adverse excursion bars show that even in winning short years, WEAT has often staged countertrend rallies before rolling over. In 2023, for example, the ETF finished the window down 1.44% but saw a peak move of 6.82% in favor of longs at one point, a reminder that short setups can be right on direction yet painful on the path. The TradeWave Ratio of 2.12 captures this tendency for price to travel meaningfully in the trade direction within the window, while the Sharpe ratio of 1.03 points to a historically attractive risk-adjusted profile for the pattern.
Put it together and the message is simple: nine for ten. That is the record this late-June window carries into the 2026 cycle for traders using WEAT as their wheat proxy.
Why does Teucrium Wheat (WEAT) follow this seasonal pattern?
This late-June WEAT seasonal pattern likely reflects the grain market’s supply and demand calendar. One likely driver is the Northern Hemisphere growing season, when early crop condition reports and weather models around pollination can shift expectations for wheat yields and pressure prices. Analysts also point to hedging flows from producers and merchandisers during this period, which can add systematic selling pressure to wheat-linked instruments like WEAT.
History does not guarantee future results, and even in strong seasonal windows, maximum adverse excursions have been large enough in some years to challenge risk limits before the pattern ultimately played out.
What is driving Teucrium Wheat (WEAT) today?
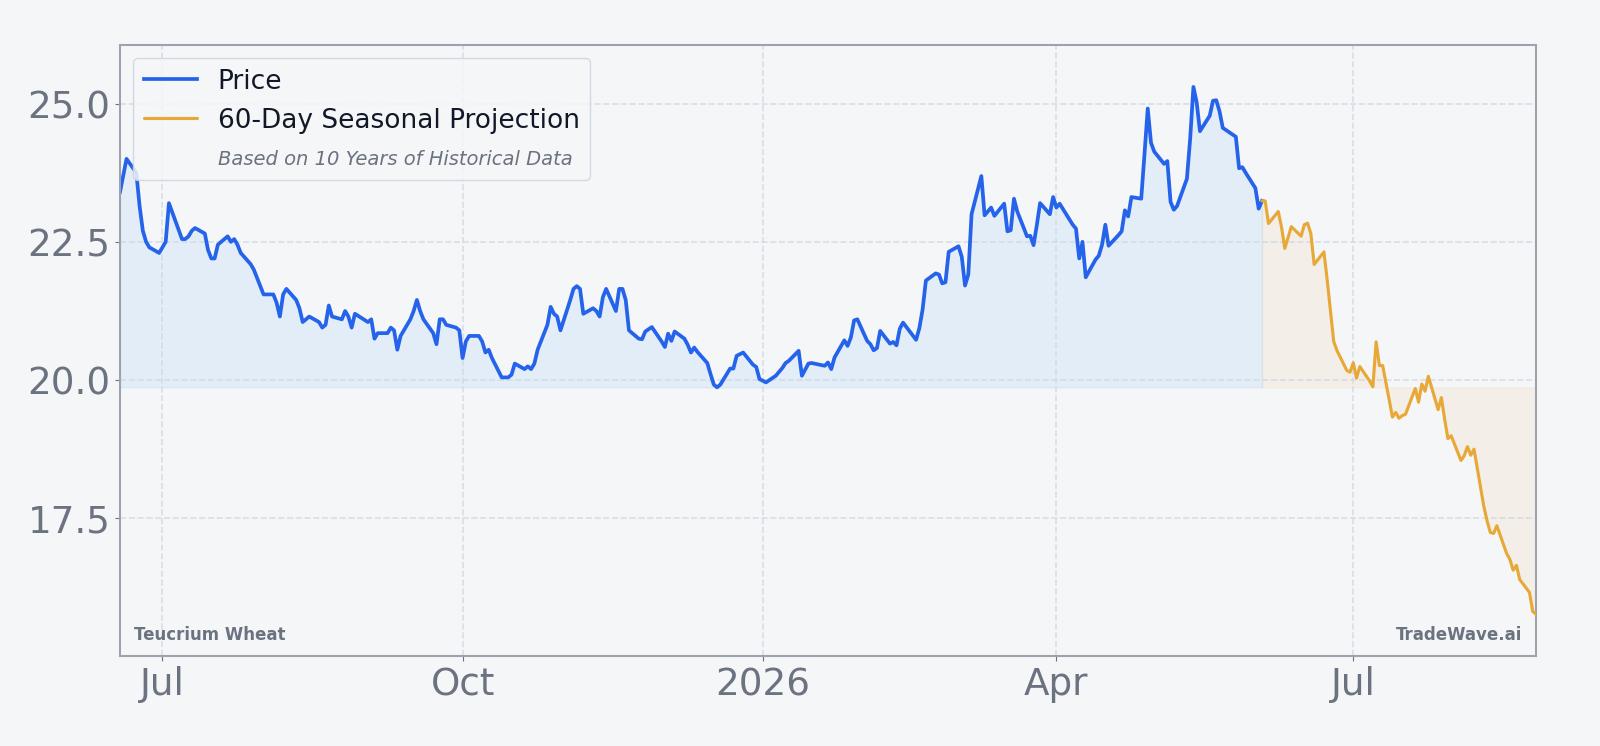
WEAT finished Tuesday at 22.51, up 0.56% on the day, as traders weighed a modest bounce against a 6.71% slide over the past month and a 12-month range that stretches from a low of 19.78 to a high print of 121.75.[1] Volume of about 520,000 shares came in below the 20-day average of roughly 843,000, suggesting positioning is still relatively light ahead of the seasonal window, while the ETF continues to trade under its 50-day moving average of 23.46, a sign that the short-term trend remains under pressure.[1]
The chart below situates the latest move in its recent multi-month context and overlays the upcoming seasonal projection.
Teucrium Wheat is structured to give investors exposure to wheat futures through a rules-based basket of Chicago Board of Trade contracts, making it a popular vehicle for both inflation hedgers and tactical commodity traders. Because the fund holds futures rather than physical grain, returns can diverge from spot wheat prices depending on the shape of the futures curve and the cost of rolling contracts, a factor that can either amplify or mute seasonal moves in the underlying market. For investors using WEAT as a proxy for food inflation or agricultural exposure, that means the late-June seasonal pattern is best viewed as a short-term trading tendency rather than a guarantee that wheat fundamentals are deteriorating every year at the same time.
What should traders watch in this WEAT seasonal window?
As Jun 18 approaches, the first thing to watch is whether WEAT continues to trade below its 50-day moving average or stages a stronger pre-window rally that could set up a more extended short squeeze.[1] Price action around the 20 to 23 range has been a key battleground over the past year, so how the ETF behaves in that band during the window will help confirm or challenge the historical pattern. A move that respects resistance near the 50-day average and then rolls over would rhyme with prior late-June seasons, while a decisive break higher that holds through the 10-day stretch would mark only the second losing year for shorts in the decade-long sample.
Flows into and out of WEAT will also matter, even though recent volume has been subdued. Rising turnover and heavier trading days as the window opens would signal that more investors are leaning into the wheat seasonal outlook, which can itself reinforce volatility. Finally, traders should monitor how closely WEAT tracks its benchmark wheat futures during this period, since curve shifts or roll costs can either sharpen or blunt the seasonal move. If the ETF lags a futures selloff or shrugs off a futures rally, that divergence will be a clue that structure, not just seasonality, is driving returns.
Sources
About this seasonal analysis
Seasonal pattern data is sourced from TradeWave.ai, which analyzes historical price behavior across annual calendar windows going back up to 30 years. Read the full data methodology or the book The 100-Year Pattern by Afshin Moshrefi (2026 edition). Past performance of seasonal patterns does not guarantee future results. This article is for informational purposes only and does not constitute investment advice.