CORN Extends Late-June Losing Streak, Trades Just Above 52-Week Low
CORN is trading just above its 52-week low with a historically bearish 10-day late-June seasonal window set to open this week.

What is the seasonal pattern for CORN (CORN)?
CORN has fallen in 10 of 10 years during this late-June 10-day window, with an average loss of 3.89% in winning short years.
- 10 for 10 in this window, with short trades averaging 3.89% gains when CORN moves lower.
- The upcoming seasonal window runs from Jun 18, 2026 and spans 10 trading days, historically a bearish stretch for CORN.
- Percent Profitable is 100%, with 10 winners and 0 losers for the short-side pattern across the past decade.
- Average winner returns cluster between roughly 2% and 6% declines in CORN over the 10-session window.
- Intraperiod swings have been meaningful, with best-case runs lower often paired with several percent of adverse bounces before the move resumes.
- The TradeWave Ratio of 2.82 and a Sharpe ratio of 1.94 point to a historically consistent short-biased window rather than a random corn-market chop.
According to historical data from TradeWave.ai, this late-June stretch has behaved very differently from an average month on the calendar for CORN. The next section walks through how that pattern has played out and what it means for traders watching the ETF this year.
How has CORN (CORN) traded in this late-June window?
CORN has dropped in every single iteration of this 10-day late-June window over the past decade, with short positions averaging 3.89% gains. The ETF closed Monday at 16.79, up 0.4% on the day but sitting just above its 52-week low of 16.61 and well below the 50-day moving average of 18.12. That combination of a persistent historical downside window and a fund already leaning toward the bottom of its recent range gives this year’s setup extra weight for corn-market watchers.
TradeWave’s stats frame this as a clean short-biased pattern. Percent Profitable sits at 100%, with 10 winners and 0 losers for the short direction across the past 10 years. Average profit for those winning shorts is 3.89%, while the median outcome is close at 3.7%, which suggests the window has tended to deliver fairly similar-sized moves rather than a few outliers doing all the work.
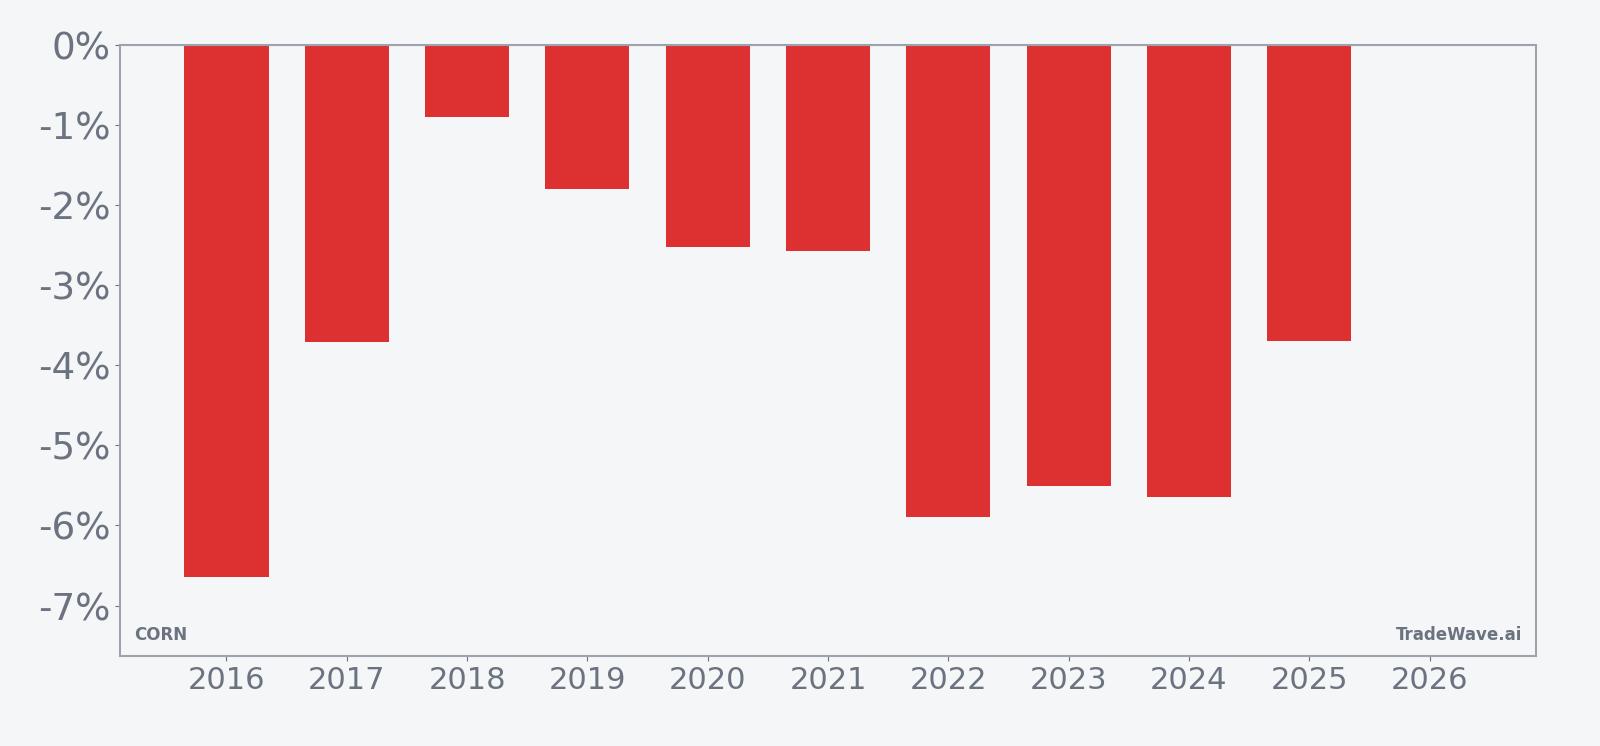
The per-year table shows that even the “milder” years still produced negative net returns for CORN in this slice of the calendar. The smallest decline was about 0.9% in 2018, while the largest drops came in 2016, 2022, 2023 and 2024, each in the 5% to 6.6% range over just 10 sessions. For a commodity ETF that often trades quietly, that is a meaningful move compressed into two trading weeks.
Intraperiod behavior has not been one-way. Maximum favorable excursion, or MFE, captures the best point-to-peak move in the trade direction during the window, and in strong years like 2023 it reached as much as 4.77% for shorts before the final close. Maximum adverse excursion, or MAE, tracks the worst drawdown from entry, and in several years it ran between 5% and 9%, meaning short sellers had to sit through sharp countertrend rallies before the pattern ultimately finished in their favor.
The TradeWave Ratio of 2.82 summarizes how far CORN has typically traveled in the short direction during this window, independent of the final close. Combined with a Sharpe ratio of 1.94 based on end-of-window outcomes, the numbers point to a pattern that has been both directional and relatively efficient for traders who timed it correctly, rather than a noisy stretch where gains were purely luck.
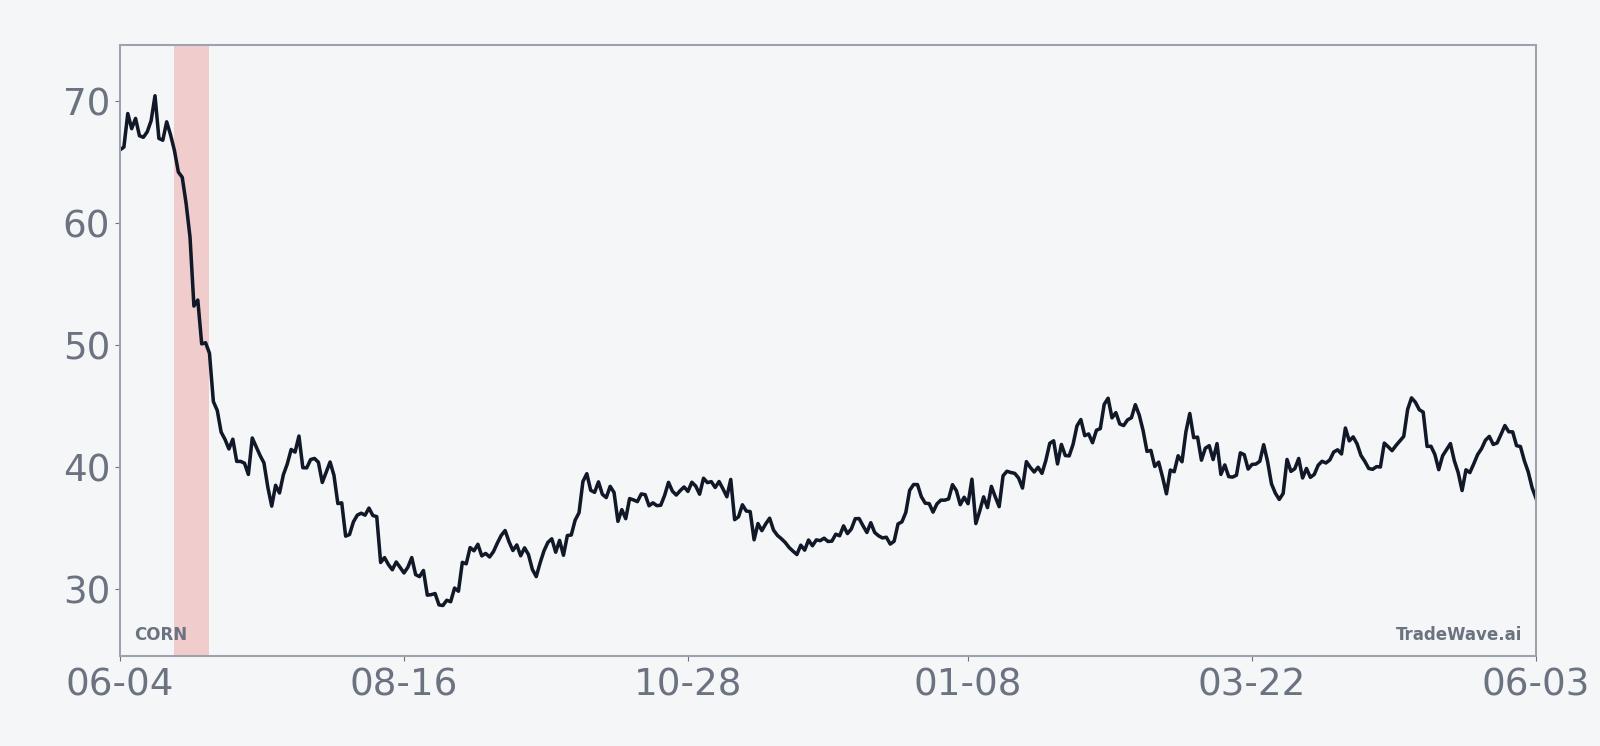
The historical seasonal trend chart smooths those individual years into an average path. It shows CORN typically starting the window with modest weakness, then accelerating lower into the middle sessions before flattening out toward the end. That shape suggests that, in prior years, the bulk of the move has often come in the first week rather than in a last-minute flush.
A combined view of net returns and intraperiod swings helps clarify how much room CORN has historically had to move inside this window.
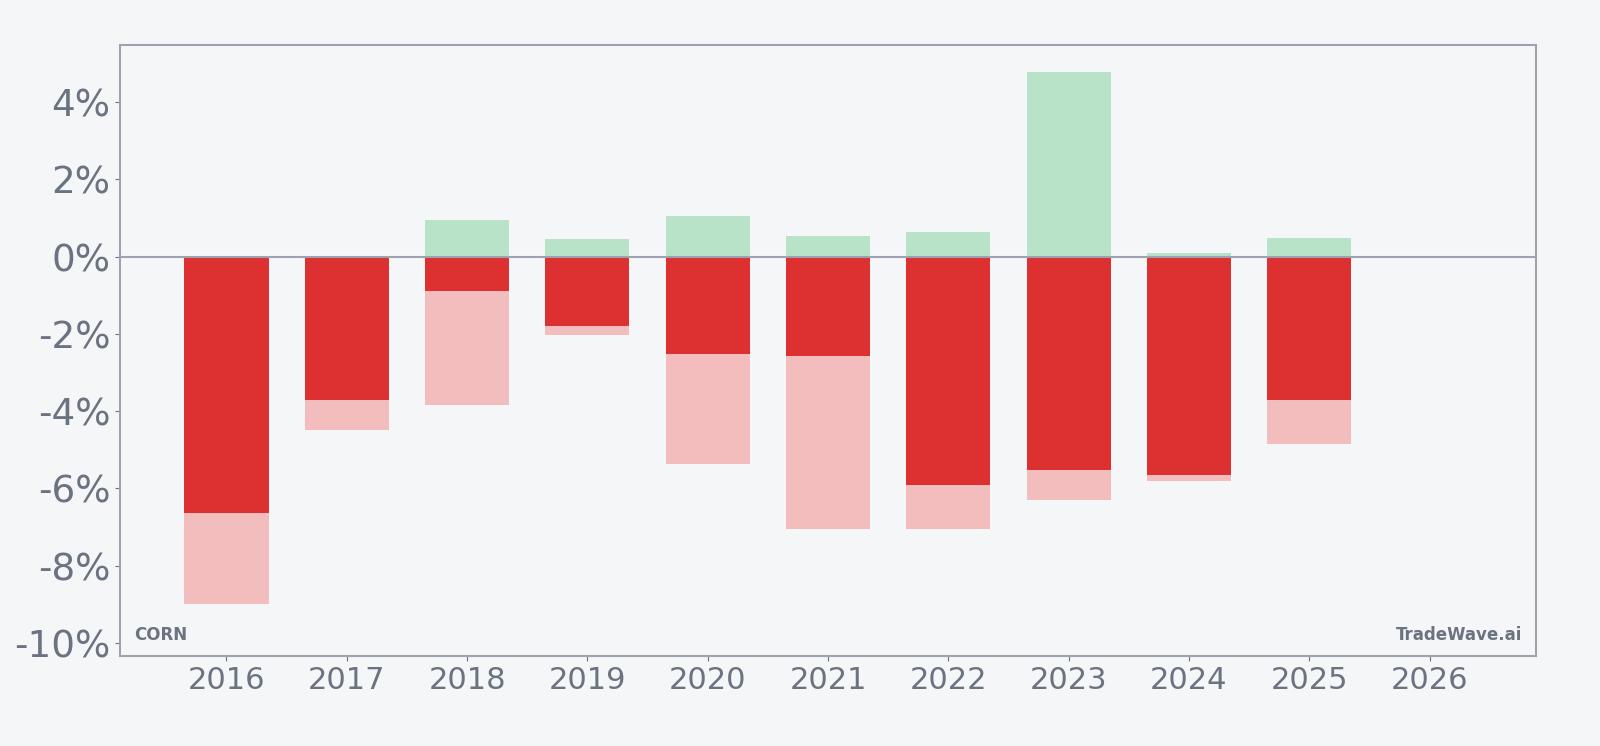
The stacked net/MFE/MAE bars make that volatility clear. In several years, shorts ultimately finished with 3% to 6% gains, but MAE readings of 5% to 9% show that CORN sometimes squeezed higher before rolling over, while MFE spikes confirm that once the move started, it could extend quickly. For traders, the message is that this has been a window where direction has been reliable, but the path has rarely been smooth.
History does not guarantee future results; adverse excursions can be large even in windows that have always finished in the same direction.
Why does CORN (CORN) follow this seasonal pattern?
This late-June pattern for CORN likely reflects the underlying corn market’s supply and demand calendar. One likely driver is the U.S. planting and early crop-condition cycle, when weather updates, acreage reports and early yield expectations can pressure prices as new supply prospects firm up. Analysts also point to hedging and rebalancing by producers and commodity funds around key USDA reporting dates, which can cluster selling pressure into a tight window on the calendar.
What is driving CORN (CORN) today?
CORN finished Monday at 16.79, up 0.07 on the day for a 0.4% gain, but the ETF remains about 12.2% below its 52-week high of 19.13 and only about 1.1% above its 52-week low of 16.61. Average 20-day volume sits around 521,585 shares, so Monday’s 246,355-share turnover was relatively light, consistent with a market that is marking time rather than reacting to a fresh macro shock. With the fund also trading below its 50-day moving average of 18.12, the near-term picture is one of a soft tape heading into a historically tricky seasonal stretch.
The chart below shows how that drift toward the bottom of the range lines up with a 60-day seasonal projection.
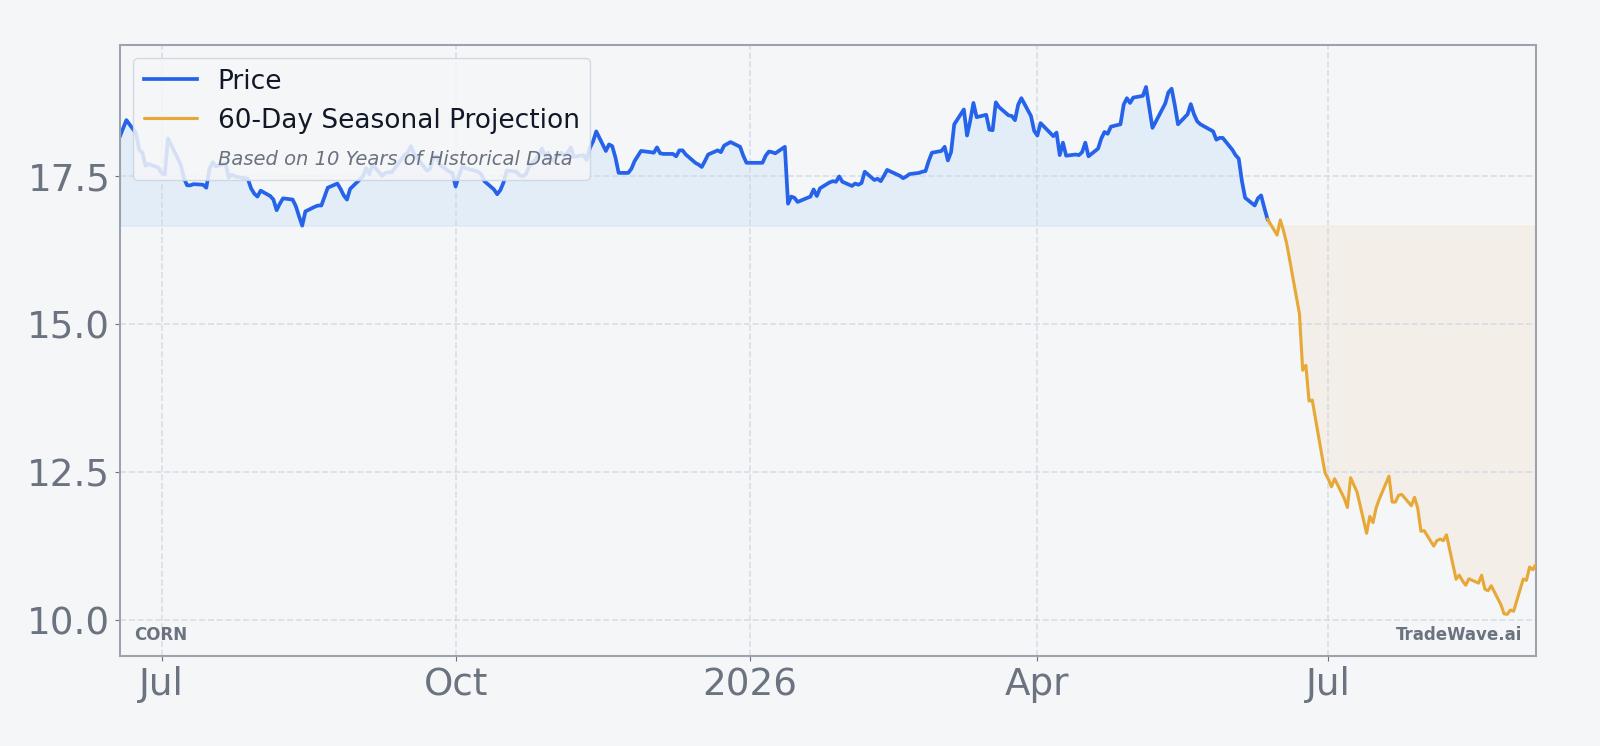
Structurally, CORN gives investors exposure to corn futures in a single ETF wrapper, so its behavior is tied to both front-month prices and the shape of the futures curve. When the market is in contango, roll costs can drag on returns even if spot prices are flat, while backwardation can help the fund outperform the underlying. That makes seasonal windows like this one especially relevant, because they capture not just price direction but also how roll dynamics and positioning have tended to line up at the same point in the crop year.
Against that backdrop, the upcoming 10-day window starting Jun 18 is less about a single data release and more about a recurring pattern in how traders have historically adjusted risk. In prior years, this has been a period when rallies have struggled to stick and when short exposure has been rewarded more often than not. For investors using CORN as a hedge against food inflation or as a tactical trading vehicle, understanding that backdrop can help frame expectations for volatility and direction as the calendar flips into the heart of the U.S. growing season.
What should traders watch in this CORN (CORN) window?
As the late-June window opens, the first thing to watch is whether CORN can hold above the 16.61 52-week low or whether that level gives way early in the 10-day stretch. A quick break and follow-through lower would be consistent with the historical pattern of early weakness, while a firm bounce off that floor would mark a clear departure from the typical seasonal script.
Second, monitor how intraday swings evolve relative to the past decade’s MFE and MAE profile. If CORN starts the window with sharp rallies of several percent that fade by the close, that would echo prior years where shorts ultimately won but had to weather squeezes along the way. Conversely, a calm tape with tight ranges would suggest that some of the usual weather and positioning catalysts are being absorbed more smoothly this time.
Finally, keep an eye on volume and flows into and out of the ETF as the window progresses. Rising turnover and heavier trading around any break of the recent range would signal that macro and commodity-focused investors are leaning into the move, while a quiet tape through the window would hint that the decade-long pattern is meeting a more indifferent market. How CORN behaves across these 10 sessions will show whether this unusually consistent seasonal trend still has bite in 2026 or is starting to fade.
Sources
About this seasonal analysis
Seasonal pattern data is sourced from TradeWave.ai, which analyzes historical price behavior across annual calendar windows going back up to 30 years. Read the full data methodology or the book The 100-Year Pattern by Afshin Moshrefi (2026 edition). Past performance of seasonal patterns does not guarantee future results. This article is for informational purposes only and does not constitute investment advice.