Trust VIX Short-Term Futures ETF (VIXY) Has Dropped in 10 of 10 Late-June Windows
Trust VIX Short-Term Futures ETF is sliding again as it approaches a late-June seasonal window that has delivered 10 straight years of downside for the ETF’s price.

What is the seasonal pattern for Trust VIX Short-Term Futures ETF (VIXY)?
Trust VIX Short-Term Futures ETF has fallen in 10 of 10 years during this late-June 26-day window, with an average 10.73% gain for short positions in winning years.
- 10 for 10 in this window, with short trades averaging 10.73% profit across winning years.
- Seasonal window starts Jun 19 and runs 26 trading days, targeting a short trade direction.
- Percent Profitable is 100%, with 10 winners and 0 losers over the past decade.
- Annualized return for the pattern is 10.66%, with a Sharpe ratio of 2.48 and a TradeWave Ratio of 2.74.
- Individual years have seen sizable swings, with maximum favorable moves above 20% in some cases and double-digit adverse moves inside the window.
- Cumulative return across the 10-year sample is 175% for the short pattern, underscoring how consistently VIXY has drifted lower in this slice of the calendar.
According to historical data from TradeWave.ai, this upcoming late-June stretch has behaved very differently from an average month for VIXY. The next section walks through how that pattern has played out and what it could mean for volatility traders watching this ETF.
How has Trust VIX Short-Term Futures ETF (VIXY) traded in this late-June window?
Trust VIX Short-Term Futures ETF has fallen in 10 of 10 years during the 26-day window that begins on Jun 19, with short positions averaging 10.73% profit when the pattern hits. That history is coming into view as VIXY closed Friday at 24.33, down 5.28% on the day and sitting about 55.5% below its 52-week high of 54.68 while hovering just above its 52-week low of 22.45.
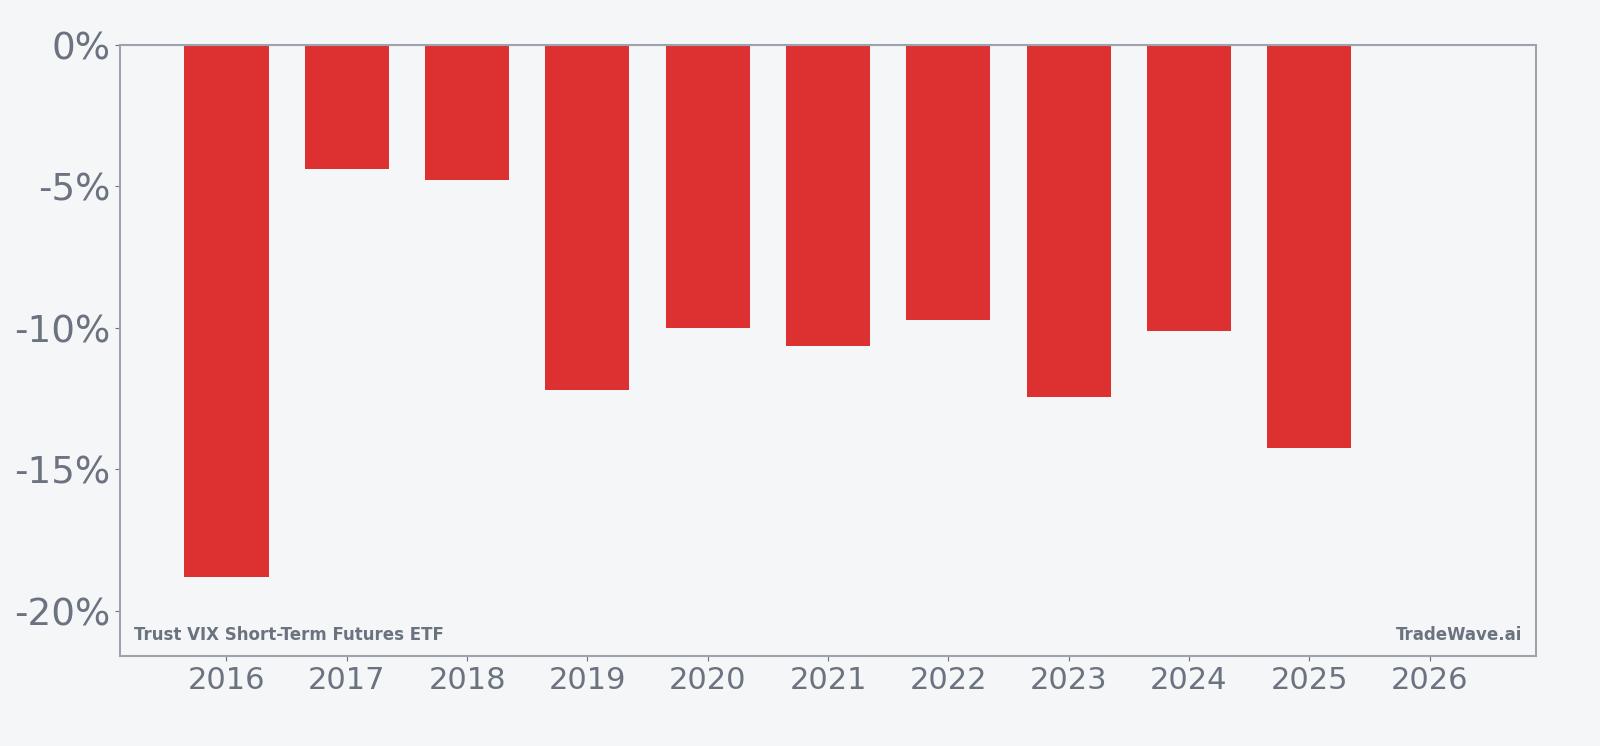
Across the 10-year sample, every iteration of this Trust VIX Short-Term Futures ETF trading window has ended with the ETF lower, which is favorable for the short trade direction. The strongest year in the dataset was 2016, when VIXY dropped 18.79% over the window, while the softest outcome was 2017, with a 4.40% decline. Even the milder years still finished in the red for the ETF’s price, which is unusual consistency for a volatility-linked product.
The average winner gain of 10.73% for shorts compares with a cumulative 175% return across all 10 windows, a profile that lines up with the elevated Sharpe ratio of 2.48. In plain English, the pattern has not just been positive; it has been relatively smooth compared with the swings inside each window. The annualized return of 10.66% for the strategy reflects how this narrow slice of the calendar has stacked up over time.
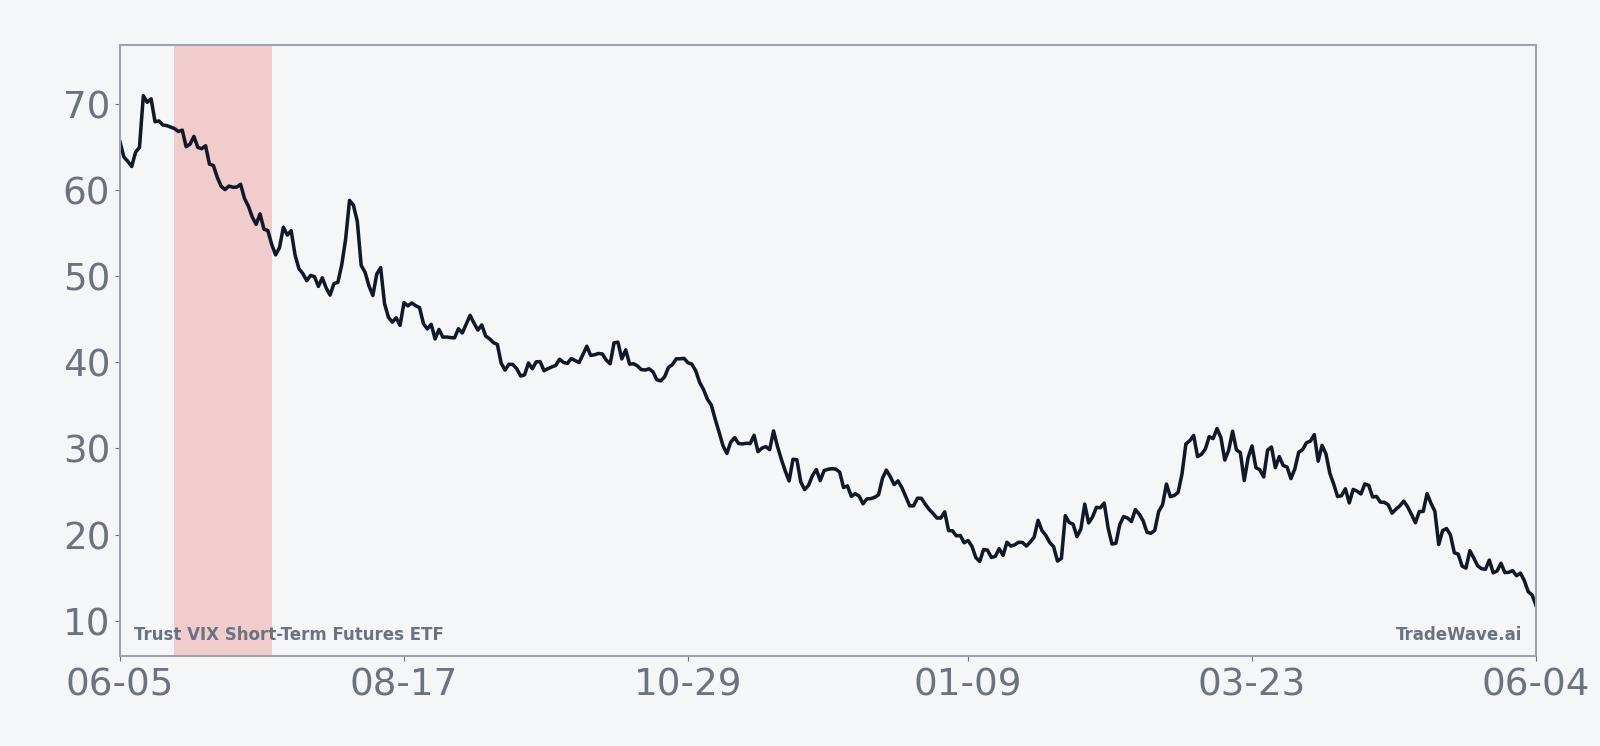
The historical seasonal trend chart shows VIXY typically starting the window with a modest drift lower, then accelerating to deeper declines into the back half of the 26 days. That shape suggests the short pattern has often paid off more decisively later in the window, even if early days can be choppy.
A second view combines yearly net results with the best and worst intraperiod swings to show how far VIXY has tended to move inside the window.
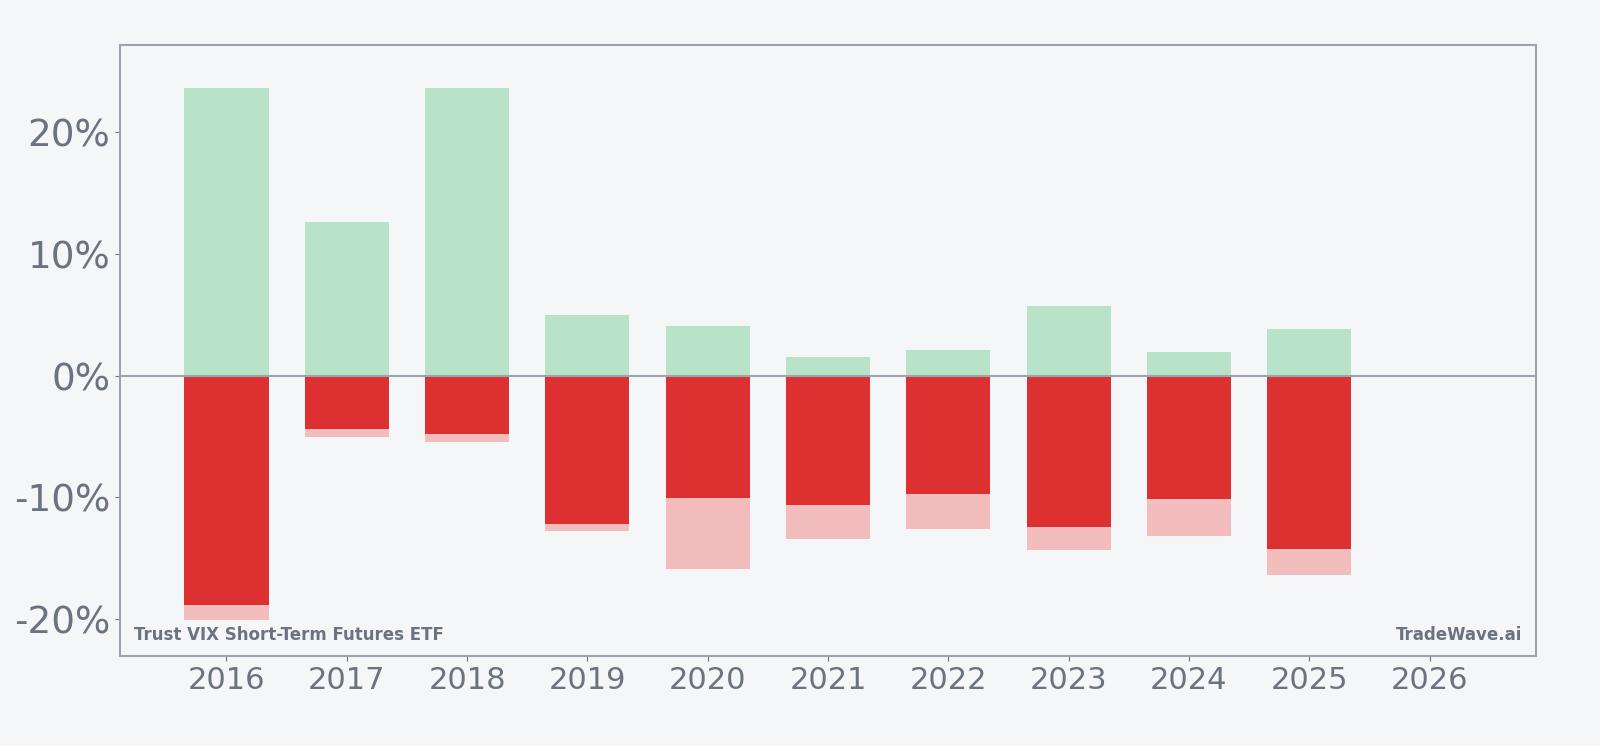
The combined net/MFE/MAE view shows that in strong years like 2016, VIXY’s price fell sharply while also experiencing a maximum favorable move for shorts above 20%, but even quieter years still saw several percentage points of adverse excursion before the pattern finished lower. Maximum adverse moves have reached into the mid-teens in some years, which means short trades have historically had to sit through sizable rallies in VIXY before the seasonal tendency reasserted itself.
History does not guarantee future results; adverse excursions can be large even in winning windows, and volatility products like VIXY can move quickly in both directions.
Why does Trust VIX Short-Term Futures ETF (VIXY) follow this seasonal pattern?
This late-June VIXY seasonal trend likely reflects how equity markets and volatility futures behave around the early summer lull, when realized volatility often fades and VIX futures curves tend to steepen. One likely driver is institutional portfolio positioning, as managers rebalance after midyear index changes and reduce hedges when macro calendars thin out. That combination can pressure short-term VIX futures and, by extension, VIXY, creating a recurring window where the ETF has historically drifted lower.
What is driving Trust VIX Short-Term Futures ETF (VIXY) today?
VIXY dropped 5.28% on Friday to 24.33, extending a one-month slide of 10.68% as the ETF trades well below its 50-day moving average of 27.17 and sits just above its 52-week low of 22.45. Volume of about 4.1 million shares was slightly above the recent 20-day average of roughly 3.9 million, a sign that traders are still using the fund actively even as volatility expectations grind lower.
The chart below situates the latest move against the past year of trading and overlays a 60-day seasonal projection.
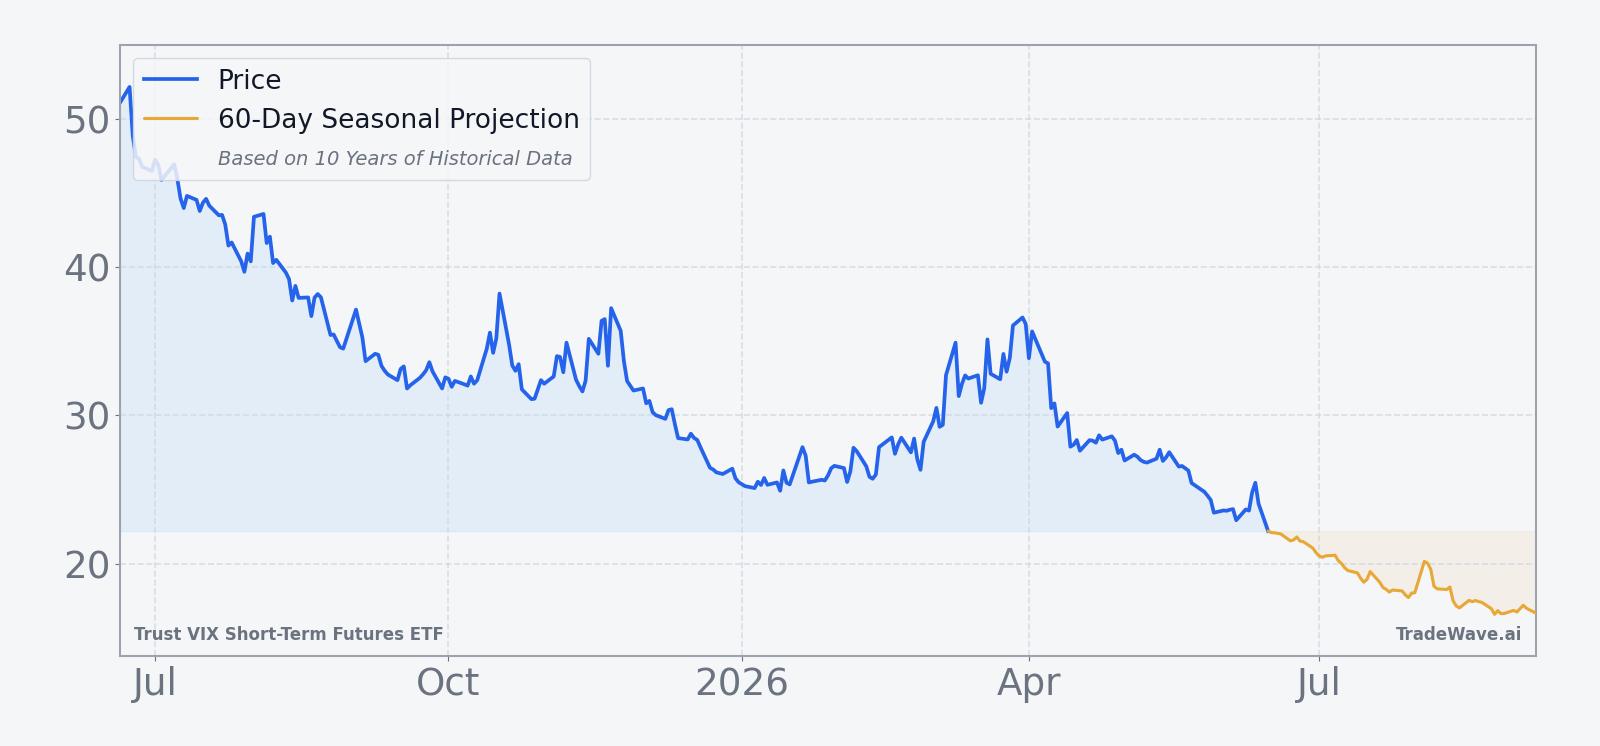
Trust VIX Short-Term Futures ETF tracks a portfolio of short-term VIX futures, so its price tends to fall when equity markets are calm and the VIX futures curve is in contango, with longer-dated contracts priced above near-term ones. The recent decline lines up with that classic volatility crush backdrop, where realized stock-market swings have been contained and demand for downside protection has eased. For traders, VIXY’s weakness is less about company fundamentals and more about how the volatility complex is being repriced day to day.
Against that backdrop, the upcoming late-June seasonal window matters because it has historically coincided with a period when volatility continues to bleed out rather than spike. If equity markets stay orderly and macro headlines remain manageable, the pattern suggests VIXY has often struggled to sustain rallies during this stretch, even when intraday spikes appear. For investors using VIXY as a hedge, that history is a reminder to think carefully about timing and holding periods around early summer.
What should traders watch as this VIXY seasonal window approaches?
First, watch how VIXY behaves as it approaches the 22 to 23 area that has defined its 52-week low zone. A decisive break below that band during the window would be consistent with the historical pattern of further downside, while a sustained bounce that holds above the 50-day moving average would mark a clear departure from the past decade’s behavior.
Second, monitor realized volatility in major equity benchmarks and the shape of the VIX futures curve. The seasonal pattern has tended to work best when realized volatility stays muted and the curve remains steep, conditions that naturally pressure short-term VIX futures and VIXY. A sudden macro shock that flattens or inverts the curve would be the main scenario where the historical VIXY seasonal trend could fail.
Finally, keep an eye on trading volumes and ETF flows around the start of the window. Rising volume on down days would suggest traders are leaning into the existing volatility crush, while heavy inflows into VIXY on a spike could signal hedging demand that cuts against the usual late-June drift. How those flows evolve through the 26-day stretch will help confirm whether this year is tracking the historical VIXY seasonal trend or breaking from it.
Sources
About this seasonal analysis
Seasonal pattern data is sourced from TradeWave.ai, which analyzes historical price behavior across annual calendar windows going back up to 30 years. Read the full data methodology or the book The 100-Year Pattern by Afshin Moshrefi (2026 edition). Past performance of seasonal patterns does not guarantee future results. This article is for informational purposes only and does not constitute investment advice.