6-for-6: Nasdaq QQQ Invesco ETF (QQQ) Has Rallied Every Midterm Window, Averaging 19.97% Gains
Nasdaq QQQ Invesco ETF is pushing higher again, and an approaching midterm-year seasonal window with a perfect track record puts extra focus on how tech trades into 2027.

What is the seasonal pattern for Nasdaq QQQ Invesco ETF (QQQ)?
Nasdaq QQQ Invesco ETF has risen in 6 of 6 midterm-election-year windows starting around late June, with an average gain of 19.97% in winning years.
- 6 for 6 in this window, with winning years averaging 19.97% gains across the last six midterm election years.
- Seasonal window begins Jun 25, 2026 and runs 364 trading days, covering the back half of the midterm year into the pre-election year.
- Percent Profitable is 100%, with 6 winners and 0 losers in the historical sample.
- Cumulative return across those six windows totals 196%, with a Sharpe ratio of 3.04 on end-of-window outcomes.
- TradeWave Ratio of 2.9 signals that QQQ has typically traveled meaningfully in the long direction during this stretch.
- Intraperiod drawdowns have still been sharp at times, with adverse moves as deep as roughly 22% in individual years before recovering.
According to historical data from TradeWave.ai, this midterm-year stretch has behaved very differently from an average calendar year for QQQ, and the next iteration is about to start.
How strong is the upcoming seasonal window for Nasdaq QQQ Invesco ETF (QQQ)?
Nasdaq QQQ Invesco ETF has posted gains in all six prior midterm-election-year windows that start in late June and run for roughly a year, averaging 19.97% in those winning stretches. Today QQQ closed at 717.30, up 3.4% on the day and about 4.2% below its 52-week high of 748.65, leaving it near the top of its recent range.[1] That combination of a strong historical seasonal trend and a price sitting just shy of record territory is what has traders watching this next window so closely.
Because this pattern is grouped by the presidential election cycle, it specifically tracks how QQQ has behaved in the back half of the midterm election year and into the following pre-election year, rather than across consecutive calendar years. That matters for a tech-heavy ETF like QQQ because policy shifts, regulation debates and fiscal priorities often follow a repeatable rhythm across the four-year cycle, shaping risk appetite for growth stocks in ways that do not show up in simple January-to-December averages.
This seasonal window begins on Jun 25, 2026 and spans 364 trading days. Historically, during this period, Nasdaq QQQ Invesco ETF has shown a strong bullish tendency in the long direction, with all six midterm-year samples finishing higher. The annualized return across those windows clocks in at 19.87%, with a cumulative gain of 196% when you stack the six cycles together.
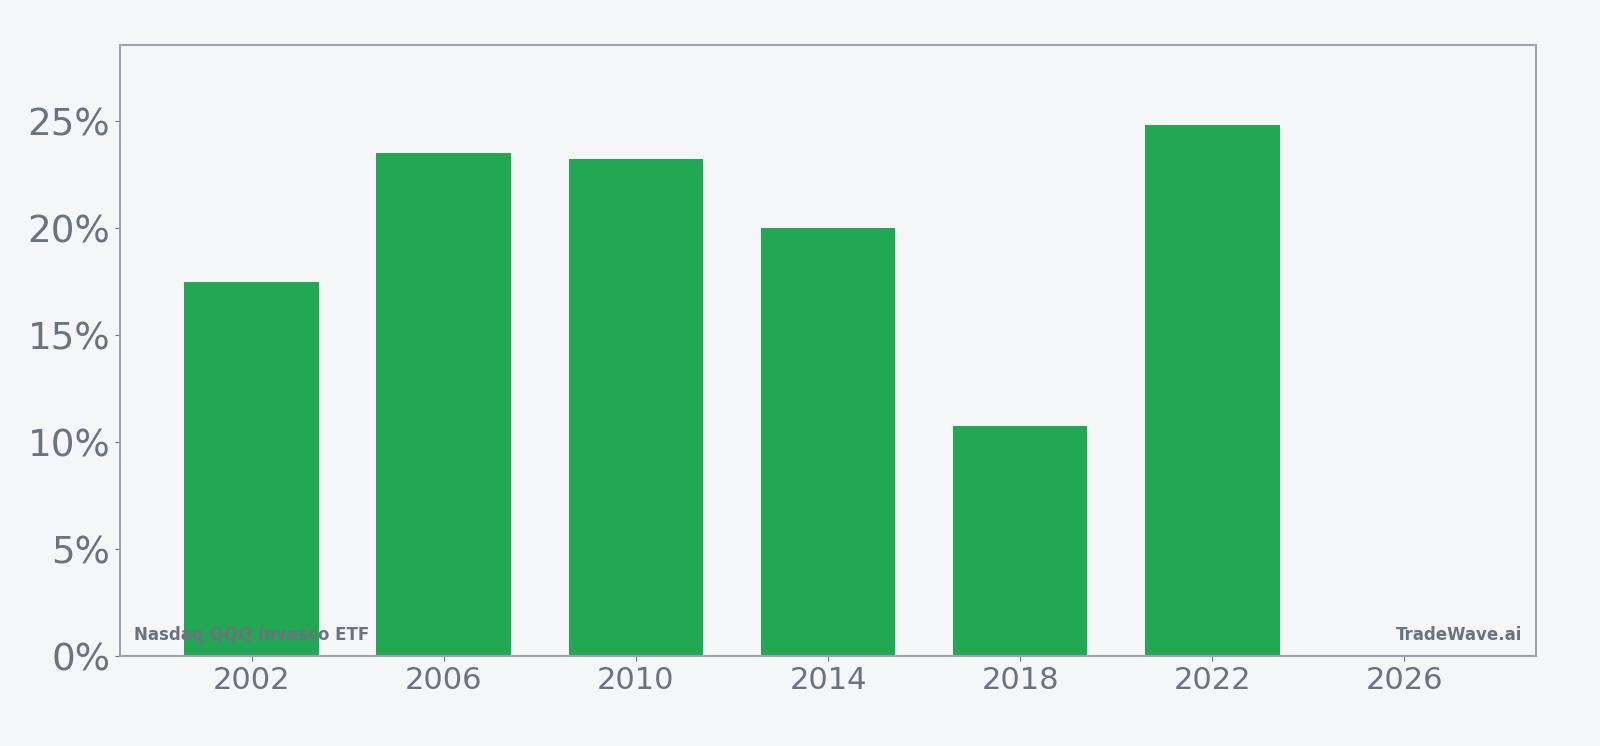
The win-loss record is unusually clean for a broad ETF. Percent Profitable sits at 100%, with 6 winners and 0 losers in the sample. Average profit in those winning years is 19.97%, and the median outcome is slightly higher at 21.62%, which tells you the gains have not been driven by a single outlier year.
Looking at individual cycles, the weakest net return in the sample came in 2018, when QQQ still gained 10.75% from entry to exit despite a volatile year for tech. The strongest net result was 24.85% in 2022, when the ETF rallied from 285.71 to 356.71 over the window. In between, years like 2006 and 2010 delivered gains in the low-20% range, reinforcing the sense of a consistent QQQ seasonal trend rather than a one-off anomaly.
Intraperiod swings have been meaningful, which is where the MFE/MAE profile comes in. Maximum favorable moves have ranged from about 12% to more than 31% in individual years, showing that when QQQ has trended higher in this window, it has often done so with sizable upside bursts. On the downside, maximum adverse excursions have stretched as deep as roughly 22% in 2002 and around 16% in 2018 before the ETF recovered into positive territory by the end of the window.
The TradeWave Ratio of 2.9 indicates that, on average, QQQ has tended to travel substantially in the long direction during this stretch, independent of where it ultimately closed. Combined with a Sharpe ratio of 3.04 on end-of-window returns, the pattern points to a historically favorable risk-reward profile for long exposure during this specific midterm-to-pre-election span.
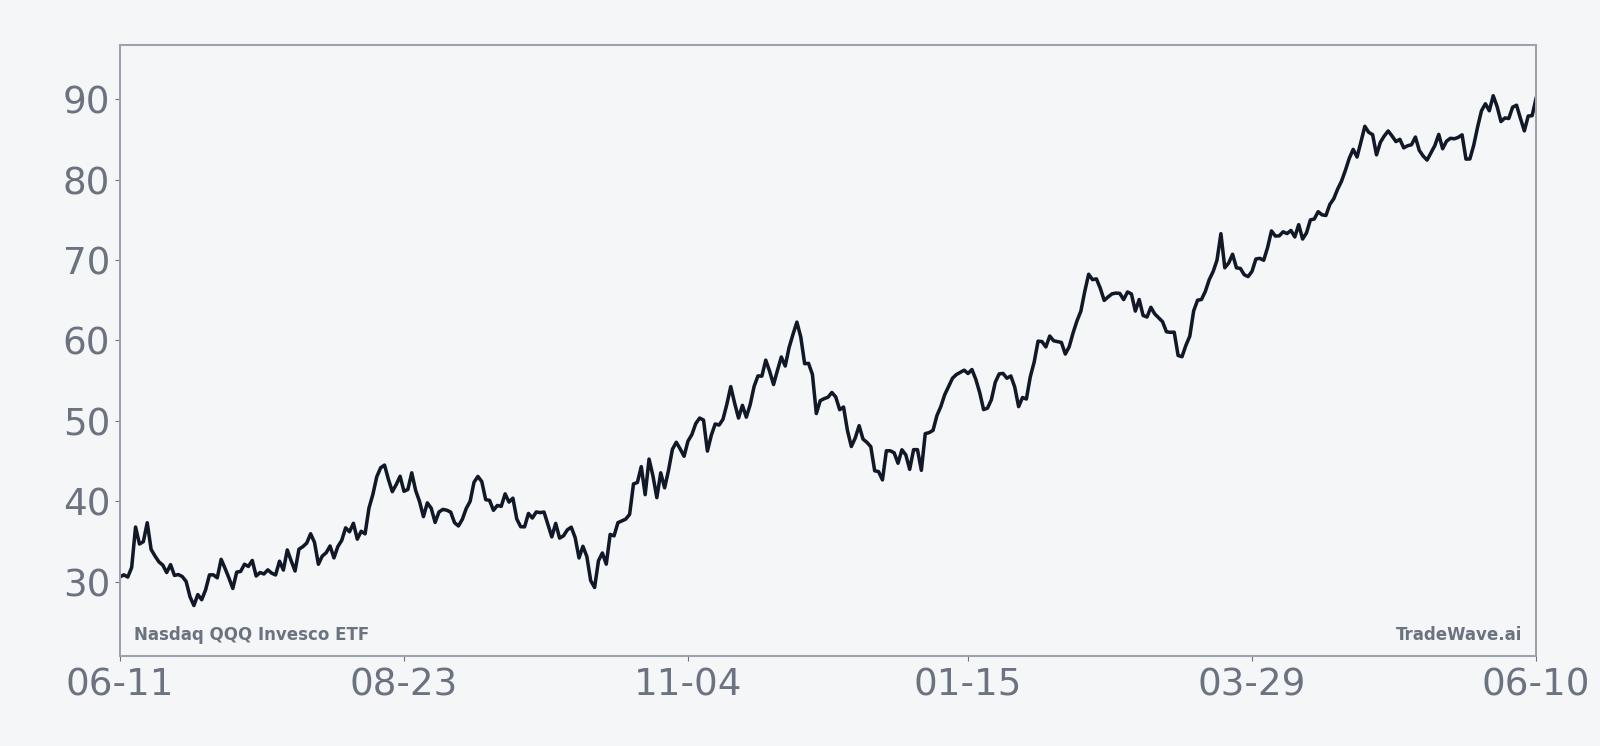
The historical seasonal average curve for this window slopes higher in a relatively steady fashion, with gains accruing across much of the 364-day span rather than clustering in a single month. There are pockets of consolidation and pullback, but the typical path shows QQQ grinding higher from the midterm summer into the heart of the pre-election year, echoing the broader pattern of risk-on behavior that often characterizes that phase of the presidential cycle.
A second view that layers in both upside bursts and drawdowns helps clarify how QQQ has actually traded inside these windows.
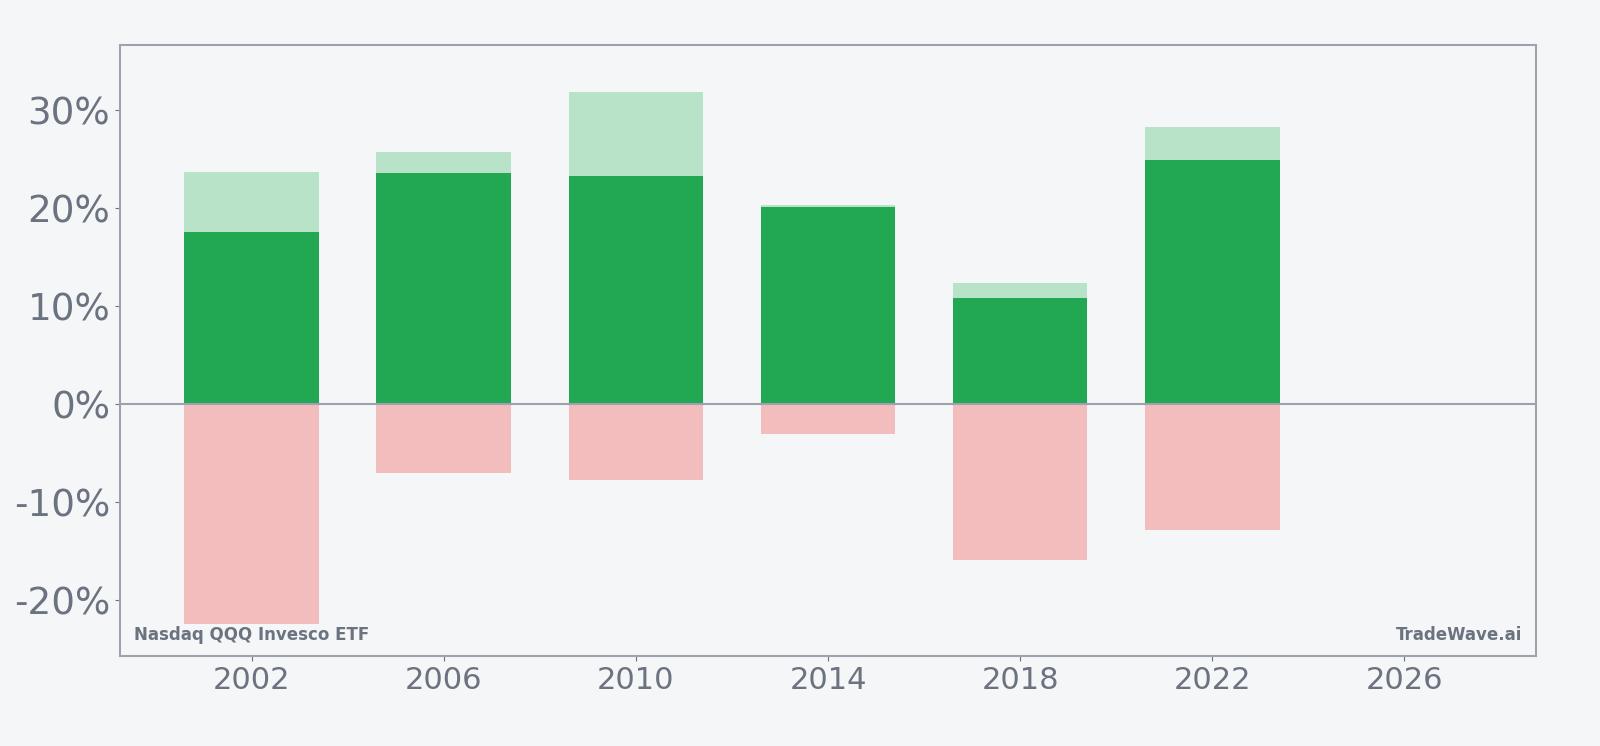
The combined net/MFE/MAE bars show a clear pattern: every year finished in the green, but several saw double-digit drawdowns along the way, especially early in the window, before stronger rallies took hold. In other words, this has been a bullish seasonal regime for QQQ, but not a smooth one, and traders have historically needed to tolerate sizable swings to capture the full move.
History does not guarantee future results; adverse excursions can be large even in winning windows, and past seasonal strength does not eliminate the risk of a different outcome this time.
Why does Nasdaq QQQ Invesco ETF (QQQ) follow this seasonal pattern?
One likely driver is the way the policy calendar and earnings cycle line up in the back half of the midterm year and into the pre-election year. By that point, much of the legislative uncertainty of the midterm campaign is behind markets, while fiscal and regulatory priorities for the remainder of the administration are clearer, which can support risk appetite for growth and tech. At the same time, large-cap tech earnings often stabilize after any early-cycle resets, and portfolio managers tend to rotate back into secular growth leaders ahead of the historically strong pre-election year, reinforcing this QQQ seasonal pattern.
What is driving Nasdaq QQQ Invesco ETF (QQQ) today?
QQQ finished Friday at 717.30, up 3.4% on the session, after trading between 695.00 and 718.37 on the day and opening at 699.29.[1] The ETF is about 4.2% below its 52-week high of 748.65 and well above its 52-week low near 519.78, with the close also sitting comfortably above the 50-day moving average of 679.07 and on volume of roughly 59.5 million shares versus a 20-day average near 47.2 million.[1] That mix of strong price action, elevated turnover and a stretched but not yet overextended position versus recent moving averages keeps QQQ squarely in a bullish trend heading into the late-June seasonal window.
The chart below situates the latest move in its recent multi-month context alongside a short-term seasonal projection.
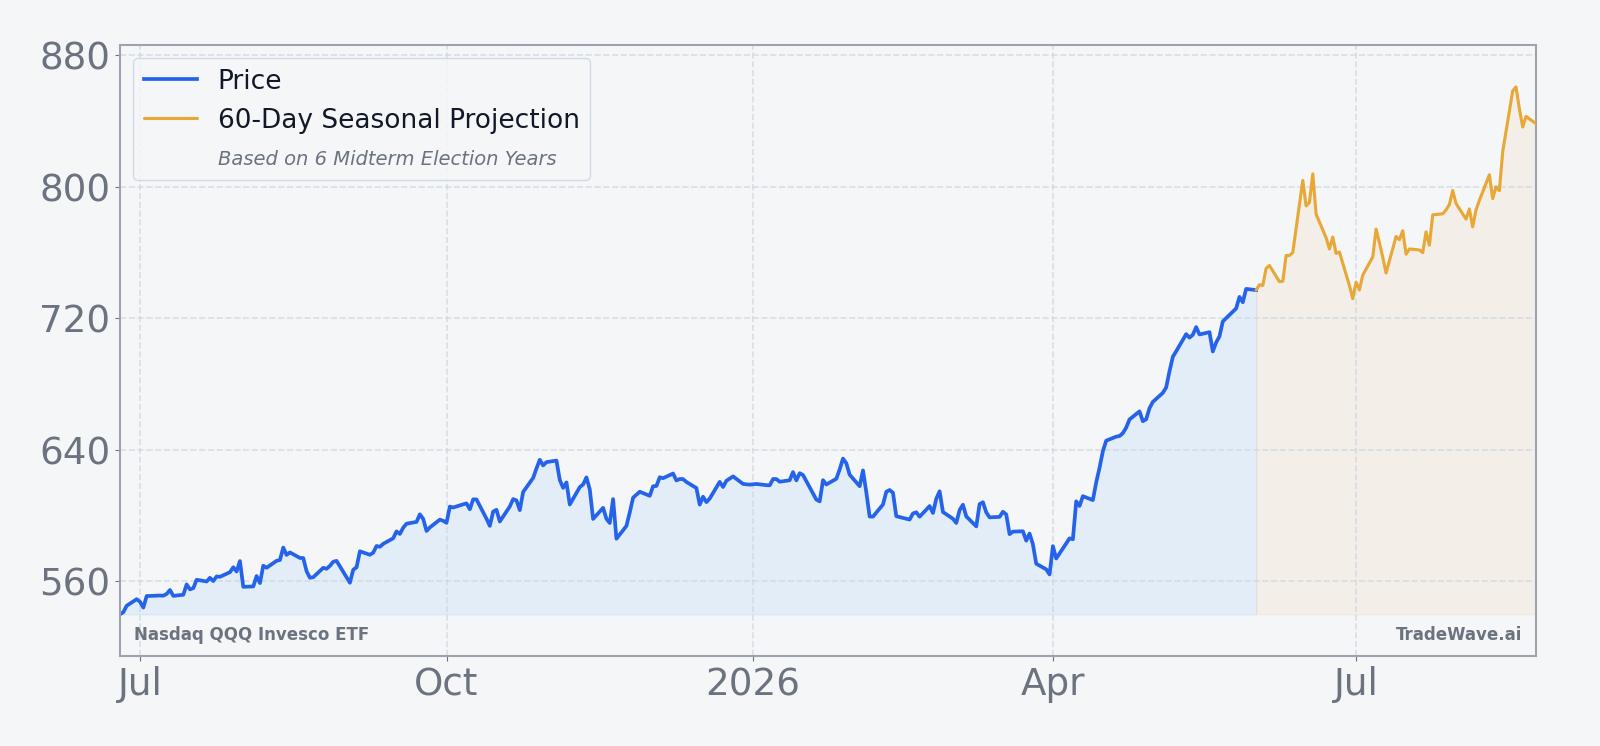
Macro headlines tied directly to QQQ were limited, with several outlets simply reflecting intraday QQQ levels in their site headers as a shorthand for broader market moves rather than pointing to a single catalyst.[1] That fits with the ETF’s role as a proxy for large-cap U.S. growth and tech: when QQQ jumps, it often reflects a blend of factors from interest-rate expectations to sector-specific news across its biggest holdings, rather than one discrete event. For traders, the key takeaway is that the ETF is entering this historically strong midterm-year seasonal stretch from a position of strength, not from a deeply oversold base.
What should traders watch as this QQQ seasonal window approaches?
First, watch how QQQ behaves as Jun 25 approaches relative to its 50-day moving average and the 700 level, which has acted as a rough psychological line in recent trading.[1] A sustained hold above that band into the start of the window would keep the historical bullish seasonal backdrop aligned with the current uptrend, while a sharp break lower would set up a more conflicted picture.
Second, monitor volatility and intraday ranges once the window opens. Past cycles show that even in winning years, QQQ has seen adverse moves of 10% to more than 20% at some point during the 364-day stretch, so a pickup in swings would not be out of character for this pattern. How quickly those dips are bought, and whether rallies can extend toward or beyond the prior 52-week high near 748.65, will offer an early read on whether this iteration is tracking the historical script.
Finally, keep an eye on the broader policy and macro calendar as the midterm year gives way to the pre-election year. Historically, this has been a phase where tech leadership often reasserts itself as uncertainty around the administration’s agenda fades and investors position for a potentially friendlier pre-election backdrop. If QQQ continues to attract flows and hold above key support levels during that transition, it would be consistent with the strong midterm-year seasonal pattern that has played out in the last six cycles.
Sources
About this seasonal analysis
Seasonal pattern data is sourced from TradeWave.ai, which analyzes historical price behavior across annual calendar windows going back up to 30 years. Read the full data methodology or the book The 100-Year Pattern by Afshin Moshrefi (2026 edition). Past performance of seasonal patterns does not guarantee future results. This article is for informational purposes only and does not constitute investment advice.