Teucrium Wheat (WEAT) Traders Eye 3% Average Short-Side Decline in June Window
Teucrium Wheat is approaching a short June trading window that has historically favored downside moves even as the ETF trades just above its 52-week low.

What is the seasonal pattern for Teucrium Wheat (WEAT)?
Teucrium Wheat has fallen in 9 of 10 years during this late-June 10-day window, with an average gain of 3.58% in winning short years.
- 9 for 10 in this window, with winning short years averaging 3.58% moves in the trade direction.
- The 10-day seasonal window begins Jun 18 and has historically favored short exposure in Teucrium Wheat.
- Percent Profitable is 90%, with 9 winners and 1 loser across the past decade of this pattern.
- Including all years, the average outcome is a 3% move in favor of the short side over the window.
- The TradeWave Ratio of 2.12 suggests price often travels meaningfully in the trade direction within the window.
- Intraperiod swings have included sizable adverse moves in some years, underscoring the need to respect drawdown risk.
According to historical data from TradeWave.ai, this upcoming stretch has behaved very differently from an average month on the calendar for WEAT. The next section walks through how that pattern has played out over the past decade and what it means for traders watching wheat exposure.
How has Teucrium Wheat (WEAT) traded in this late-June window?
Teucrium Wheat has delivered profitable short-side results in 9 of the past 10 years during this 10-day June window, with an average move of 3.58% in winning years. The next iteration starts on Jun 18, with WEAT last changing hands at 22.755, up 0.95% on the day and sitting about 13.6% above its 52-week low of 19.78 while far below its 52-week high of 121.75.[1]
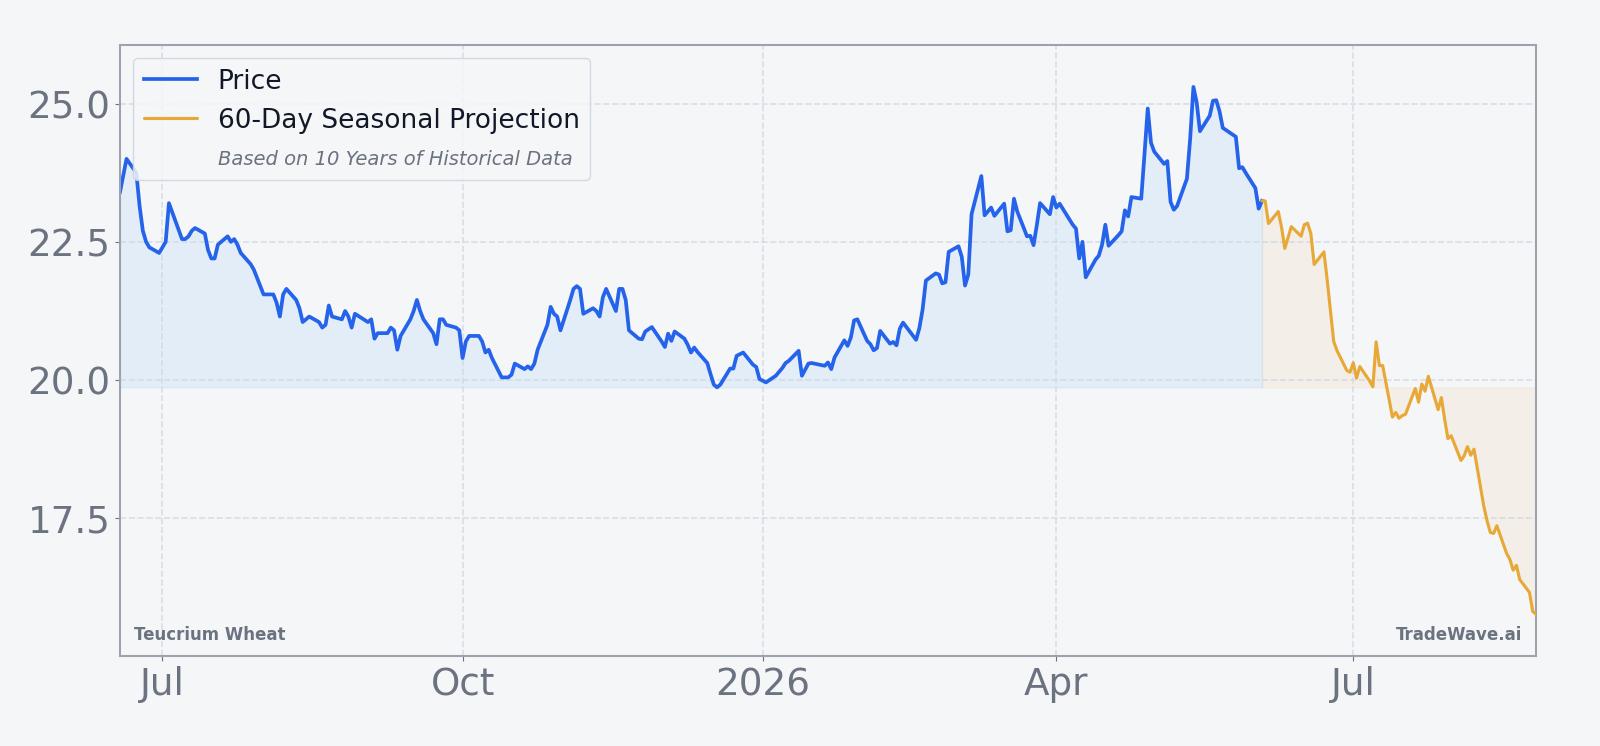
The historical seasonal average shows WEAT typically drifting lower through most of the window, with the bulk of the move often realized by the final few sessions. That fits a short-direction pattern where downside pressure tends to build rather than reverse quickly.
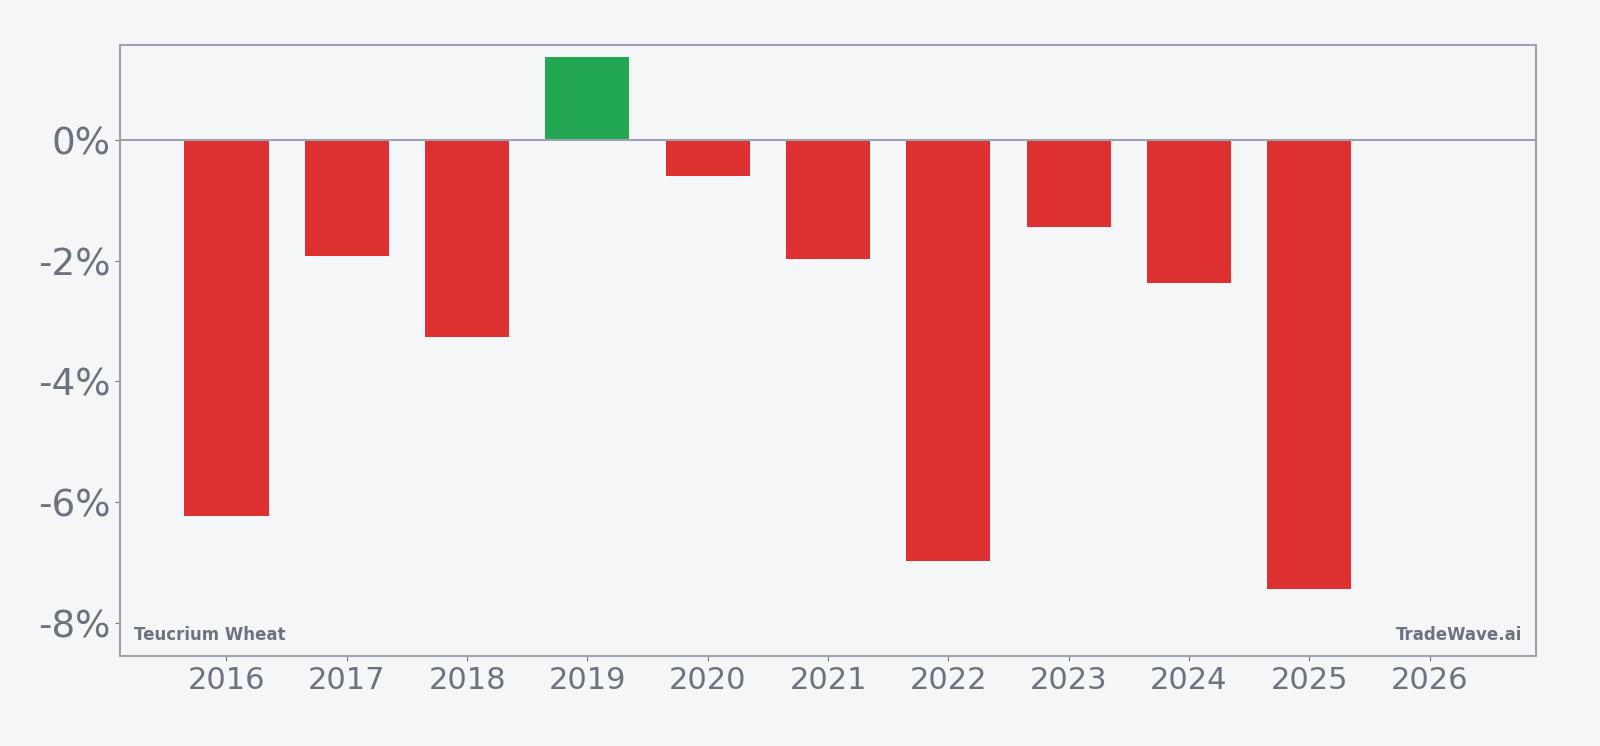
Year-by-year net returns and intraperiod swings show how far WEAT has tended to move in both favorable and adverse directions.
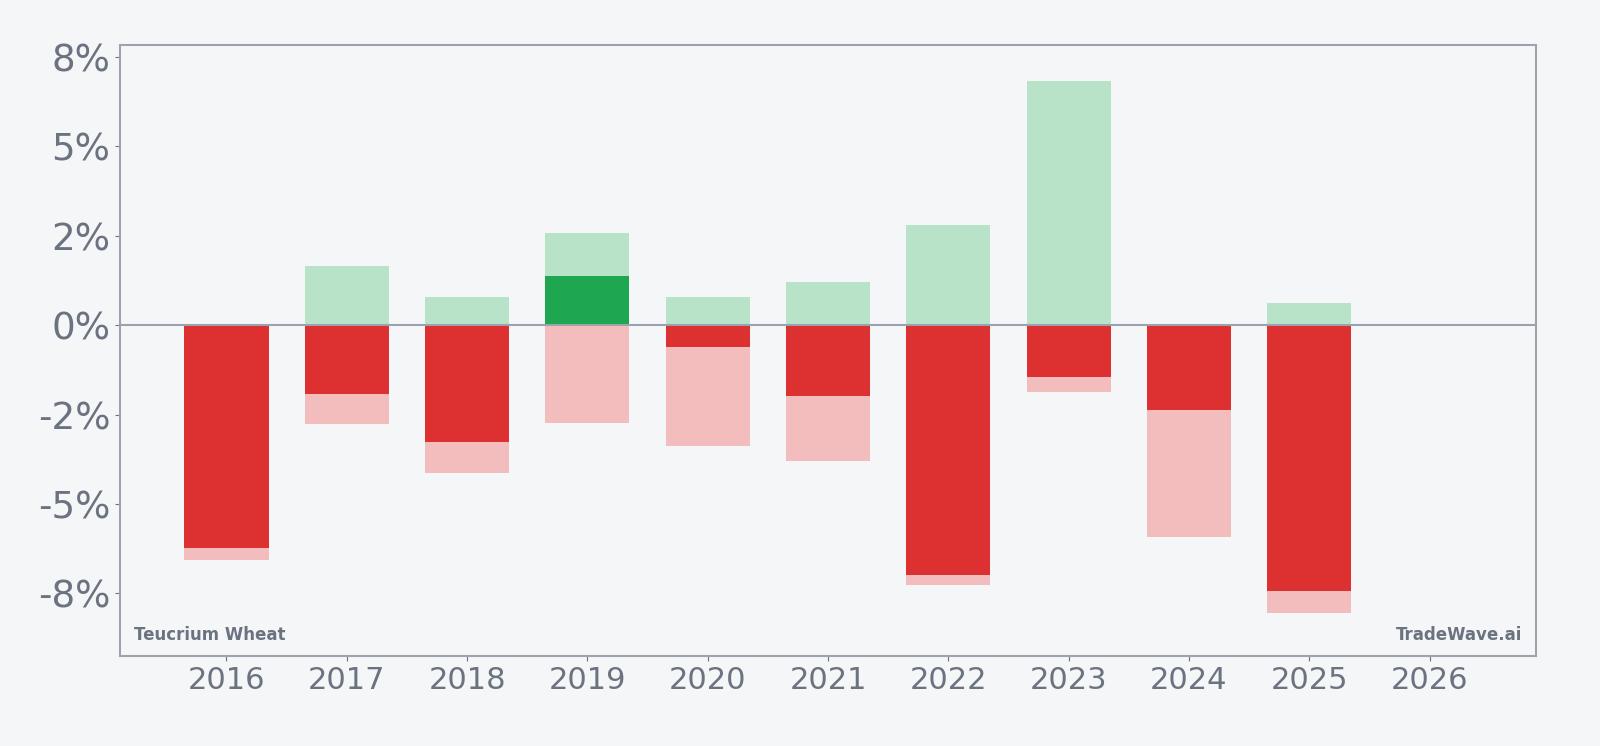
Across the decade, the strongest short year was 2025, when WEAT fell 7.44% over the window, while the lone losing year for the short side was 2019, which posted a 1.37% gain.[1] Maximum favorable moves in winning years have often been larger than the final net result, while maximum adverse moves have at times approached or exceeded 6%, showing that even successful shorts have had to sit through meaningful rallies.
History does not guarantee future results; adverse excursions can be large even in winning windows.
Why does Teucrium Wheat (WEAT) follow this seasonal pattern?
This pattern may reflect wheat’s supply and demand seasonality as Northern Hemisphere crops move through key growing stages in late June. Analysts often point to shifting weather expectations, early yield estimates and hedging flows from producers and users as drivers of short-term price pressure in this part of the calendar. The 10-day window likely captures a recurring pocket of positioning and risk management rather than a purely technical anomaly.
What is driving Teucrium Wheat (WEAT) today?
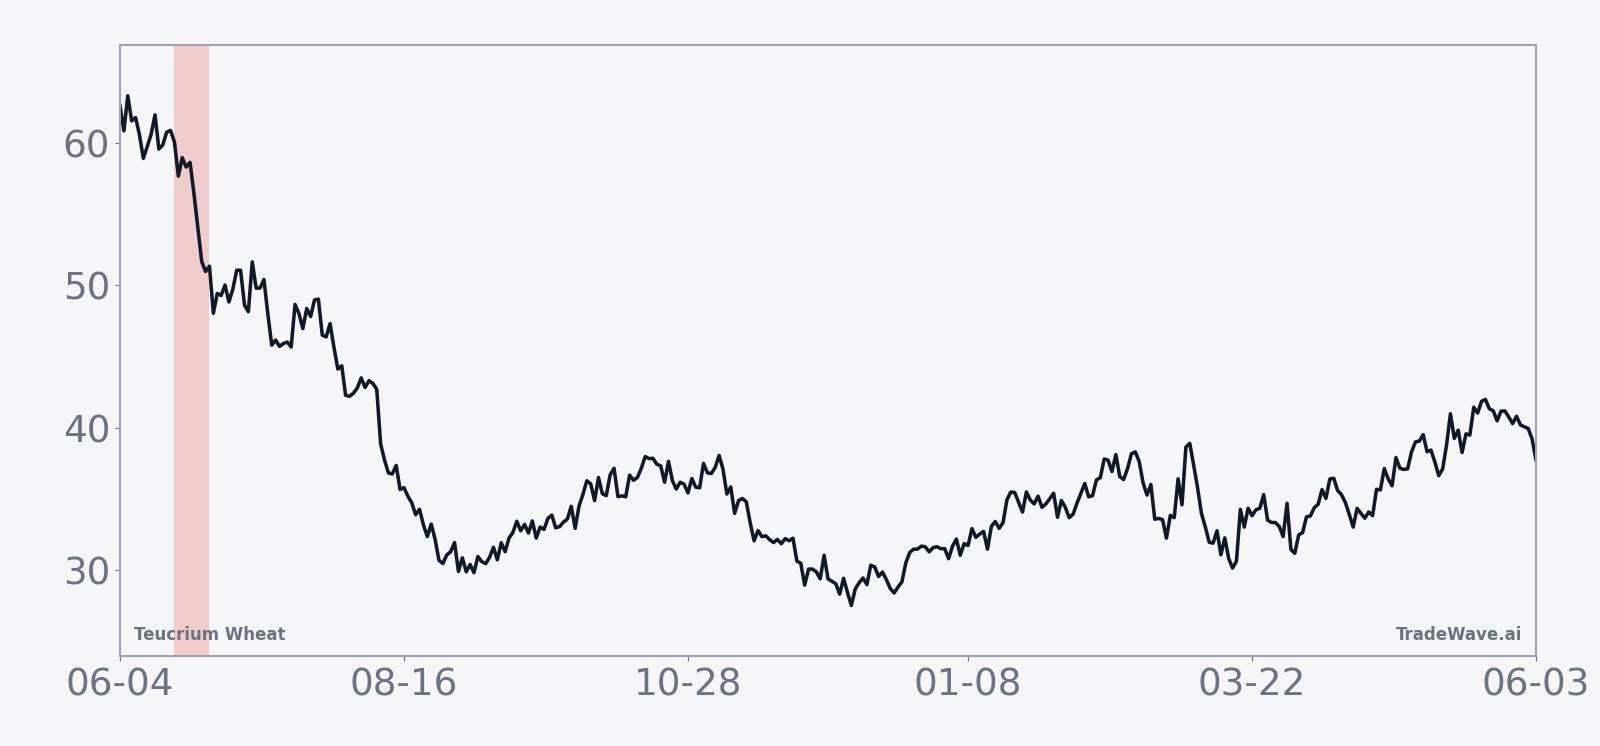
WEAT closed at 22.755 on Jun 16, up 0.95% on the session, with roughly 424,000 shares changing hands against a 20-day average volume of about 693,500.[1] The ETF sits well below its 50-day moving average of 23.4032 and is down roughly 9.0% over the past month, a slide that has pulled it close to the lower end of its recent trading range even as it remains far beneath the 52-week high of 121.75.[1]
The chart below situates the latest move in its recent multi-month context and overlays a short-term seasonal projection.
Teucrium Wheat is designed to give investors exposure to wheat futures through a rules-based basket of contracts, so its moves often track shifts in global grain markets rather than company-specific news. With no major ETF-specific catalysts on the calendar, traders are watching the combination of weather headlines, crop condition updates and positioning in the underlying futures curve as the seasonal window approaches.[1]
What should traders watch in this WEAT seasonal window?
The first marker is price behavior as the window opens on Jun 18. In prior years, the pattern has tended to reward short exposure, but the path has not been a straight line, with several seasons showing early countertrend rallies before the downside move asserted itself.
Key levels include the recent low near 19.78 and the 50-day moving average around 23.40.[1] A break below the low during the window would align with the historical short bias, while a sustained push back above the 50-day would look more like the rare losing year for the pattern.
Flows into and out of WEAT will also matter. Rising volume and heavier trading around the start of the window would suggest that futures hedgers and speculative accounts are leaning into the seasonal tendency, while a quiet tape could mean the pattern plays out more slowly or not at all.
Finally, watch how closely the ETF tracks its benchmark wheat futures during any sharp intraperiod swings. The historical record shows that maximum adverse moves for shorts can be sizable even in winning years, so whether rallies are quickly sold or extend beyond the typical range will be a key tell for how this iteration of the pattern is unfolding.
Sources
About this seasonal analysis
Seasonal pattern data is sourced from TradeWave.ai, which analyzes historical price behavior across annual calendar windows going back up to 30 years. Read the full data methodology or the book The 100-Year Pattern by Afshin Moshrefi (2026 edition). Past performance of seasonal patterns does not guarantee future results. This article is for informational purposes only and does not constitute investment advice.