10-for-10 Summer Slide: Trust VIX Short-Term Futures ETF (VIXY) Faces Weak 22-Day Window
Trust VIX Short-Term Futures ETF is approaching a historically weak 22-day early-summer stretch even as the ETF trades just above its 52-week low and volatility expectations remain muted.

What is the seasonal pattern for Trust VIX Short-Term Futures ETF (VIXY)?
Trust VIX Short-Term Futures ETF has fallen in 10 of 10 years during this late-June 22-day window, with an average gain of 9.4% in winning short trades.
- 10 for 10 in this window, with short trades averaging 9.4% gains across the past decade.
- The upcoming 22-day trading window starts Jun 23, 2026 and has historically been a bearish seasonal stretch for VIXY.
- Percent Profitable is 100%, with 10 winners and 0 losers for the short trade direction in this pattern.
- Annualized return for the strategy in this window is 9.3%, with a Sharpe ratio of 1.84 based on end-of-window outcomes.
- The TradeWave Ratio of 2.78 indicates price has typically traveled meaningfully in the short direction within the window, not just at the close.
- Intraperiod swings have been sizable, with years like 2018 and 2025 showing double-digit adverse moves before ultimately finishing as profitable shorts.
According to historical data from TradeWave.ai, this specific early-summer stretch has behaved very differently from an average month for VIXY. The next section walks through how that pattern has played out over the past decade and what it means for traders watching volatility products.
How has Trust VIX Short-Term Futures ETF (VIXY) traded in this early-summer window?
Trust VIX Short-Term Futures ETF has delivered profitable short trades in every single iteration of this 22-day late-June window over the past 10 years, with an average 9.4% gain for the strategy. That window opens again on Jun 23, 2026, with VIXY last changing hands at 21.90, down 3.5% on Friday and sitting about 1.7% above its 52-week low of 21.54.[1] For a product built on short-term VIX futures, that combination of a depressed price and a historically weak seasonal stretch is a notable setup for traders who use VIXY as a hedge or a tactical volatility bet.
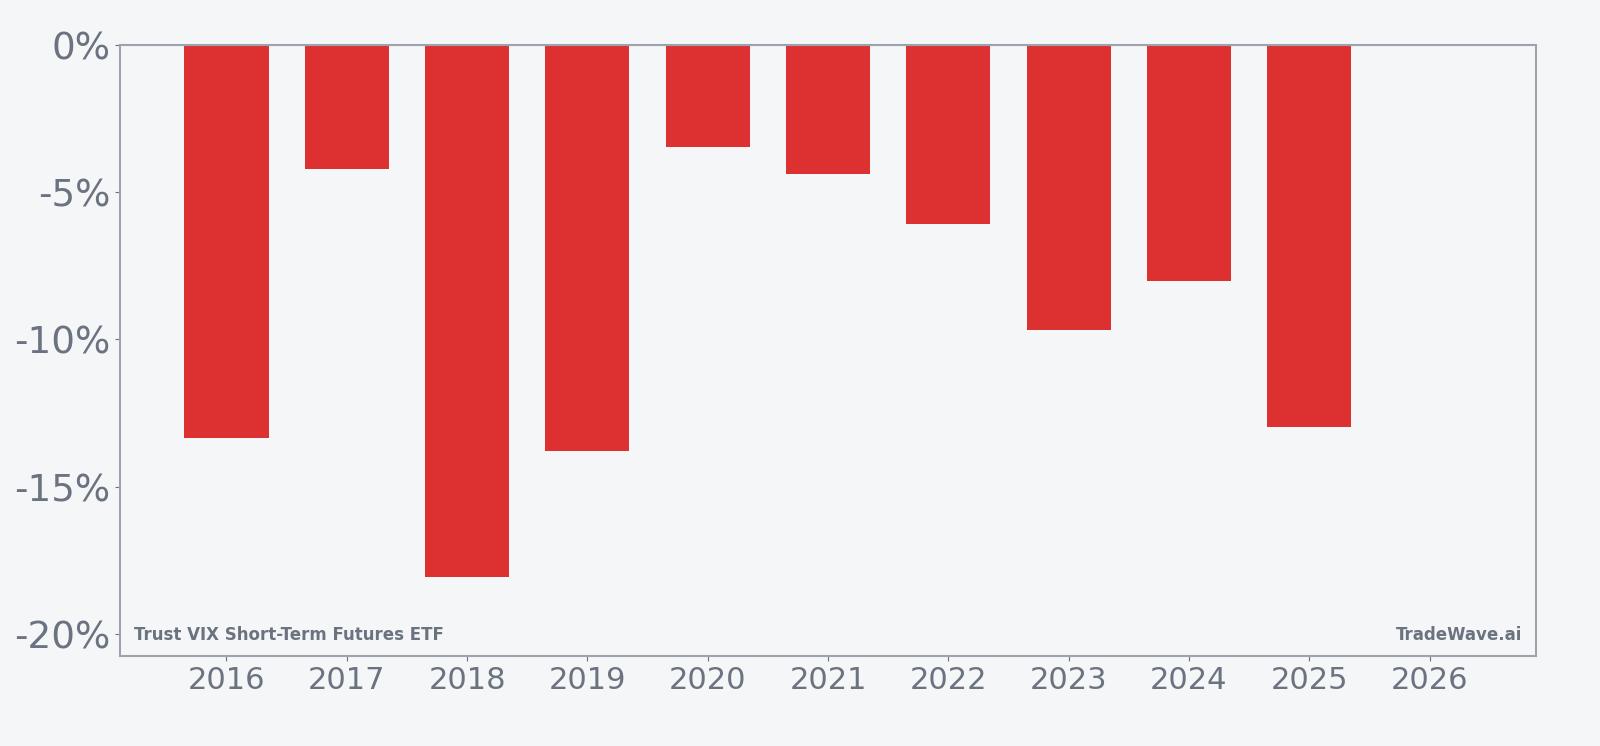
Historically, this has been a cleanly directional window for volatility shorts. Percent Profitable sits at 100%, with 10 winners and 0 losers for the short trade direction, and the annualized return for the strategy in this slice of the calendar is 9.3%. The median outcome is close to the mean at 8.84%, which suggests the pattern has not been driven by a single outlier year.
The per-year table shows how that has played out in practice. In 2018, a short in this window would have captured an 18.05% decline in VIXY, while 2016 and 2019 delivered 13.36% and 13.79% drops respectively. Even the softer years, such as 2017 and 2020, still produced 4.21% and 3.48% moves in favor of the short, which is meaningful for a 22-day holding period in a volatility-linked ETF.
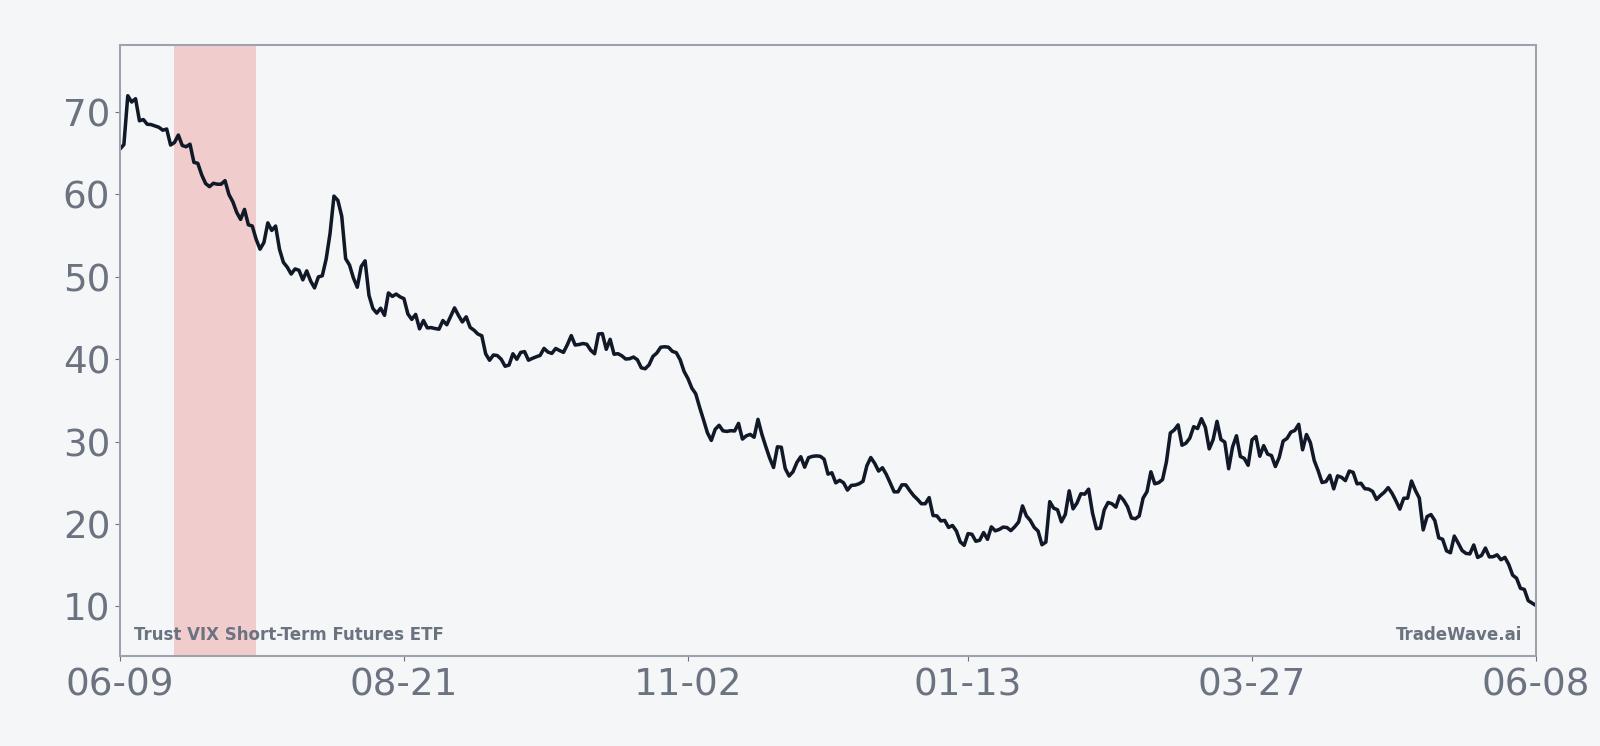
The historical seasonal average shows the bulk of the move tending to accrue steadily rather than in a single overnight shock. The typical path features early pressure on VIXY that continues through the middle of the window, with some stabilization toward the end as volatility expectations reset.
Year-by-year bars with maximum favorable and adverse moves highlight how much VIXY has tended to swing inside the window before settling at the final result.
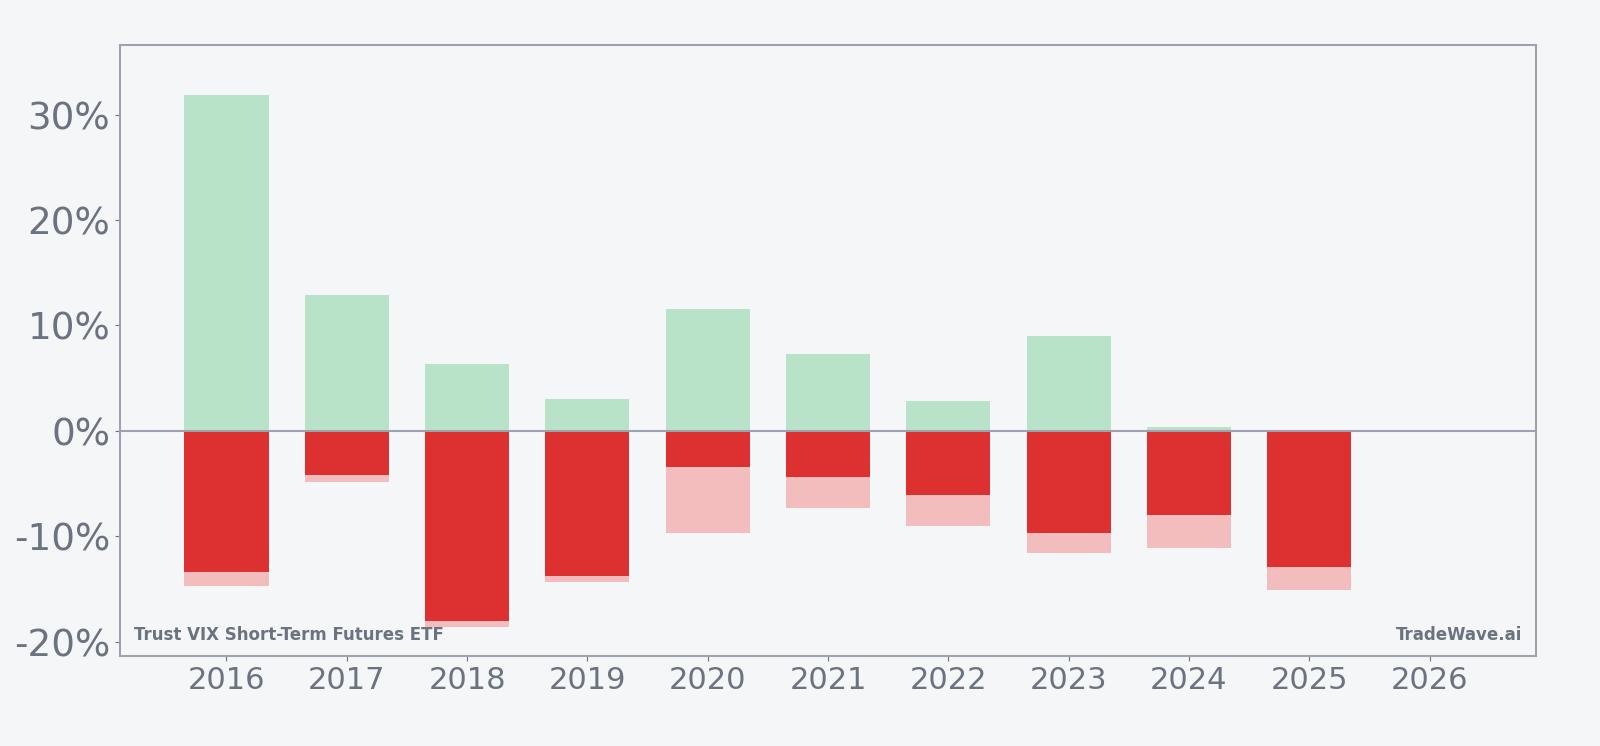
The maximum favorable excursion, or best intraperiod move in the short direction, has been sizable in several years, with 2016 showing a 31.85% peak move and 2018 posting 18.62% in the short trader’s favor before the window closed. At the same time, maximum adverse excursions have not been trivial: 2016 saw a 14.7% move against the short at one point, and 2025 recorded a 15.15% adverse swing even though the trade still finished with a 12.97% gain. That mix of strong net results and meaningful intraperiod volatility is exactly what the TradeWave Ratio of 2.78 is flagging.
History does not guarantee future results; adverse excursions can be large even in winning windows, and volatility products like VIXY can move quickly in both directions.
Why does Trust VIX Short-Term Futures ETF (VIXY) follow this seasonal pattern?
One likely driver is the way equity markets and volatility expectations often behave into the early part of the summer, when earnings season is between waves and macro calendars can be lighter. In that environment, realized volatility has tended to drift lower, which pressures short-term VIX futures and, by extension, VIXY. The pattern may also reflect institutional portfolio positioning, as many managers reduce hedges after the spring and let volatility exposure run lighter into July unless a clear macro shock appears.
What is driving Trust VIX Short-Term Futures ETF (VIXY) today?
VIXY closed Friday at 21.90, down 3.5% on the day, extending a one-month slide of 15.83% as equity markets have stayed relatively calm and implied volatility has bled lower.[1] The ETF is hovering just above its 52-week low of 21.54 and sits far below its 52-week high of 54.17, underscoring how much volatility pricing has compressed since last year’s spikes.[1] Trading volume of about 2.26 million shares on Friday ran below the 20-day average of roughly 3.63 million, which fits the picture of a market that is not aggressively reaching for volatility hedges at current levels.[1]
Structurally, Trust VIX Short-Term Futures ETF offers exposure to a rolling basket of short-term VIX futures rather than the VIX index itself. That means its performance is shaped not only by day-to-day changes in implied volatility but also by the shape of the VIX futures curve and the cost of rolling contracts forward. When the curve is in contango, as it often is in quieter markets, VIXY can grind lower over time even if spot volatility is relatively stable, because the fund is consistently selling cheaper near-term futures and buying more expensive longer-dated ones.
Against that backdrop, the current price level matters. With VIXY trading about 1.7% above its 52-week low and well under its 50-day moving average of 26.12, the ETF is already in a downtrend by most technical measures.[1] The seasonal pattern described earlier does not predict that trend will continue, but it does show that this specific late-June to mid-July window has historically lined up with further pressure on VIXY rather than a sharp mean-reversion higher.
The chart below situates the latest move in its recent multi-month context and overlays a 60-day seasonal projection.
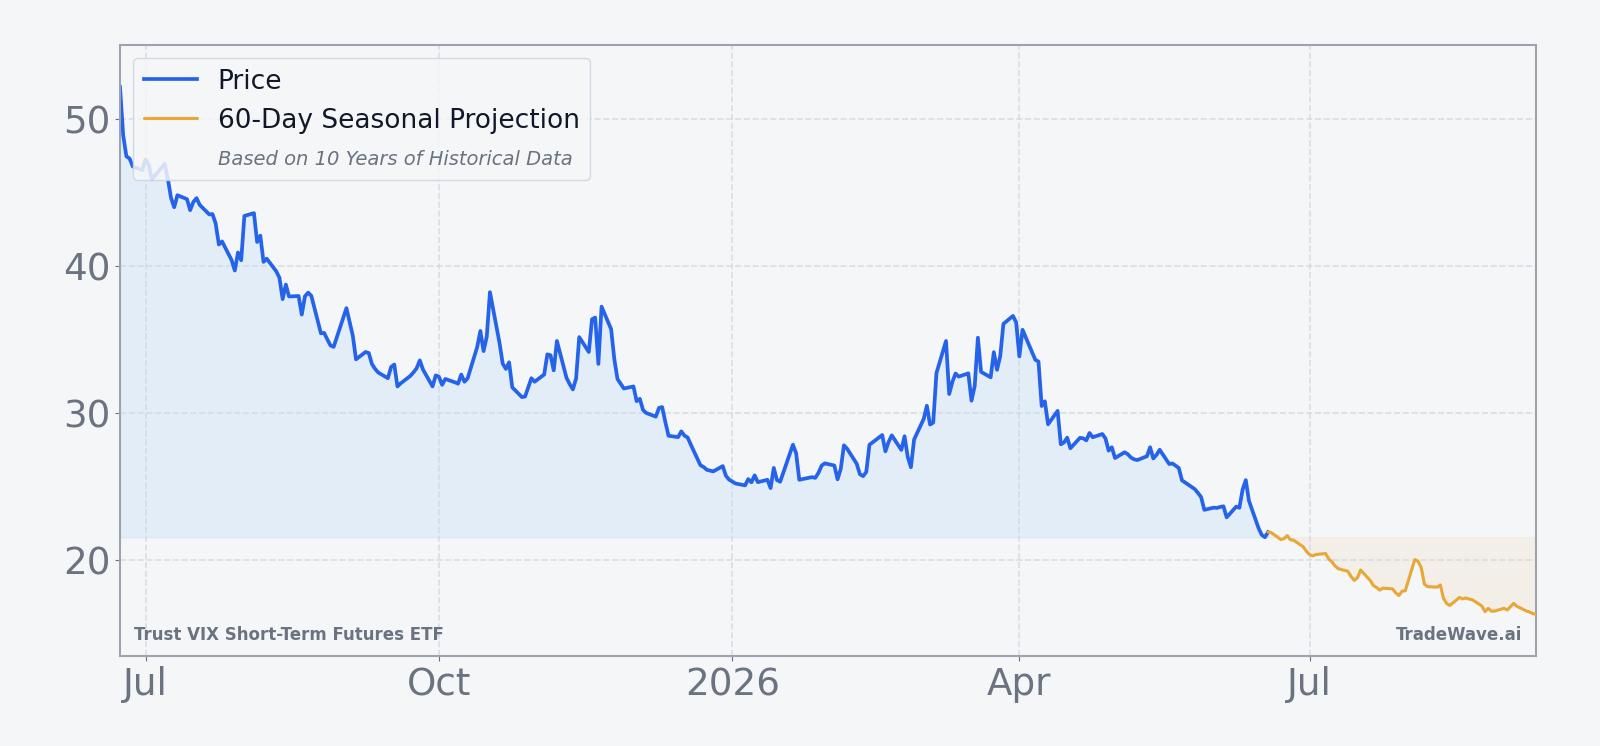
For traders, the key is how flows and positioning respond as this window opens. If equity markets stay firm and demand for downside protection remains muted, the combination of structural roll headwinds and the historical seasonal trend could keep pressure on VIXY. A sudden macro shock or equity sell-off, by contrast, would likely overwhelm any seasonal tendency, as short-term VIX futures can spike rapidly when fear returns to the market.
What should traders watch in this VIXY seasonal window?
First, watch how VIXY behaves as the 22-day window gets underway relative to its 52-week low around 21.54. A decisive break below that level early in the window would be consistent with the historical pattern of further weakness, while a sharp bounce that holds above the low would mark a clear departure from the past decade’s behavior.
Second, monitor the relationship between VIXY and broad equity benchmarks. In prior years, this early-summer stretch has often coincided with relatively stable or rising stock prices, which tends to suppress volatility products. If equities wobble this time yet VIXY fails to respond, that would be a sign that structural factors like roll yield are dominating the tape.
Third, keep an eye on trading volume and options activity in VIXY and related volatility products. A pickup in volume from the recent 2.26 million-share pace toward or above the 20-day average of 3.63 million would signal that investors are actively adjusting hedges as the seasonal window progresses.[1] Whether that flow leans into the historical pattern by adding short volatility exposure or pushes against it with fresh hedging demand will help determine how closely this year tracks the 10-for-10 record.
Finally, track the intraperiod swings, not just the closing prices. Past years have seen double-digit maximum adverse moves against the short before the trade ultimately finished profitable, which means even a historically favorable window has carried meaningful risk. If VIXY again shows large intraday or intraweek spikes that fade by the close, it would echo the prior pattern of sharp but temporary volatility bursts inside an overall downtrend for the ETF.
Sources
About this seasonal analysis
Seasonal pattern data is sourced from TradeWave.ai, which analyzes historical price behavior across annual calendar windows going back up to 30 years. Read the full data methodology or the book The 100-Year Pattern by Afshin Moshrefi (2026 edition). Past performance of seasonal patterns does not guarantee future results. This article is for informational purposes only and does not constitute investment advice.