6-for-6 Midterm Run: S&P 500 Technology Sector SPDR (XLK) Enters 356-Day Rally Window
S&P 500 Technology Sector SPDR is trading through a 356-day midterm-year seasonal regime that has never posted a loss in the last six cycles, raising the stakes for tech’s next leg.

What is the seasonal pattern for S&P 500 Technology Sector SPDR (XLK)?
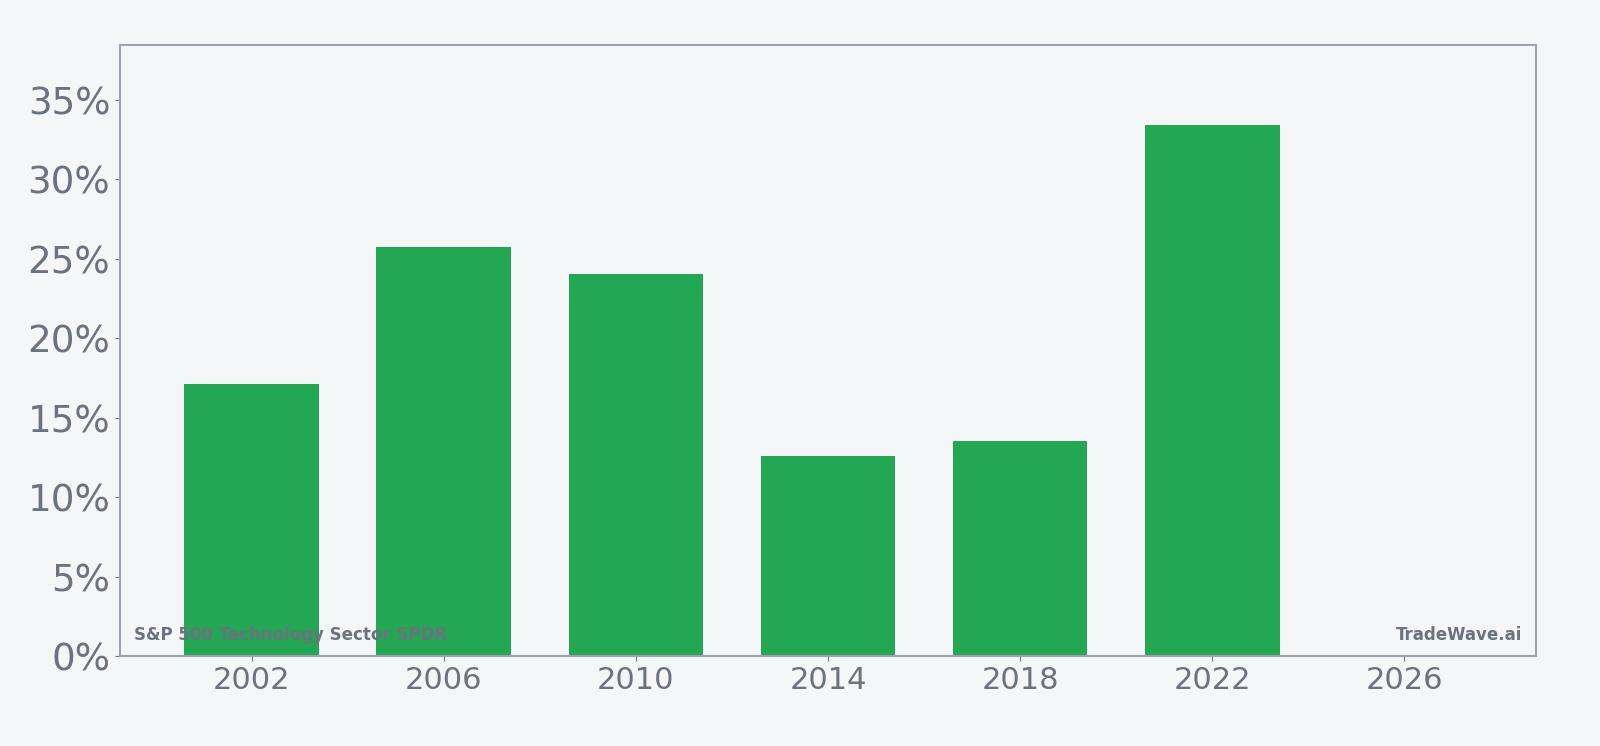
S&P 500 Technology Sector SPDR has risen in 6 of 6 midterm-year windows during this 356-day stretch, with an average gain of 21.08% in winning years.
- 6 for 6 in this window, with winning years averaging 21.08% gains across the last six midterm election cycles.
- Seasonal window runs 356 calendar days from Jul 2, 2026, spanning the back half of the midterm election year into the pre-election year.
- Percent Profitable is 100%, with 6 winners and 0 losers in the historical sample.
- Annualized return across the window clocks in at 20.86%, paired with a Sharpe ratio of 2.13 for end-of-window outcomes.
- TradeWave Ratio of 2.19 signals that price has typically traveled meaningfully in the long direction within the window, not just at the close.
- Intraperiod drawdowns have still been sharp at times, with adverse moves exceeding 20% in the weakest year even though the final result was positive.
According to historical data from TradeWave.ai, this long midterm-year stretch has behaved very differently from an average calendar year for XLK. The next section walks through how that pattern has played out across the last six cycles and what it implies for the current regime.
How has S&P 500 Technology Sector SPDR (XLK) traded in this midterm-year window?
S&P 500 Technology Sector SPDR has finished higher in every single one of the last six midterm election years during this 356-day window, averaging a 21.08% gain. The current iteration of that window began on Jul 2, 2026 and will carry tech investors from the heart of the midterm election year into the pre-election year, a phase that has often coincided with strong risk appetite for growth sectors. For traders who track historical seasonality, this is one of the cleanest long-biased patterns on the XLK calendar.
The presidential election cycle matters here because this XLK seasonal trend is built only from midterm election years, a phase that has historically featured policy uncertainty early in the year followed by a powerful relief phase as the calendar rolls toward the pre-election year. Grouping by this cycle strips out noise from other years and focuses on how tech has behaved when Washington is in the same part of its four-year rhythm.
Across the six midterm-year samples since 2002, the trade direction for this pattern is explicitly long. Every year in the window has ended with a positive net return, from a 12.61% gain in 2014 to a 33.44% surge in 2022. The average winner gain of 21.08% lines up closely with the 21% all-years average, because there are no losing years in the set.
Intraperiod swings have been meaningful. In 2010, XLK’s best point-to-peak move within the window, known as the maximum favorable excursion, reached 34.48% before settling back to a 24.02% net gain by the end. On the downside, the worst drawdown from entry, or maximum adverse excursion, hit -22.45% in 2002 even though that year still finished up 17.12%, showing that investors have had to sit through real volatility to capture the full seasonal trend.
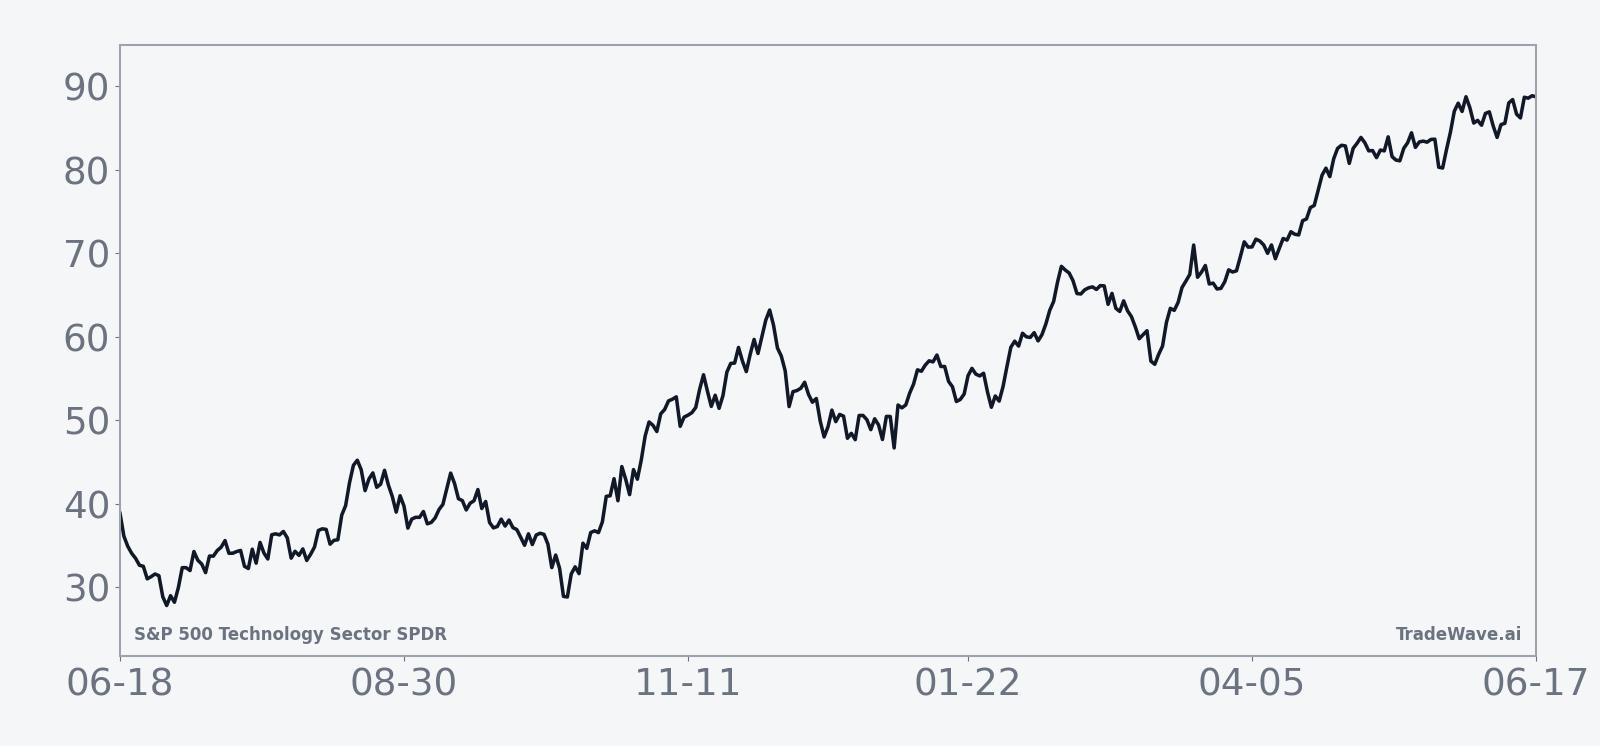
The historical seasonal trend chart for this window shows a fairly steady upward slope rather than a single explosive burst. Gains tend to build across the full 356 calendar days, with only brief pauses, which fits the idea of a midterm-to-pre-election “grind higher” in large-cap tech. The pattern also overlaps the broader midterm-to-pre-election regime that has been unusually strong for the S&P 500 over the last century, and XLK’s behavior here looks like a leveraged version of that index-level tendency.
Year-by-year bars with both peak rallies and worst drawdowns put that smooth average into real-world risk terms.
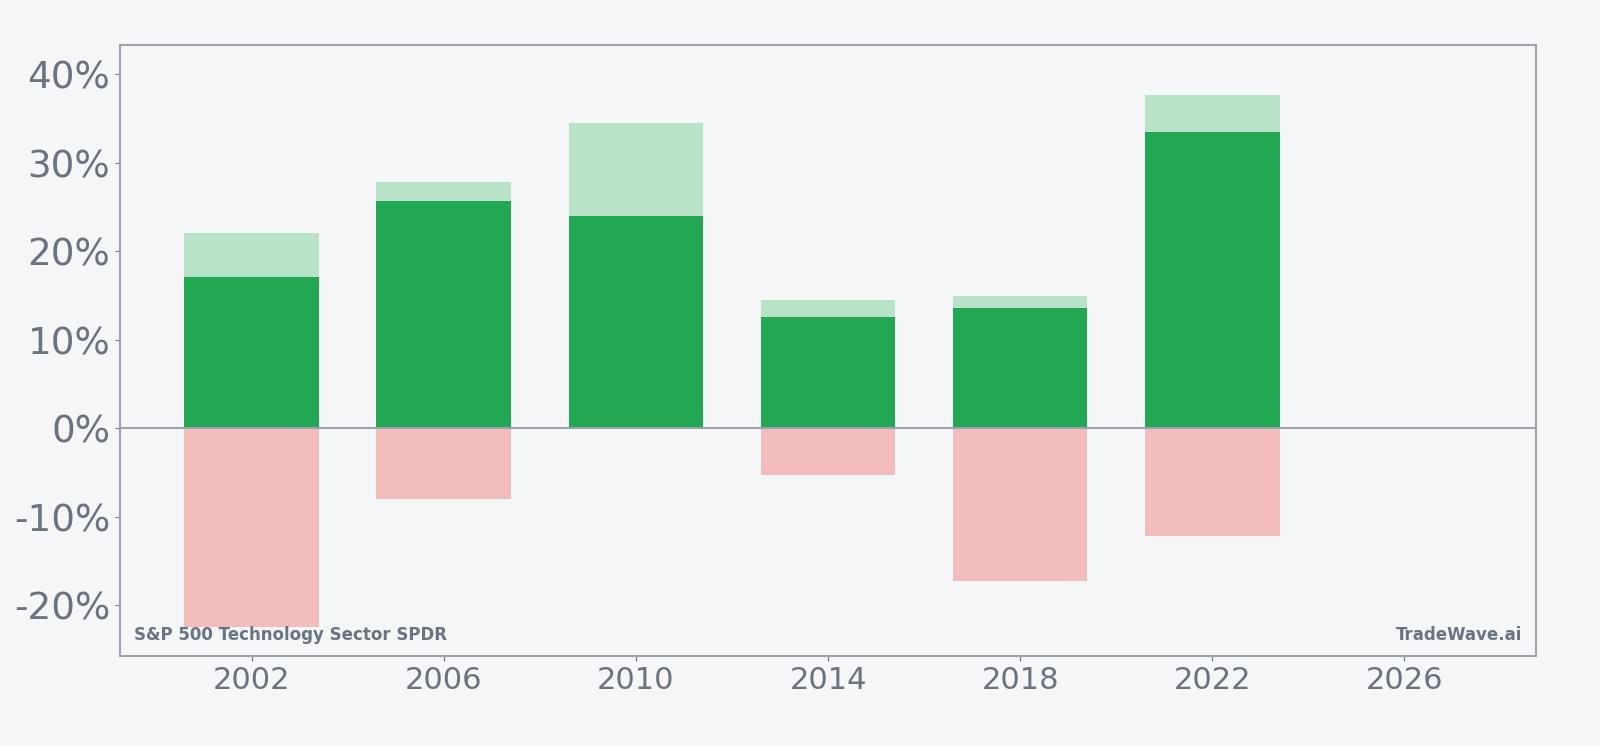
The combined net, peak favorable move and worst drawdown bars show a clear pattern: XLK has usually delivered double-digit upside at some point in the window, but the path has not been a straight line. Years like 2018 and 2002 saw adverse moves of -17.23% and -22.45% respectively before finishing higher, while 2022 combined a 37.69% peak rally with a -12.22% drawdown along the way. Add it up: six wins in six tries, but with enough volatility that position sizing and risk management have mattered as much as the direction of the seasonal bias.
History does not guarantee future results; adverse excursions can be large even in winning windows, and past seasonal strength does not ensure similar outcomes in this cycle.
Why does S&P 500 Technology Sector SPDR (XLK) follow this seasonal pattern?
One likely driver is the way tech earnings and guidance cluster around the midterm-to-pre-election transition, when policy uncertainty often fades and corporate spending plans firm up. Institutional investors also tend to rebalance toward growth and higher-beta sectors as the pre-election year approaches, which can funnel flows into large-cap technology. This XLK seasonal pattern may reflect that combination of earnings visibility, sector rotation and a friendlier policy backdrop for risk assets late in the presidential cycle.
What is driving S&P 500 Technology Sector SPDR (XLK) today?
XLK’s latest move comes against a backdrop of elevated volatility in mega-cap tech and shifting expectations for the Federal Reserve’s rate path, but without a single dominant catalyst on Jul 2, 2026. With the ETF having pulled back about 6.13% over the past month, traders are weighing whether this is a routine pause inside a historically strong midterm-year seasonal window or the start of a deeper consolidation in a sector that has led the market for years.
The chart below situates the latest move in its recent multi-month context, alongside a 60-day seasonal projection based on prior midterm-year behavior.
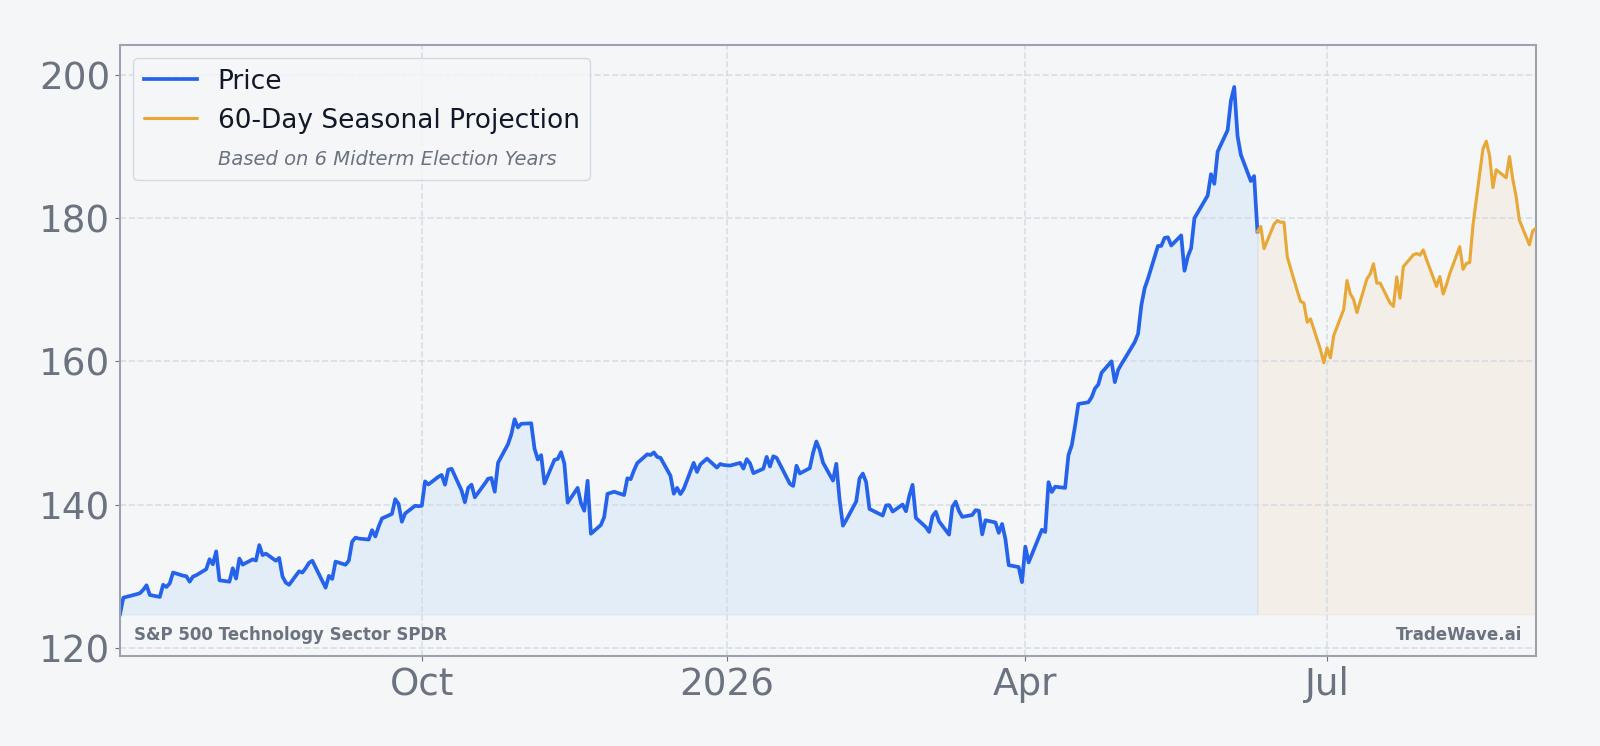
From here, the key tension for investors is between that strong historical seasonality and the reality of a tech sector that has already logged large multi-year gains. If XLK continues to respect the typical midterm-to-pre-election pattern, pullbacks like the recent 6.13% slide may prove to be noise inside a longer grind higher. If instead the ETF breaks materially below its recent range and fails to recover in the early part of the window, that would be an early sign that this cycle is diverging from the last six.
What to watch in this window: first, how XLK behaves around any upcoming macro data or central bank commentary that could shift rate expectations, since growth valuations are sensitive to the discount rate. Second, whether the ETF can hold above its 50-day moving average of 177.71 as the window progresses, or whether repeated failures there signal a more durable change in trend. Third, how closely the actual path tracks the historical seasonal projection in the next 60 to 90 days; strength that lines up with the typical midterm-year grind higher would reinforce the pattern, while a flat or negative tape through that stretch would argue that this cycle is breaking the mold.
Sources
About this seasonal analysis
Seasonal pattern data is sourced from TradeWave.ai, which analyzes historical price behavior across annual calendar windows going back up to 30 years. Read the full data methodology or the book The 100-Year Pattern by Afshin Moshrefi (2026 edition). Past performance of seasonal patterns does not guarantee future results. This article is for informational purposes only and does not constitute investment advice.