S&P 500 Healthcare Sector SPDR (XLV) Has Rallied in 6 of 6 Midterm Windows, Averaging 7.4% Gains
S&P 500 Healthcare Sector SPDR is trading inside a historically strong midterm-year seasonal window that has never posted a loss in this 155-day stretch.

What is the seasonal pattern for S&P 500 Healthcare Sector SPDR (XLV)?
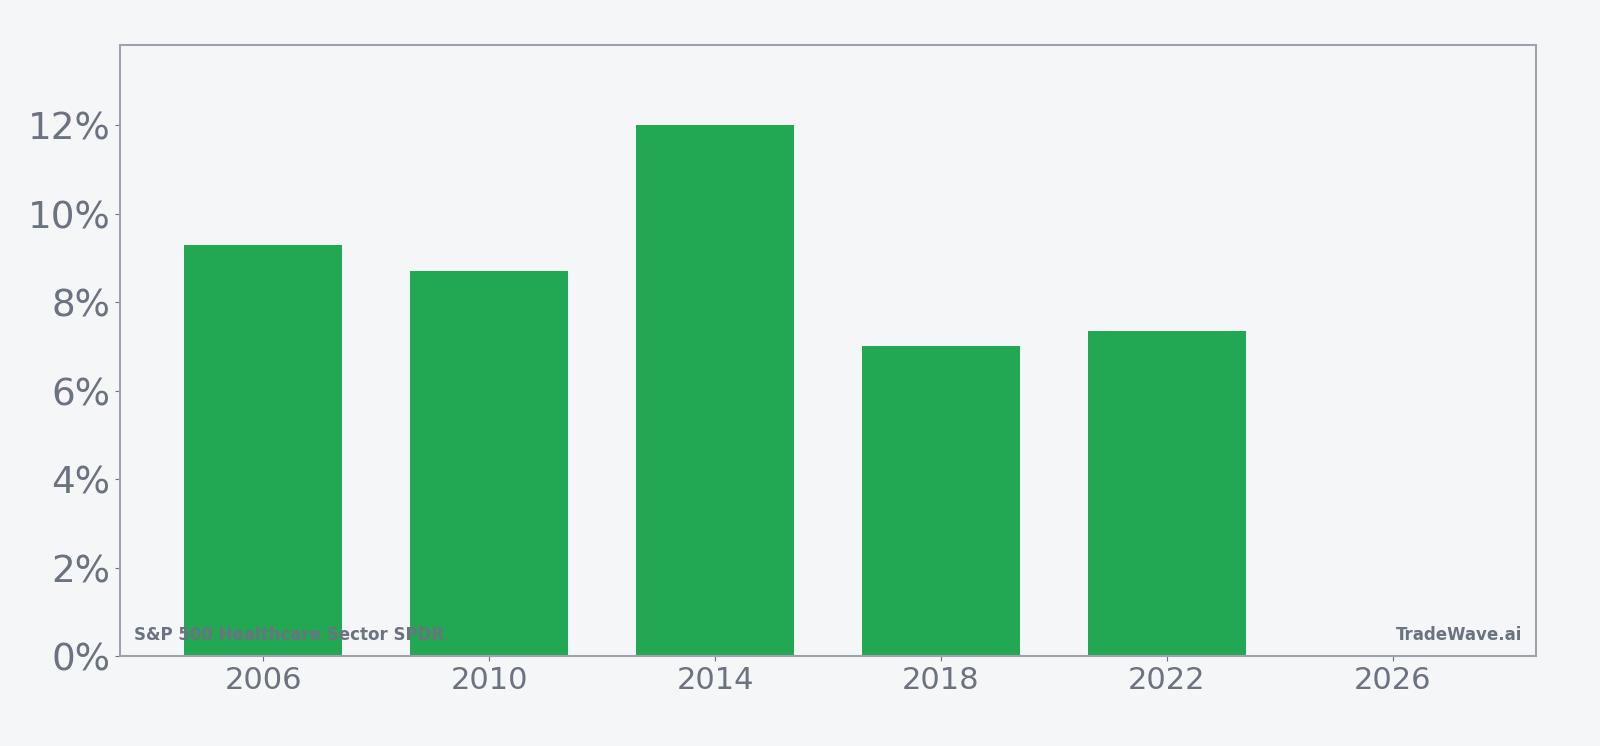
S&P 500 Healthcare Sector SPDR has risen in 6 of 6 midterm-year windows during this 155-day stretch, with an average gain of 7.4% in winning years.
- 6 for 6 in this window, with XLV averaging 7.4% gains across all winning years.
- Seasonal window runs 155 trading days from Jul 11 in midterm election years, targeting a long bias.
- Percent Profitable is 100%, with 6 winners and 0 losers across the last six midterm election years.
- Median outcome is an 8.03% gain, pointing to a consistently positive XLV seasonal trend rather than one or two outlier years.
- Historical best intraperiod rallies have reached mid-teens gains, while adverse moves have at times pushed drawdowns toward the mid-single digits before recovering.
- Sharpe ratio of 1.41 and a TradeWave Ratio of 1.45 flag this S&P 500 Healthcare Sector SPDR trading window as unusually efficient for long exposure in the health-care sector.
According to historical data from TradeWave.ai, this midterm-year stretch for XLV has behaved very differently from an average half-year on the calendar, with a clear long-side bias that stands out in the data.
How has S&P 500 Healthcare Sector SPDR (XLV) traded in this midterm-year window?
S&P 500 Healthcare Sector SPDR has posted gains in every single midterm-year seasonal window since 2006 during this 155-day stretch, averaging a 7.4% advance for long positions. The current window, which began on Jul 11, is unfolding as health-care resumes leadership after a 2024–25 pullback and a strong breakout from a late-September bottom.
Grouping the pattern by the presidential election cycle matters here because this window captures the heart of the midterm election year, when policy uncertainty, health-care regulation debates and budget negotiations often push investors toward defensive growth sectors like health care. XLV’s behavior in this slice of the calendar reflects how capital has historically rotated into the group as Washington headlines intensify and broader market volatility picks up.
Trade direction for this pattern is explicitly long, and the track record is clean: 6 winners, 0 losers, and a 100% hit rate across the last six midterm election years. Average gains of 7.4% sit close to the 8.03% median, which tells you this is not just one monster year skewing the math but a cluster of solid, mid-single to low-double-digit advances. The cumulative return across all windows clocks in at 52%, with an annualized return of 7.33%, and a Sharpe ratio of 1.41 that points to a favorable risk-adjusted profile for this specific S&P 500 Healthcare Sector SPDR trading window.
Looking at individual years, 2014 stands out as the strongest run, with XLV gaining 12.02% in the window and seeing a maximum favorable move of 16.33% from entry before settling back. At the other end of the spectrum, 2018 still finished up 7.01%, but its best intraperiod rally of 11.77% came with almost no drawdown, while 2022 delivered a 7.36% net gain despite a worst intraperiod drop of about 7.65% from the starting point. That mix shows how the same bullish seasonal tendency can play out either as a smooth grind higher or as a choppy path with a deep shakeout before the trend reasserts.
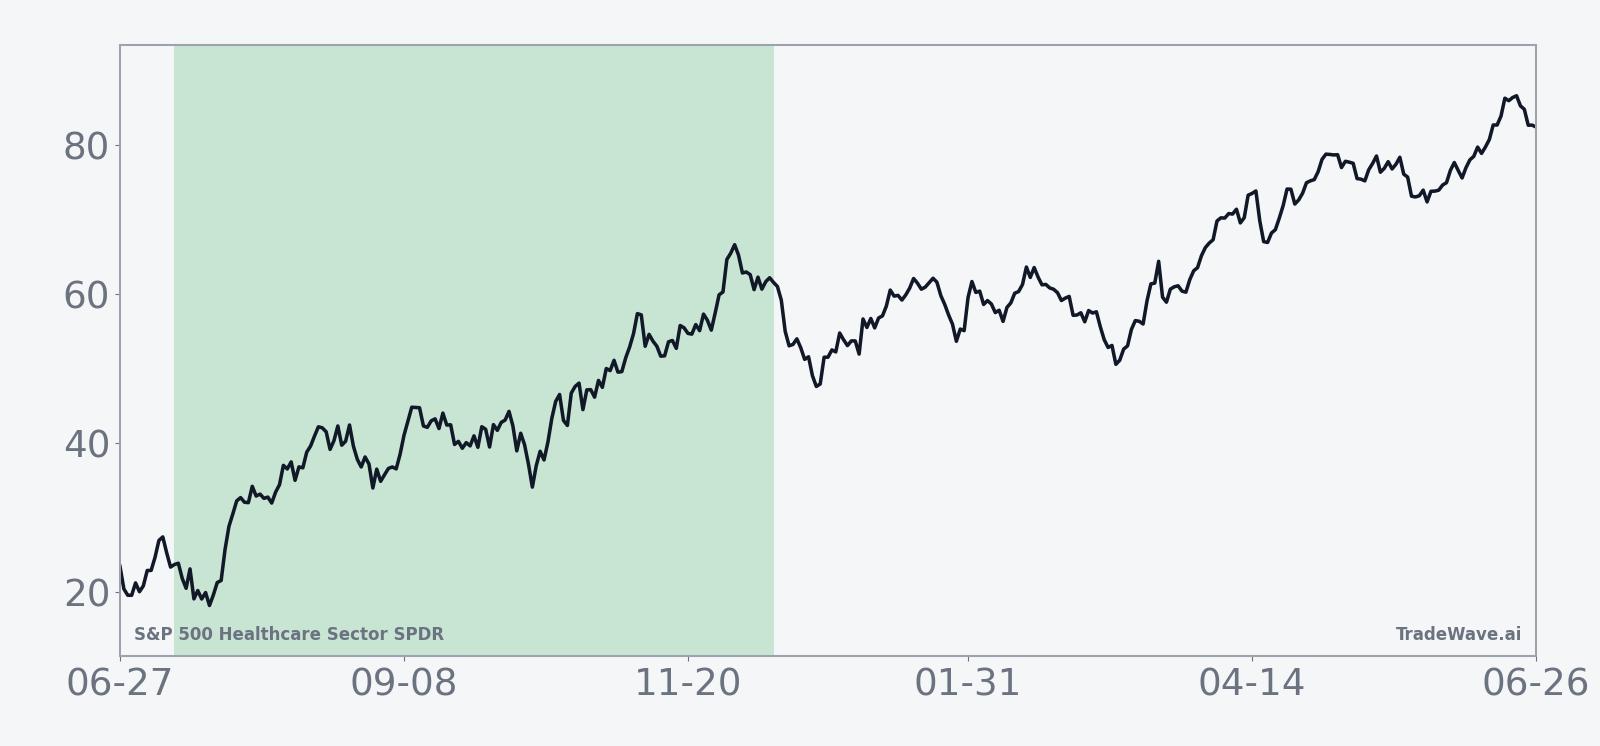
The historical seasonal average trend line for this window shows gains tending to build steadily rather than spiking all at once. In prior midterm election years, XLV has often started the window with a modest drift, then picked up momentum as the calendar moved deeper into the second half, consistent with investors leaning into health care as policy and macro noise intensify. The cumulative pattern suggests that, on average, the bulk of the move has accrued over the full span of the 155 days rather than being front-loaded into the first few weeks.
A combined view of net returns and intraperiod swings shows how far XLV has typically run in both directions before the window closes.
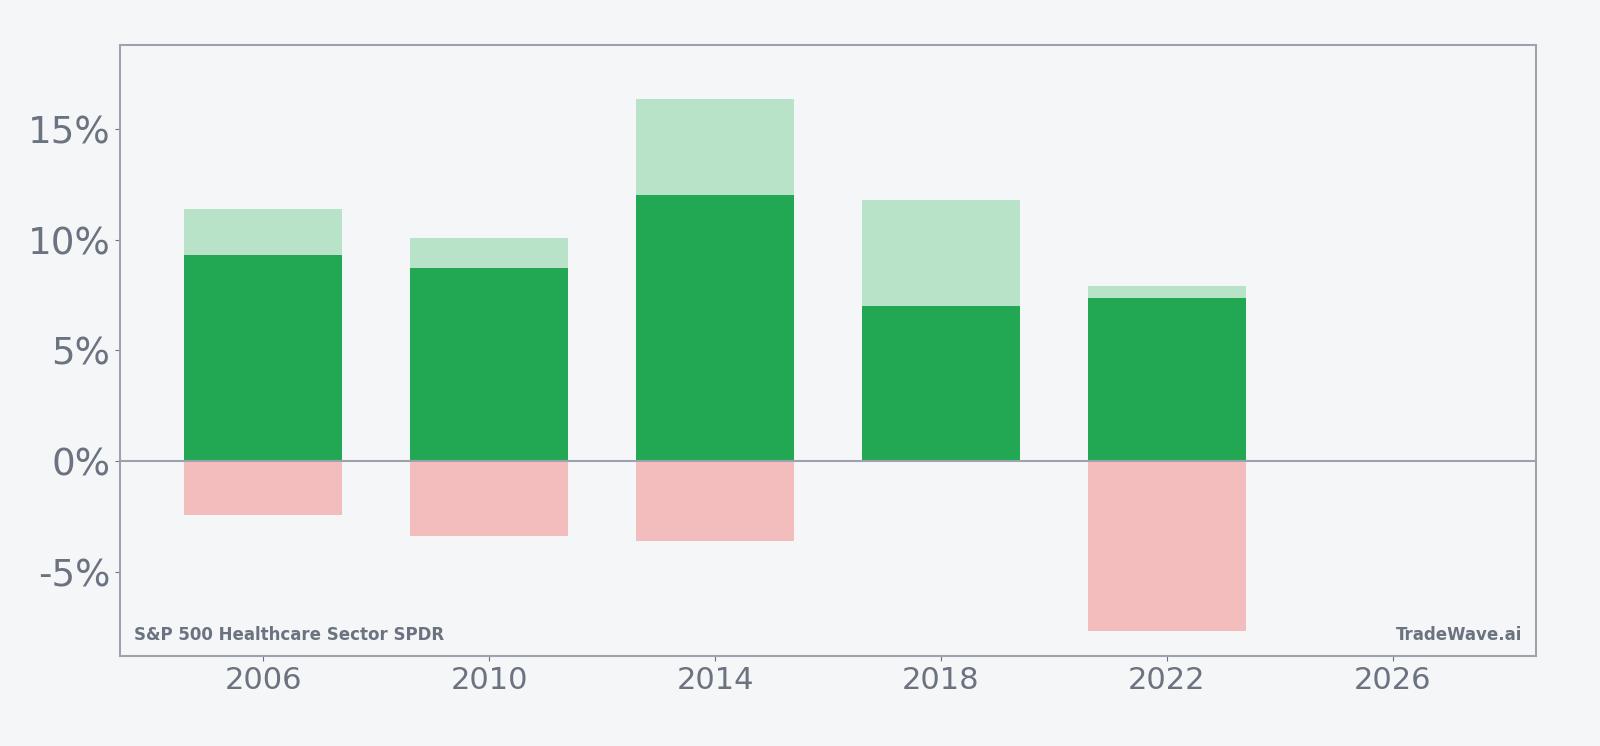
The combined net/MFE/MAE bar profile shows that in strong years like 2014, XLV’s maximum favorable move has pushed into the mid-teens while the worst drawdown stayed in the low single digits, a favorable skew for long exposure. In more volatile years such as 2022, the maximum adverse move approached the high single digits even though the final result was positive, underscoring that this historically bullish window can still deliver sharp shakeouts along the way. Add it up: six for six with positive closes, but with enough intraperiod noise that position sizing and risk management still matter.
History does not guarantee future results, and even in a window with no losing years so far, adverse excursions can be large before the seasonal tendency reasserts.
Why does S&P 500 Healthcare Sector SPDR (XLV) follow this seasonal pattern?
This midterm-year XLV seasonal pattern likely reflects a mix of election-cycle policy risk and institutional portfolio rotation. One likely driver is that health care often sits at the center of midterm campaign debates and budget talks, which can push investors toward the sector as a defensive growth haven when broader volatility rises. Analysts also point to the timing of managed-care contract cycles and fiscal-year rebalancing, which can cluster flows into large health-care names and, by extension, into S&P 500 Healthcare Sector SPDR during this part of the calendar.
What is driving S&P 500 Healthcare Sector SPDR (XLV) today?
S&P 500 Healthcare Sector SPDR has been in a firm uptrend after rebounding from a late-September low, with the ETF breaking out to lead the S&P 500 over one- and three-month horizons as health-care stocks regained leadership.[1] Technical work notes that XLV is up roughly 25% from its August trough and has already flashed a weekly overbought signal, a combination that points to a strong tape but also leaves room for a cooling-off phase even inside a bullish seasonal backdrop.[1]
Options positioning has leaned bullish as well, with traders buying substantially more calls than puts in XLV during a session when health care led gains and the Dow hit a record, signaling that some investors are using derivatives to press the upside rather than just owning the ETF outright.[2] That call-heavy skew fits with the historical seasonality but also raises the stakes: if the sector stumbles, those positions can unwind quickly and amplify short-term swings.
The chart below situates the latest move in its recent multi-month context, alongside a 60-day seasonal projection based on past midterm-year behavior.
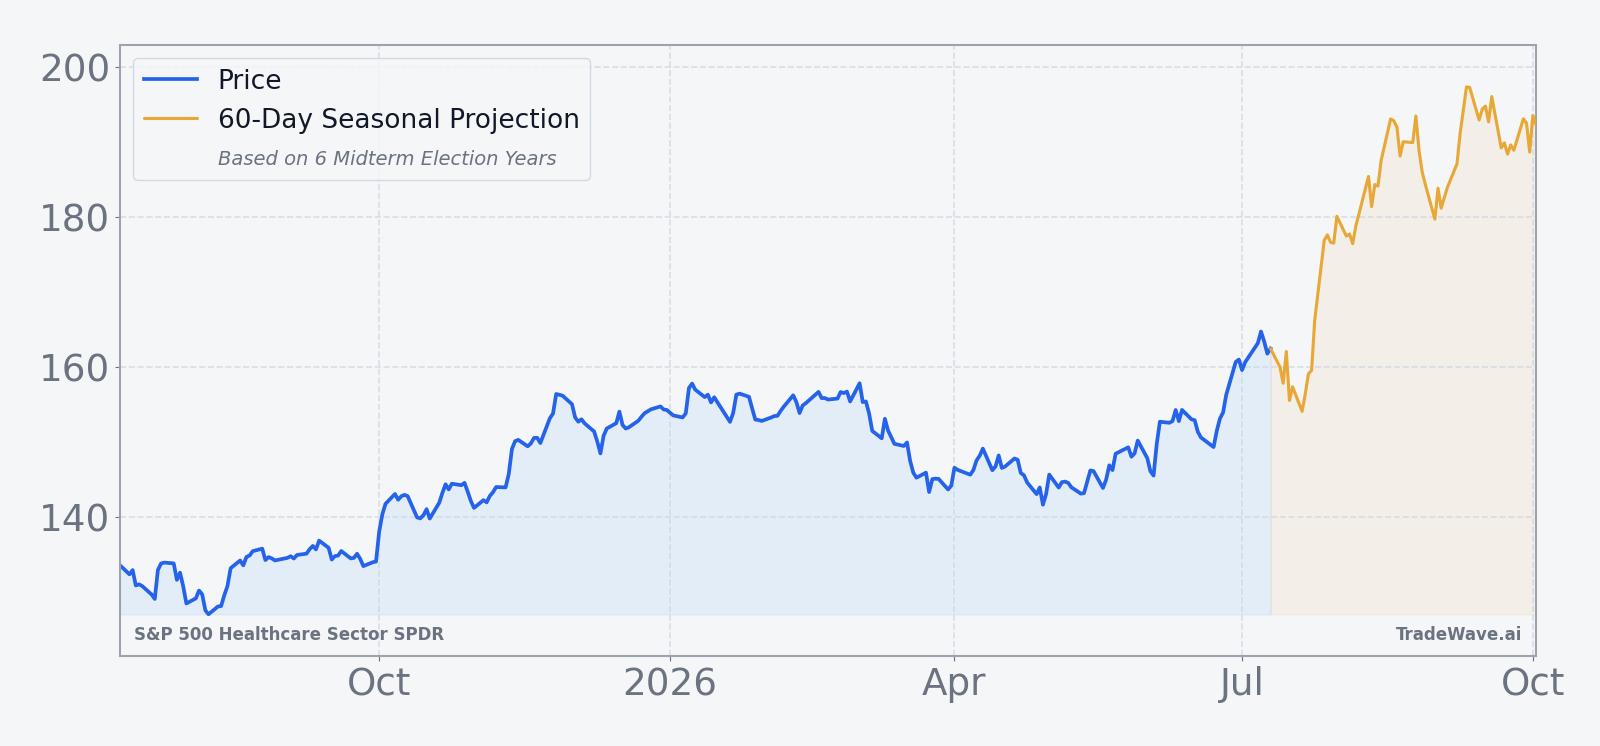
From a macro and sector-rotation standpoint, health care has reasserted itself as a leadership group after lagging during parts of 2024 and early 2025, contributing meaningfully to broader market gains in several highlighted sessions.[1] That shift fits the classic mid-cycle script in which investors rotate toward more defensive growth sectors as the expansion matures and policy uncertainty rises, giving extra context to why this particular XLV seasonal window has been so consistently positive in past midterm election years.
What should traders watch in this XLV seasonal window?
For this iteration of the pattern, the first thing to watch is whether XLV can hold its leadership role without giving back too much of the recent breakout. A pullback that stays above the 50-day moving average and respects prior resistance levels would be consistent with past midterm-year windows, where drawdowns have often been contained before the trend resumes. A deeper break that undercuts those levels would start to look different from the historical script and could signal that macro or policy forces are overwhelming the usual seasonal tailwind.
Options flow is the second key tell. If call buying in XLV remains dominant or builds further, it would suggest that institutional and tactical traders are leaning into the same bullish seasonal tendency that has worked in prior cycles.[2] A sharp swing back toward put demand or a collapse in overall options volume would hint that the crowd is backing away from the trade, which could make the ETF more vulnerable to the kind of mid-window shakeouts seen in years like 2022.
Finally, keep an eye on the policy calendar as the midterm election year progresses. Headline risk around health-care regulation, reimbursement and budget negotiations has historically been a catalyst for both the rallies and the drawdowns inside this window. If XLV can navigate those events while staying broadly aligned with its historical seasonal trend, the six-for-six record that this window carries into 2026 will remain the quiet force in the background.
Sources
About this seasonal analysis
Seasonal pattern data is sourced from TradeWave.ai, which analyzes historical price behavior across annual calendar windows going back up to 30 years. Read the full data methodology or the book The 100-Year Pattern by Afshin Moshrefi (2026 edition). Past performance of seasonal patterns does not guarantee future results. This article is for informational purposes only and does not constitute investment advice.