At 667.74, Nasdaq QQQ Invesco ETF (QQQ) Trades Below Highs With a 100% Midterm Win Record
Nasdaq QQQ Invesco ETF is approaching a midterm-year seasonal window that has never lost money in this dataset, even as the ETF trades well below its 52-week high and tech investors weigh policy and macro risks into 2027.
What is the seasonal pattern for Nasdaq QQQ Invesco ETF (QQQ)?
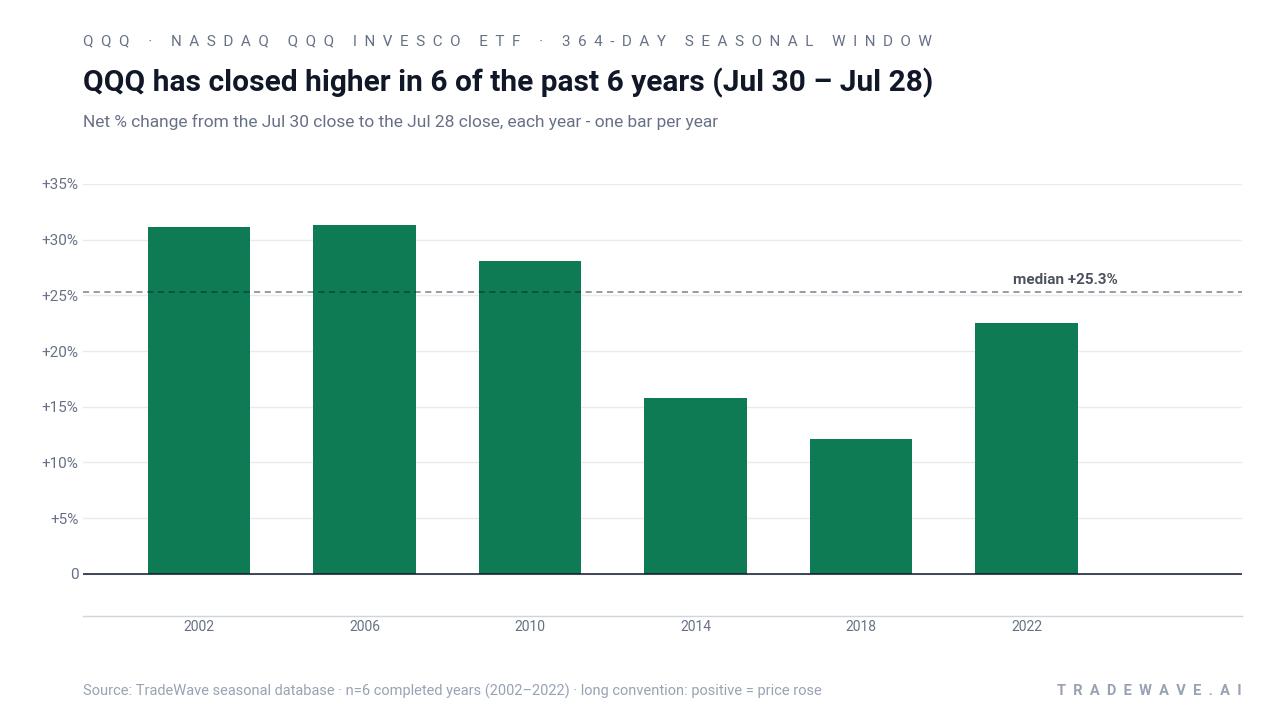
Nasdaq QQQ Invesco ETF has risen in 6 of 6 midterm-election-year windows starting around late July, with an average gain of 23.49% in winning years.
- 6 for 6 in this window, with winning years averaging 23.49% gains across the last six midterm election years.
- The upcoming window begins Jul 30, 2026 and runs for 364 trading days, spanning the late midterm year into the pre-election year.
- Percent Profitable is 100%, with 6 winners and 0 losers in this Nasdaq QQQ Invesco ETF trading window.
- Average annualized return across the sample is 23.26%, with a cumulative 250% gain when the six windows are chained together.
- The TradeWave Ratio of 2.36 suggests price has typically traveled meaningfully in the long direction within the window, even before final outcomes.
- Individual years have still seen sizable intraperiod drawdowns, with adverse moves as deep as the high teens before recovering.
According to historical data from TradeWave.ai, this midterm-year stretch has behaved very differently from an average calendar year for QQQ, and the next iteration is about to start.
How has Nasdaq QQQ Invesco ETF (QQQ) traded in this midterm-year window?
Nasdaq QQQ Invesco ETF has posted gains in all six prior midterm-election-year windows that start around Jul 30 and run for roughly a full year, averaging 23.49% in those winning stretches. The ETF last traded at 667.74, leaving it about 10.4% below its 52-week high of 747.00 and roughly 22.3% above its 52-week low of 546.28. That combination of a strong historical seasonal trend and a pullback from the highs gives this upcoming window unusual weight for traders trying to time exposure to the market’s dominant tech and growth names.
Because this pattern is grouped by the presidential election cycle, it specifically looks at how QQQ behaves in the late part of midterm election years as markets transition into the year before the presidential election. That is when policy visibility often improves, fiscal and regulatory paths are clearer, and risk appetite in growth and tech has historically rebuilt after earlier midterm volatility.
The trade direction for this setup is long, and every one of the six historical windows delivered a positive net return by the end of the 364 trading days. Average profit across those years is 23.49%, with a median outcome of 25.27%, which means the typical result has been a mid‑20s gain rather than a single outlier skewing the numbers. Chaining the six windows together produces a 250% cumulative gain and a 23.26% annualized return, a profile that would stand out even for a high‑beta tech vehicle.
Individual years show a range of outcomes but all in the green. The strongest window in this sample came in 2006, when QQQ gained 31.28% with a maximum favorable move of 36.99% from the entry. The softest year was 2018, which still finished up 12.11% after a choppy path that included a 17.69% adverse move at one point before recovering.
The intraperiod path matters as much as the final score. Maximum favorable excursions have ranged from roughly 12% to nearly 37%, showing that when this window works, it often delivers sizable rallies at some point during the year. At the same time, maximum adverse excursions have reached into the mid‑ to high‑teens in several cycles, including 2002, 2018 and 2022, underscoring that even “all‑winner” windows can involve deep drawdowns before finishing higher.
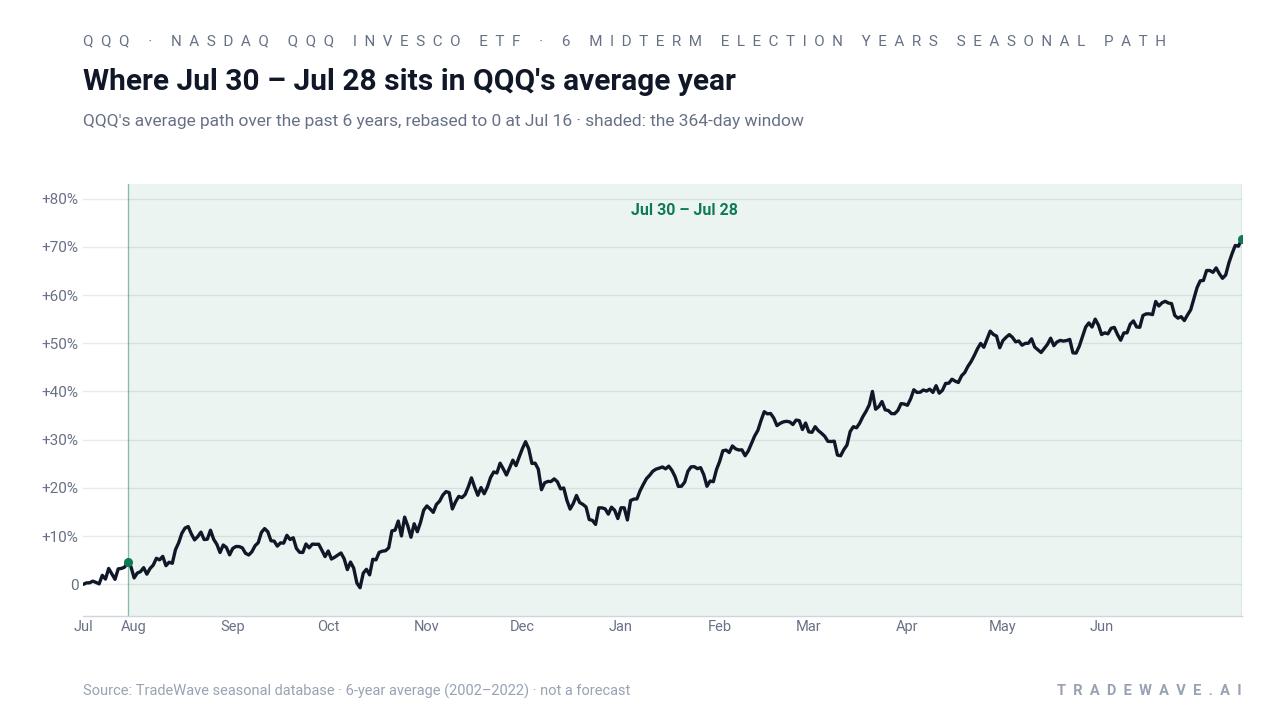
The historical seasonal trend line for this window tilts steadily higher rather than spiking in a single month, which fits a story of persistent buying interest as the midterm year gives way to the year before the presidential election. The curve suggests that gains have tended to accrue over many months, with some acceleration as the calendar moves deeper into the pre-election year, instead of a quick pop that fades.
A combined view of net returns, best rallies and worst drawdowns shows how much room QQQ has historically had to run and to fall inside this window.
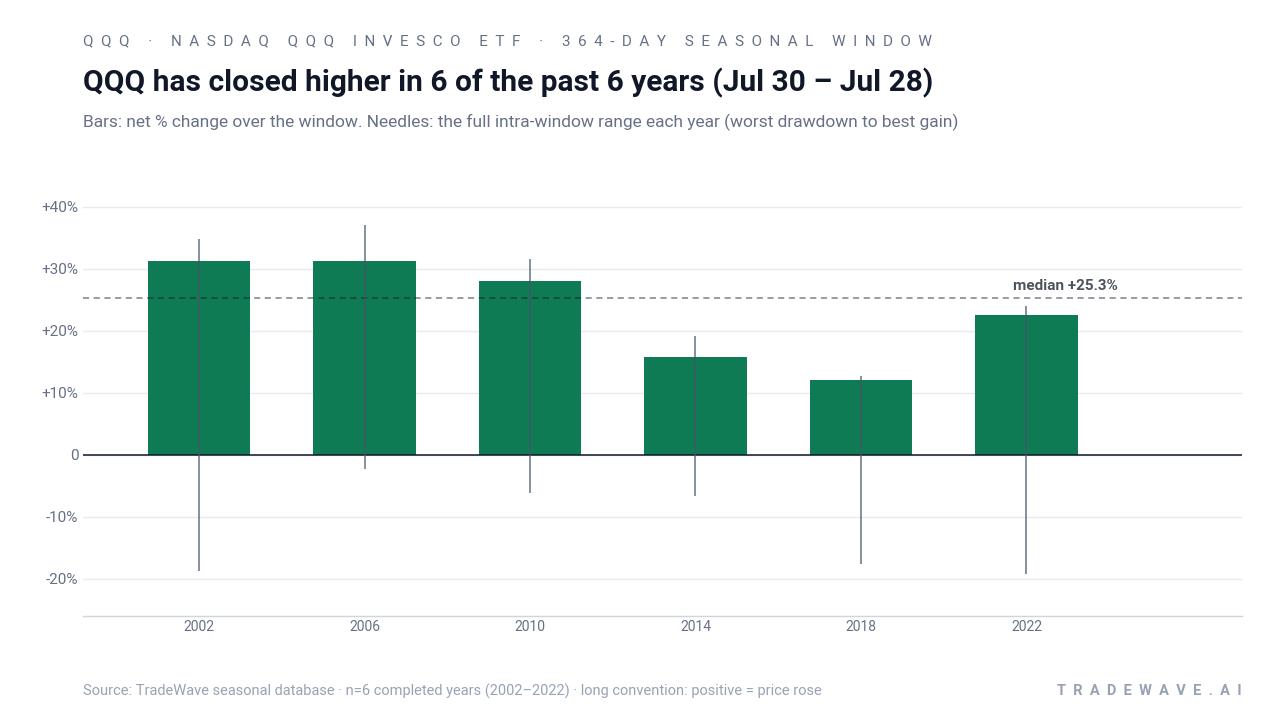
The bars chart makes the trade‑off clear: every bar ends above zero, but the red segments for adverse moves often extend into double‑digit losses before the green favorable segments dominate. Large MFE combined with sizable MAE points to a high‑energy window where QQQ has historically swung hard in both directions before finishing higher, which matters for anyone sizing positions or setting risk limits around this pattern.
History does not guarantee future results; adverse excursions can be large even in winning windows, and past seasonal behavior may not repeat.
Why does Nasdaq QQQ Invesco ETF (QQQ) follow this seasonal pattern?
This midterm-to-pre-election pattern may reflect how policy clarity and liquidity conditions evolve late in the U.S. election cycle. One likely driver is that by the back half of the midterm year, major fiscal and regulatory battles are often settled, allowing institutional investors to rebuild exposure to growth and tech ahead of the typically risk‑on year before the presidential election. The clustering of big‑cap tech earnings, index rebalances and options flows across this span can amplify that effect, turning a macro backdrop of reduced uncertainty into a persistent bid for QQQ.
What is driving Nasdaq QQQ Invesco ETF (QQQ) today?
QQQ last changed hands at 667.74, up 0.93% on the day, with the ETF sitting about 10.4% below its 52-week high of 747.00 and roughly 22.3% above its 52-week low of 546.28. Intraday moves have tracked the broader tech complex, with traders using QQQ as a liquid proxy for Nasdaq 100 sentiment as they react to shifting expectations for growth, inflation and interest rates across the second half of the midterm election year.[1]
The chart below situates the latest move in its recent multi-month context alongside a short seasonal projection.
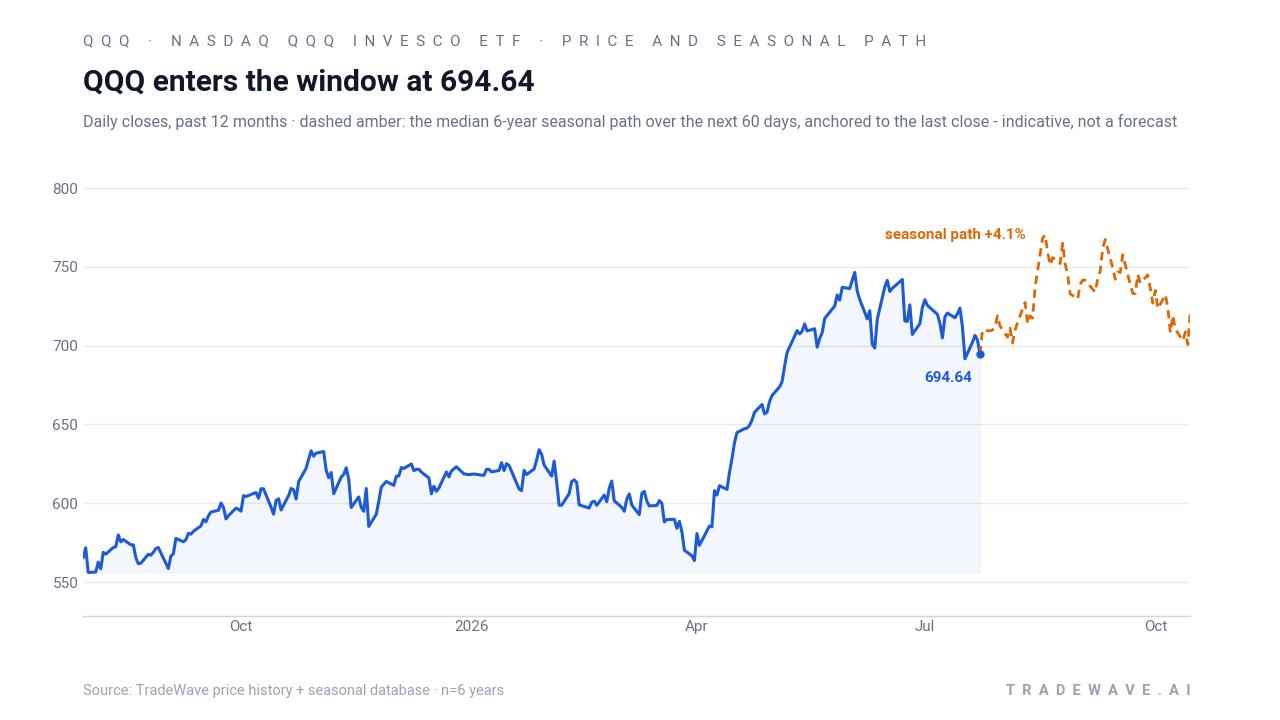
Average 20-day volume of about 43.7 million shares underlines QQQ’s role as the go‑to vehicle for expressing views on mega‑cap tech, AI and broader risk appetite. With the ETF already off its highs and the long midterm-year seasonal window set to begin on Jul 30, positioning decisions in the coming weeks will determine whether this cycle lines up with the six-for-six historical record or breaks the pattern.
What should traders watch as this QQQ seasonal window approaches?
First, the calendar: the new 364‑day window kicks off on Jul 30, placing most of its life inside the year before the presidential election, which has often been a supportive backdrop for risk assets. Second, levels: how QQQ behaves around the 52-week low near 546 and the 52-week high around 747 will show whether buyers are willing to lean into the historical seasonal trend or treat rallies as exits instead of entries. Third, macro and policy catalysts: rate expectations, fiscal debates and any new tech regulation headlines will shape whether this midterm-to-pre-election stretch again delivers the kind of double‑digit rallies seen in 2006 and 2010 or something more muted.
Finally, volatility inside the window will matter as much as direction. In prior cycles, QQQ has often suffered mid‑teens drawdowns before finishing the year with strong gains, so traders may focus on whether early pullbacks stay within that historical MAE range or break below it. If downside swings remain contained while upside excursions build, the pattern’s long bias will look intact; if drawdowns deepen without the usual recovery, that would be an early sign that this cycle is diverging from the six‑for‑six record.
Sources
About this seasonal analysis
Seasonal pattern data is sourced from TradeWave.ai, which analyzes historical price behavior across annual calendar windows going back up to 30 years. Read the full data methodology or the book The 100-Year Pattern by Afshin Moshrefi (2026 edition). Past performance of seasonal patterns does not guarantee future results. This article is for informational purposes only and does not constitute investment advice.