This 363-Day Midterm Stretch Has Delivered 6 Straight Gains for S&P 500 Technology Sector SPDR (XLK)
S&P 500 Technology Sector SPDR is nearing a 363-day midterm-election seasonal window that has never produced a loss in the last six cycles, putting a powerful historical tailwind on tech’s radar.

What is the seasonal pattern for S&P 500 Technology Sector SPDR (XLK)?
S&P 500 Technology Sector SPDR has risen in 6 of 6 midterm-election-year windows during this 363-day stretch, with an average gain of 21.17% in winning years.
- 6 for 6 in this window, with S&P 500 Technology Sector SPDR averaging 21.17% gains in each winning year.
- Seasonal window begins Jul 31, 2026 and runs for 363 trading days across the last 6 midterm election years.
- Percent Profitable is 100%, with 6 winners and 0 losers in the historical sample.
- Average profit of 21.17% per window comes alongside a 21.0% annualized return and a Sharpe ratio of 2.41.
- TradeWave Ratio of 2.5 signals that price has typically traveled meaningfully in the long direction within the window, even as some years saw double-digit drawdowns.
- Maximum adverse excursions reached roughly 20% in several cycles, so the path has not been smooth even in an all-win sample.
According to historical data from TradeWave.ai, this upcoming midterm-election stretch for XLK has behaved very differently from an average year on the calendar.
How strong is the upcoming seasonal window for S&P 500 Technology Sector SPDR (XLK)?
Across the last six midterm election years, this 363-day window has delivered a gain for S&P 500 Technology Sector SPDR every single time, averaging 21.17% per cycle. The next iteration of that window is set to begin on Jul 31, 2026, and it runs long enough to cover the late midterm year and most of the following pre-election year, a span that has often been friendly to risk assets. For tech investors who think in election cycles rather than just quarters, this is one of the cleanest bullish seasonal trends on the XLK calendar.
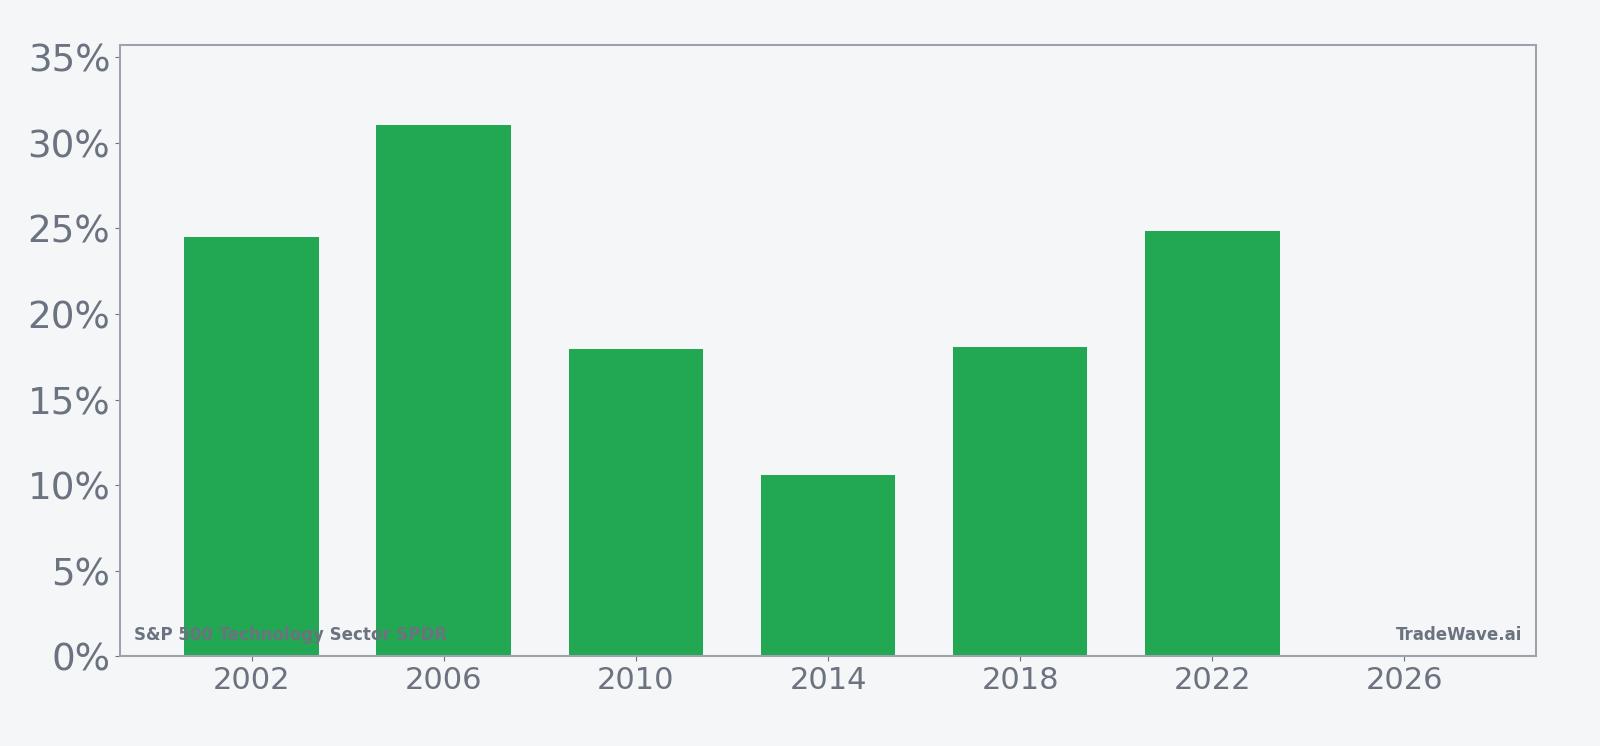
Grouping the data by the presidential election cycle matters here because this window sits squarely in the midterm election year and then rolls into the year before the presidential election, a phase that has often coincided with clearer policy visibility and a more supportive liquidity backdrop for growth stocks. XLK’s pattern is measured only across those midterm-year instances, so the 6-for-6 record reflects how tech has behaved in this specific political and macro regime, not across random calendar years.
Historically, the trade direction for this XLK seasonal pattern is long, and the results have been unusually consistent: 100% of the six midterm-year windows ended higher, with no losing years in the sample. Average profit of 21.17% lines up with a 21.0% annualized return, and the Sharpe ratio of 2.41 signals that the end-of-window outcomes have been strong even after accounting for volatility. The median gain of 21.29% is close to the average, which tells you the wins have not been skewed by a single outlier year.
Looking at individual cycles, 2006 stands out as the strongest, with a 31.05% net return from entry to exit, while 2014 was the softest at 10.59%. In 2002, XLK still managed a 24.5% gain despite a maximum adverse move of about 20.39% inside the window, showing how deep drawdowns did not prevent a strong finish. Even the more modest 2014 outcome still delivered double-digit upside, which keeps the all-years average firmly in the low 20s.
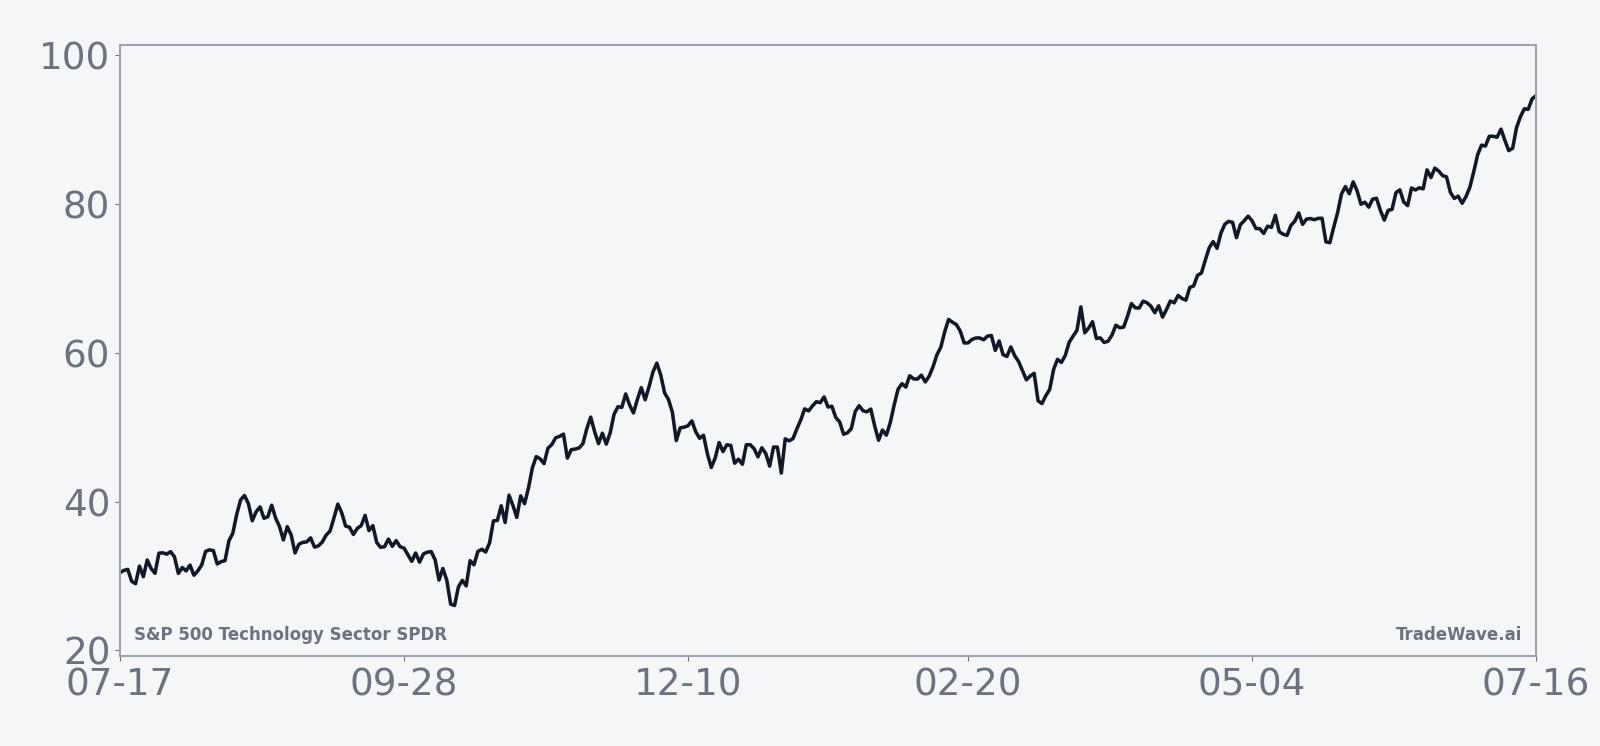
The historical seasonal trend chart shows a fairly steady climb rather than a single explosive burst, with gains accruing across much of the 363-day span. That suggests the typical XLK seasonal trend in midterm years has been to grind higher over time, with some acceleration as the window progresses into the pre-election phase. The cumulative return profile, at 213% across the six windows, reflects how those individual years stack when you line them up back to back.
Year-by-year bars that include both peak rallies and worst drawdowns help clarify how much XLK has tended to move inside this window before settling at its final result.
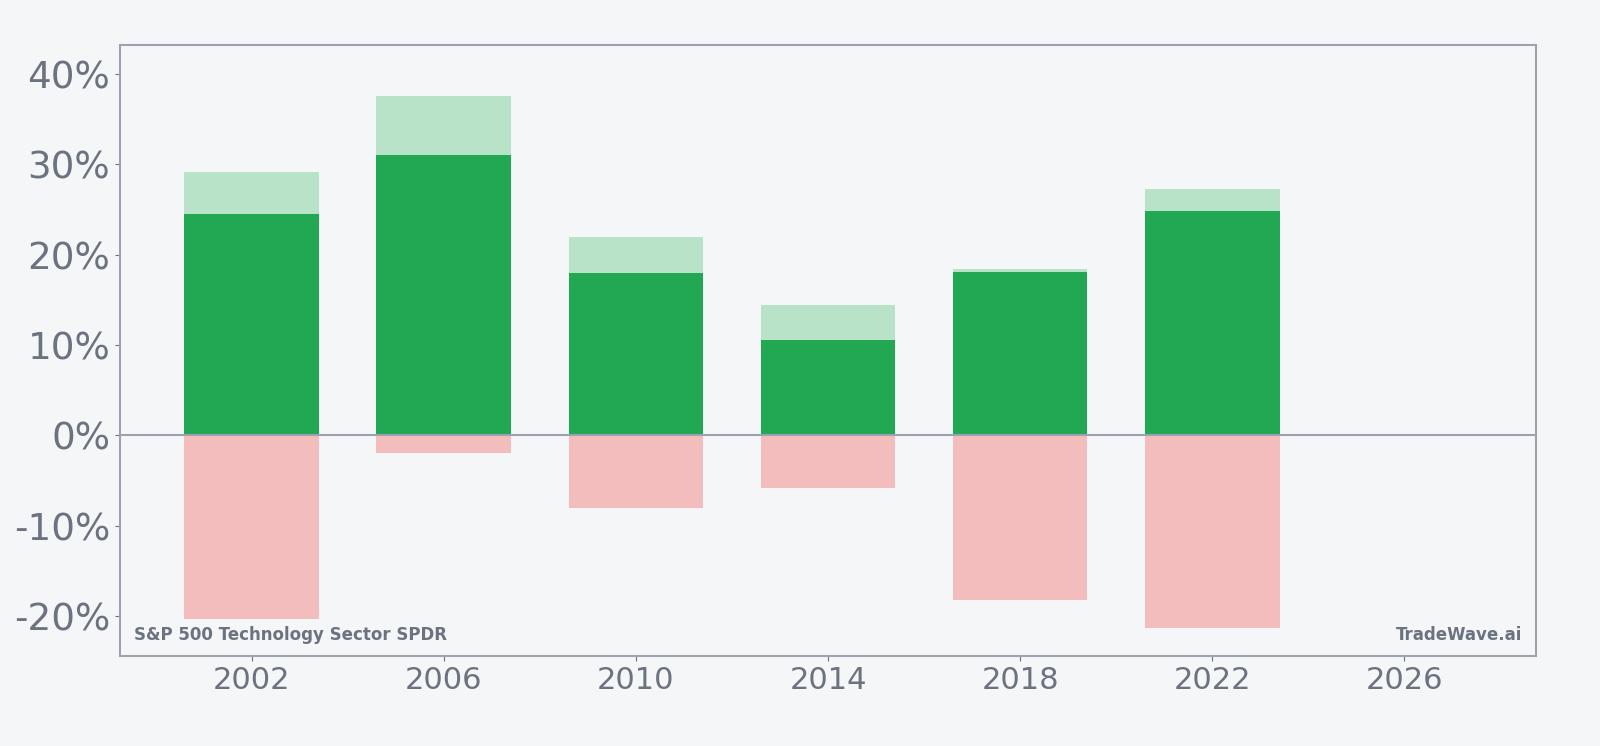
The bars with maximum favorable and maximum adverse excursions show that XLK’s upside potential and downside risk have both been meaningful inside this window. In 2006, for example, the maximum favorable move reached 37.62%, while the worst drawdown was only about 1.97%, a relatively smooth ride for a 31.05% gain. By contrast, 2018 and 2022 both saw maximum adverse excursions near 18% to 21% even though they finished up 18.08% and 24.85% respectively, underscoring that investors had to sit through sizable pullbacks to capture the full seasonal trend.
History does not guarantee future results; adverse excursions (MAE) can be large even in winning windows.
Why does S&P 500 Technology Sector SPDR (XLK) follow this seasonal pattern?
One likely driver is the way the tech sector’s earnings calendar and capital spending plans line up with the midterm and pre-election policy cycle, which can reduce regulatory uncertainty and support risk appetite. Analysts also point to institutional portfolio rebalancing and sector rotation into growth as the pre-election year approaches, especially when fiscal or monetary policy looks more predictable. This XLK seasonal trend may reflect that combination of clearer policy signals, stronger earnings visibility, and renewed appetite for higher-beta exposure as investors look ahead to the next presidential race.
What is driving S&P 500 Technology Sector SPDR (XLK) today?
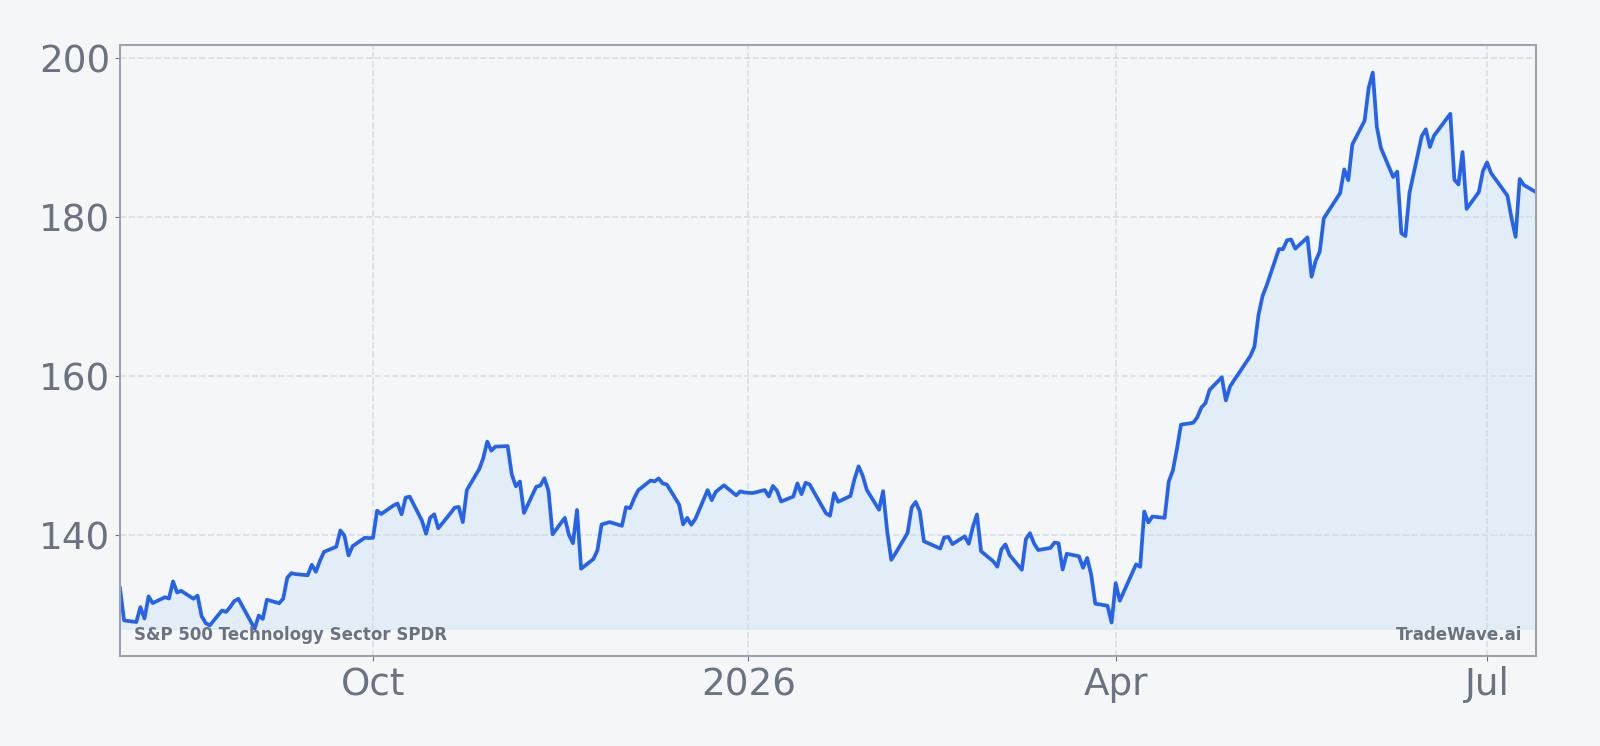
With no fresh macro or sector-specific headlines in the latest dataset and today’s quote data unavailable, XLK is effectively trading between a 52-week low near 62.64 and a high around 198.26, a range that highlights how far the fund has already run in this cycle. The 50-day moving average sits near 181.17 on 20-day average volume of about 11.5 million shares, a reminder that even modest pullbacks can unfold against a backdrop of heavy liquidity in the S&P 500’s tech sleeve. For traders watching the XLK seasonal trend into the 2026 midterm year, the key question is how the fund behaves as it approaches that long, historically bullish window starting Jul 31, 2026.
The chart below situates the latest moves in XLK within its past year of trading and overlays a short-term seasonal projection.
What should traders watch as the XLK seasonal window approaches?
First, the calendar: the next iteration of this 363-day XLK seasonal window opens on Jul 31, 2026, so the coming quarters are about positioning rather than immediate execution. Second, the price levels: how XLK trades around its 50-day moving average and within the wide 52-week band between roughly 62.64 and 198.26 will shape the risk-reward profile heading into that stretch. Third, volatility inside the window: prior cycles show that even all-winning years came with maximum adverse moves that sometimes pushed near 20%, so traders will want to gauge whether any future drawdowns stay within that historical envelope or break it. Finally, because this pattern bridges the midterm election year into the year before the presidential election, policy headlines and rate expectations around that transition will be crucial in confirming or challenging the historical XLK seasonal trend.
Sources
About this seasonal analysis
Seasonal pattern data is sourced from TradeWave.ai, which analyzes historical price behavior across annual calendar windows going back up to 30 years. Read the full data methodology or the book The 100-Year Pattern by Afshin Moshrefi (2026 edition). Past performance of seasonal patterns does not guarantee future results. This article is for informational purposes only and does not constitute investment advice.