6-for-6 Midterm Streak: S&P 500 Healthcare Sector SPDR (XLV) Enters 137-Day Rally Window
S&P 500 Healthcare Sector SPDR is trading inside a historically strong midterm-year seasonal window that has delivered double-digit gains in prior cycles, just as options traders lean bullish on the sector.

What is the seasonal pattern for S&P 500 Healthcare Sector SPDR (XLV)?
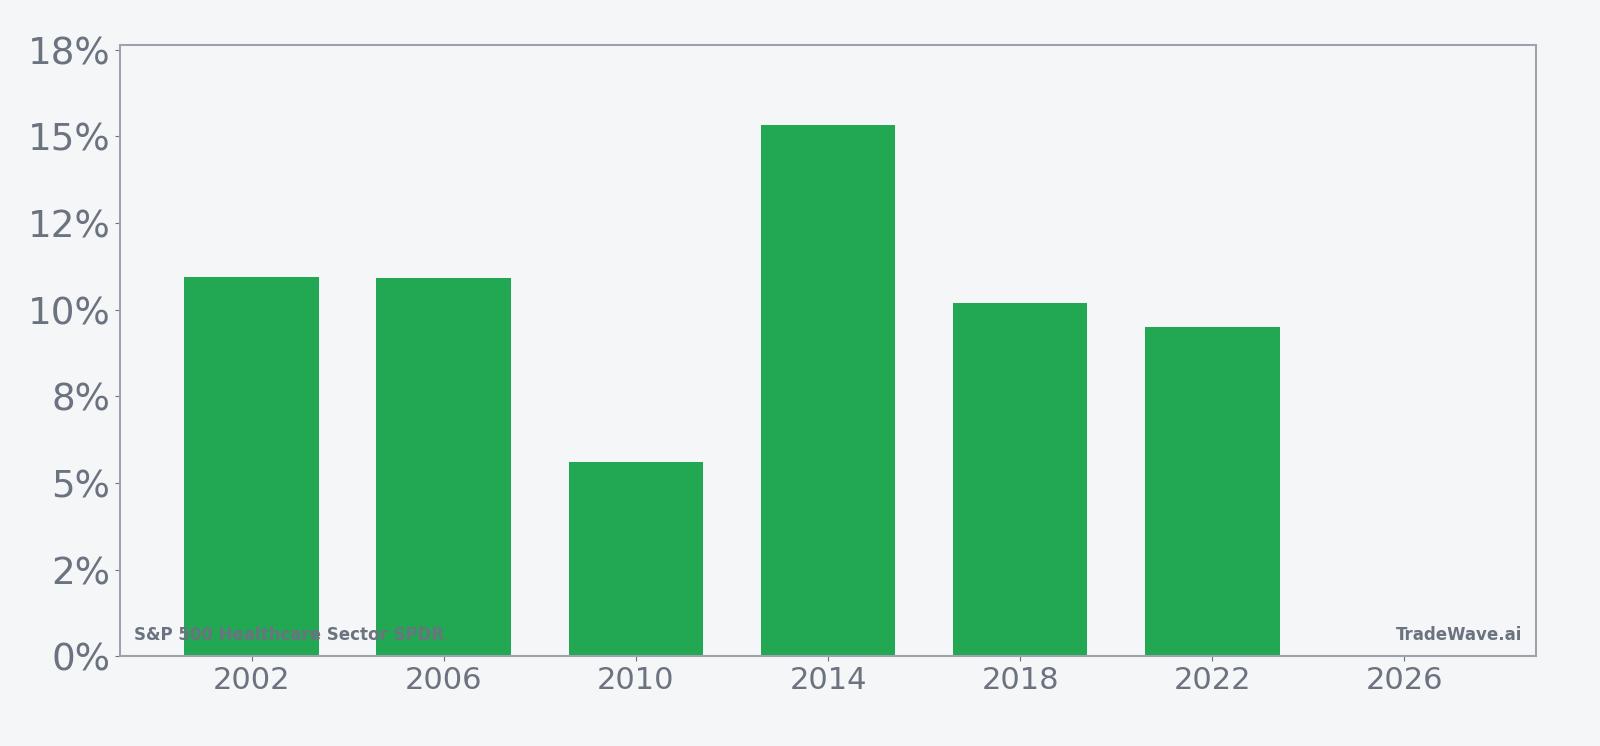
S&P 500 Healthcare Sector SPDR has risen in 6 of 6 midterm-year windows starting around Jul 17, with an average gain of 10.42% in winning years.
- 6 for 6 in this window, with XLV posting average gains of 10.42% across all six winning years.
- The current midterm-year window began on Jul 17 and spans 137 trading days, covering the late midterm phase into the run-up toward the pre-election year.
- Percent Profitable is 100%, with 6 winners and 0 losers across the last six midterm election years in this specific trading window.
- Average profit in winning years is 10.42%, with individual net returns ranging from 5.61% to 15.34%.
- The TradeWave Ratio is 3.98, indicating that price has typically traveled meaningfully in the long direction within the window, while the Sharpe ratio of 2.86 points to a historically strong risk-adjusted profile.
- Intraperiod swings have still mattered, with past years showing adverse moves as deep as about 12.74% before finishing higher.
According to historical data from TradeWave.ai, this midterm-year stretch has behaved very differently from an average calendar quarter for XLV. The next section walks through how that pattern has played out in prior cycles and what it implies for the current window.
How has S&P 500 Healthcare Sector SPDR (XLV) traded in this midterm-year window?
Grouping by the presidential election cycle, S&P 500 Healthcare Sector SPDR has rallied in every one of the last six midterm election years during the 137-day window that starts around Jul 17, averaging gains of 10.42% for long positions. XLV is currently trading inside that window, which runs through roughly late December, with the fund coming off a strong one-month advance of 7.83% and sitting between its 52-week low near 123.61 and high at 165.61. In early June, options traders showed heavy call buying in XLV, with roughly 85% of about $13 million in options turnover tied to calls, a sign of bullish positioning that could amplify any seasonal tailwind if it persists.[1] The combination of a clean 6-for-6 historical record, a firm recent price trend and visible options interest turns this otherwise quiet healthcare ETF into a focal point for election-cycle seasonality watchers.
Presidential election-cycle grouping matters here because this window sits in the back half of the midterm election year, just ahead of the historically strong pre-election year when risk appetite often improves. In prior cycles, that backdrop has lined up with a steady bid for defensive growth sectors like healthcare as investors balance policy uncertainty with earnings visibility.
The seasonal window that began on Jul 17 and runs for 137 trading days has been a cleanly bullish stretch for XLV in the last six midterm election years. The trade direction is long, and every instance in the sample finished positive, with net returns between 5.61% and 15.34%. Average profit across all six years is 10.42%, while the median outcome is slightly higher at 10.54%, which points to a fairly tight cluster of double-digit gains rather than a pattern driven by one outlier year.
Looking at individual cycles, 2014 stands out as the strongest year in this window, with XLV gaining 15.34% from entry to exit and seeing a maximum favorable move of 16.25% at the best point in the trade. At the other end of the range, 2010 delivered the softest outcome, with a 5.61% net gain and a 10.7% best intraperiod rally, still comfortably positive for a long setup. Even 2022, a challenging year for many risk assets, saw XLV advance 9.51% in this same midterm-year slice.
The intraperiod path has not been a straight line. In 2002, XLV’s maximum adverse move within the window reached about 12.74% below the entry before the ETF recovered to finish up 10.94%. Other years saw more modest drawdowns, with adverse excursions between roughly 0.76% and 5.51%. That mix explains why the Sharpe ratio for the pattern is a robust 2.86, yet the TradeWave Ratio of 3.98 signals that price has often traveled significantly in the trade direction before the window closes.
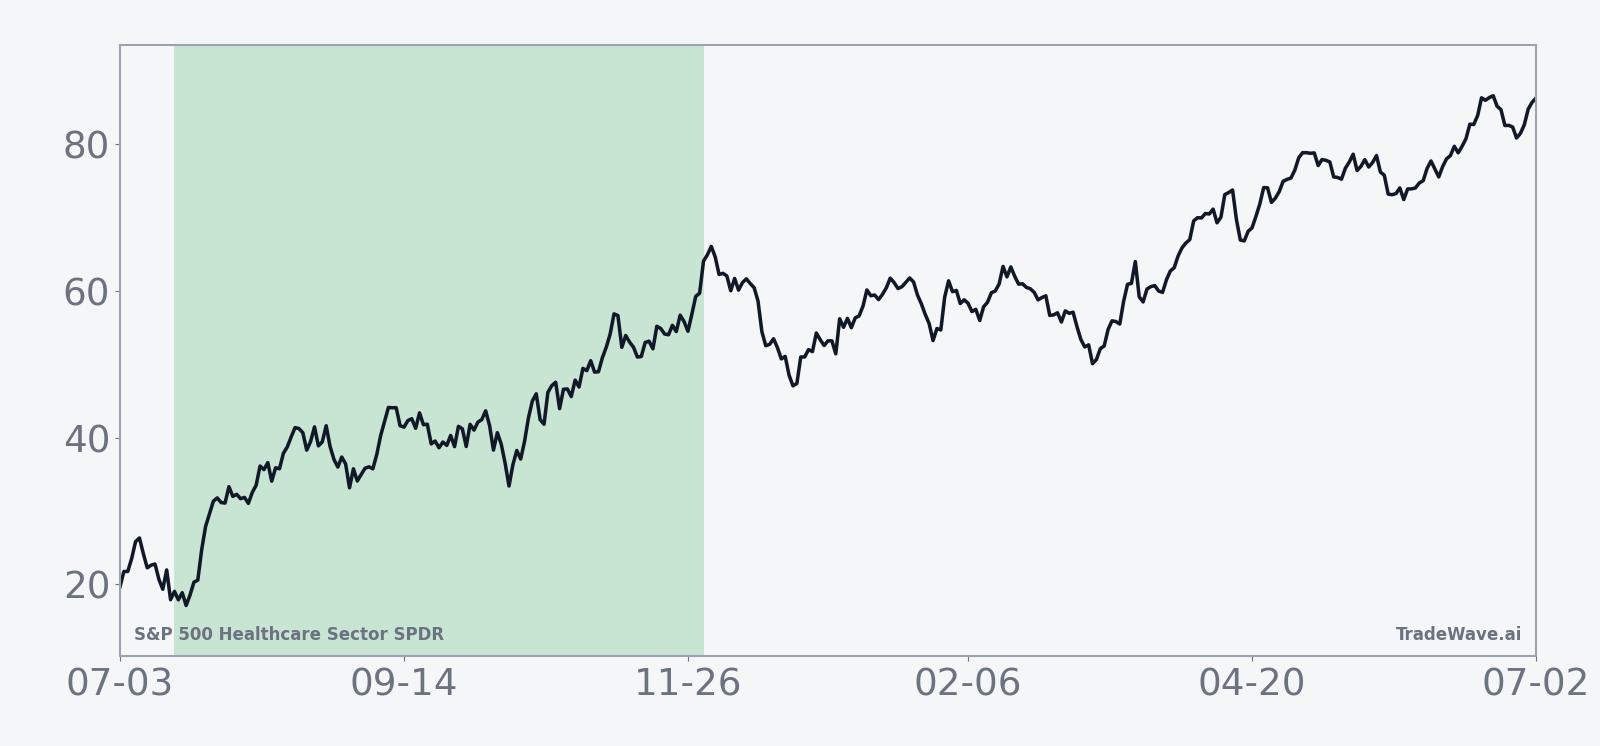
The historical seasonal trend chart shows a pattern of early strength that tends to build gradually rather than spike, with gains accruing across much of the window. The average path slopes higher with only shallow pauses, suggesting that in prior midterm years, pullbacks inside this stretch have tended to be bought rather than sold aggressively.
The combined net, best-case and worst-case moves by year underline how much room XLV has historically had to run, and how deep the dips have occasionally been along the way.
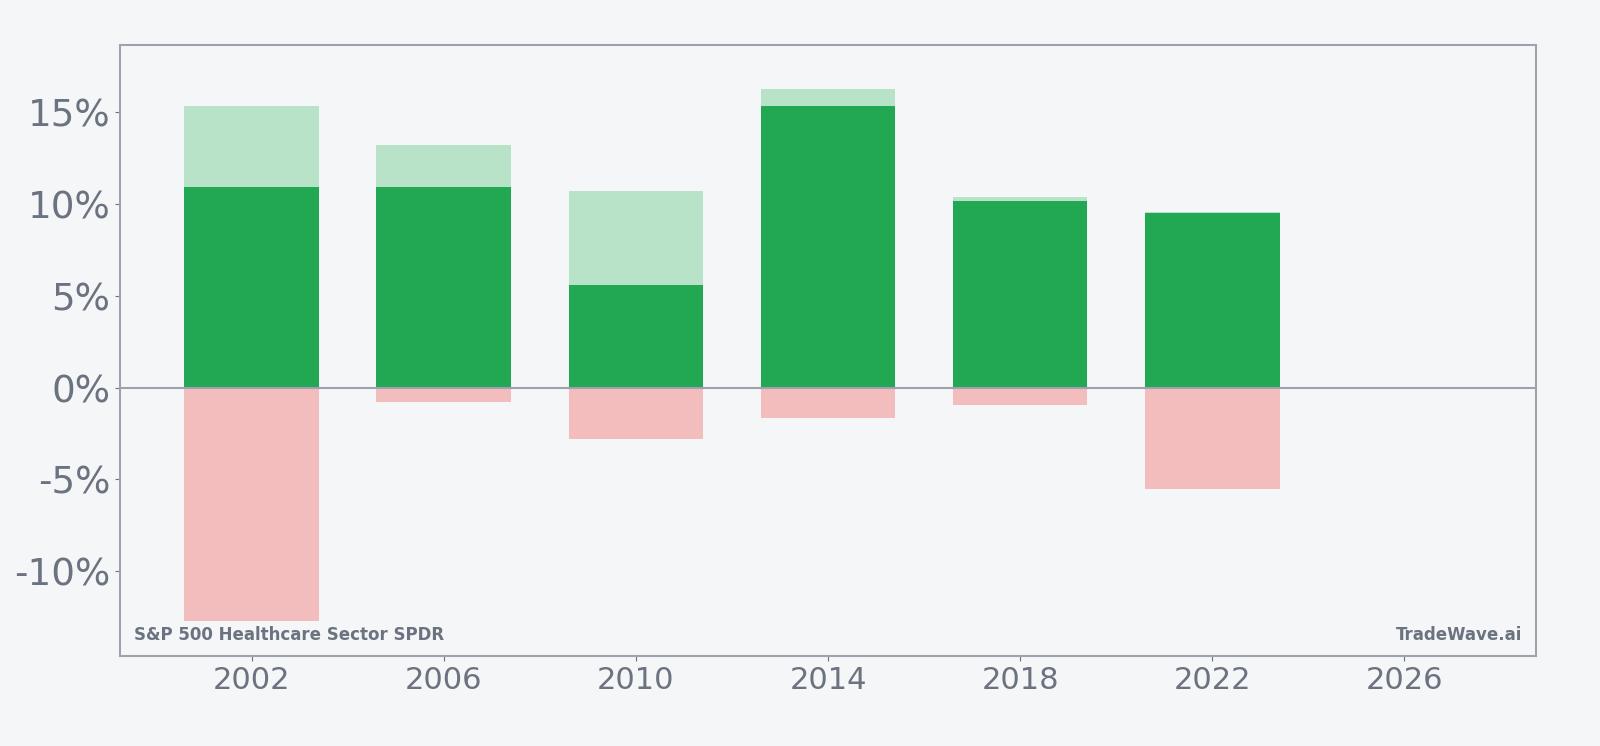
The stacked net/MFE/MAE view shows that in strong years like 2014 and 2002, XLV’s best intraperiod rallies pushed into the mid-teens, while even the weaker years still saw high single-digit upside at some point in the window. At the same time, the 2002 bar highlights that adverse swings can be sharp, with a double-digit drawdown preceding a winning outcome, whereas other years kept downside contained to low single digits. The pattern is clear: this window has favored longs in all six midterm election years in the sample, but it has not eliminated the risk of meaningful pullbacks along the way.
History does not guarantee future results; adverse excursions (MAE) can be large even in winning windows.
Why does S&P 500 Healthcare Sector SPDR (XLV) follow this seasonal pattern?
One likely driver is the way healthcare earnings and policy headlines cluster in the back half of the midterm election year, when Washington often shifts from legislating to campaigning and regulatory risk can feel more contained. Analysts have also pointed to institutional portfolio rebalancing, with managers rotating toward defensive growth sectors like healthcare as they position for the historically stronger pre-election year. This pattern may also reflect sector rotation out of early-cycle winners into more stable cash-flow stories as the macro and policy backdrop matures late in the midterm year.
What is driving S&P 500 Healthcare Sector SPDR (XLV) today?
XLV’s latest move sits on top of a broader recovery that began after a late-September bottom in 2025, when the fund had rallied roughly 25% off its August low and flashed a weekly overbought reading on some technical gauges.[1] That earlier surge helped reset the healthcare sector from laggard to leader as investors rotated into beaten-down defensives during a macro-driven rally, and it set the stage for the current midterm-year window by lifting XLV closer to its 52-week high near 165.61.
More recently, options flow has tilted bullish. On Jun 5, 2026, options traders bought significantly more calls than puts in XLV, with about $11 million of roughly $13 million in options turnover tied to calls as healthcare stocks led gains.[1] That kind of skew suggests traders are willing to pay up for upside exposure in the sector ETF, a stance that lines up with the historical seasonal bias but also raises the stakes if the pattern stumbles.
Healthcare’s leadership has been part of a broader sector-rotation story, as investors look for areas with resilient earnings and less direct sensitivity to cyclical growth scares.[1] XLV, which bundles large-cap pharmaceutical, biotech, managed care and medical device names, has benefited from that shift as a liquid way to express a defensive growth view without stock-picking single names.
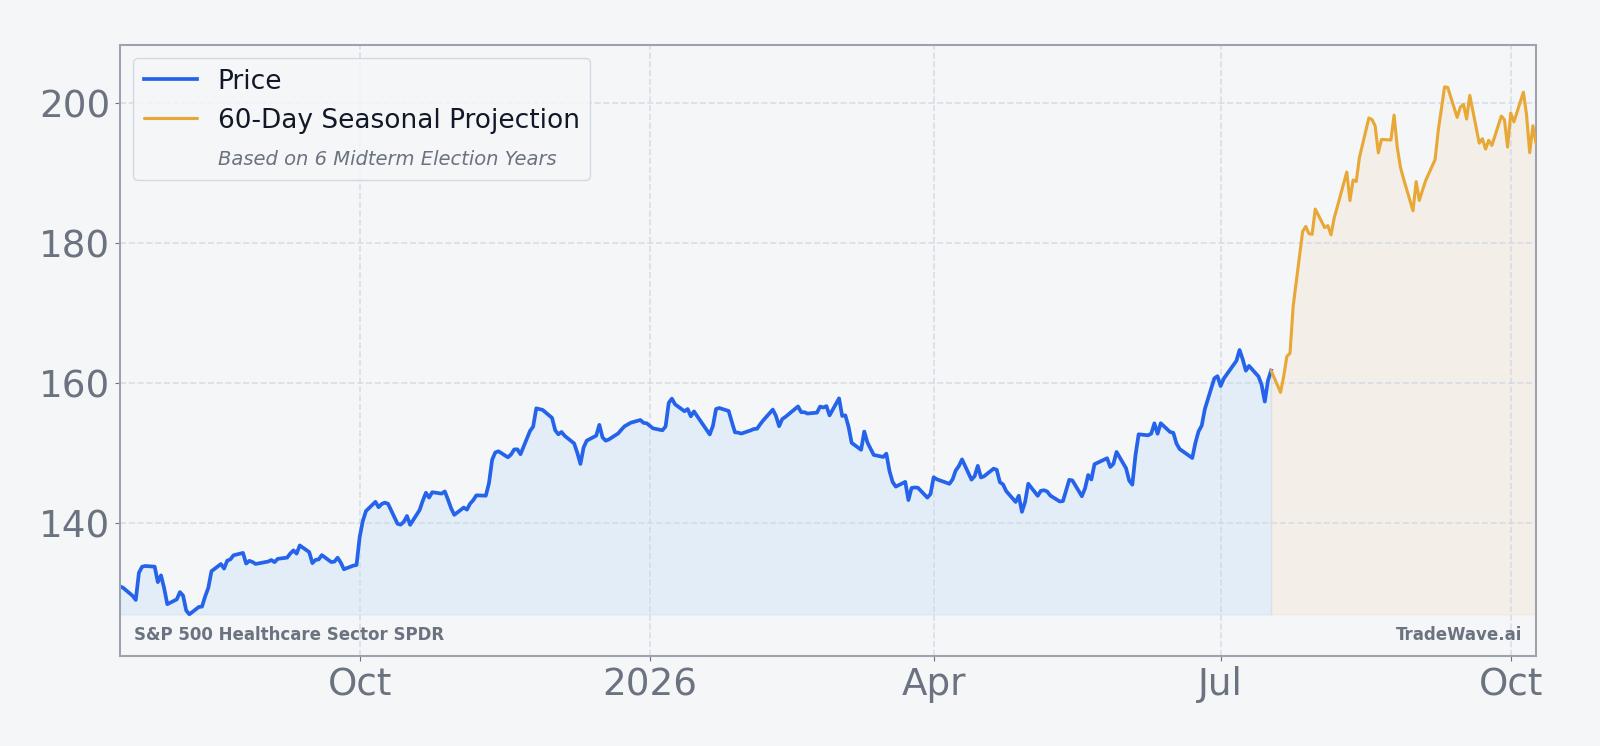
The chart below situates the latest move in its recent multi-month context, alongside a 60-day seasonal projection based on prior midterm-year behavior.
What should traders watch in this XLV seasonal window?
First, watch how XLV behaves on pullbacks inside this window. In prior midterm years, dips of 3% to 5% within the stretch have often been followed by renewed buying, but 2002 showed that drawdowns can briefly deepen into double digits before the pattern reasserts. Price action around the 50-day moving average, which recently sat near 152.08, will be a useful tell for whether buyers are still defending the trend.
Second, monitor options positioning. The early-June session that saw roughly $11 million of XLV options flow tied to calls signaled that traders were leaning into upside exposure.[1] If call buying and overall options volume continue to build as the window progresses, it would suggest that the seasonal bias is being reinforced by fresh capital; a sharp reversal toward put demand or collapsing volume would hint that the crowd is backing away from the trade.
Third, keep an eye on the policy and macro calendar into the heart of the midterm election year. Key healthcare policy headlines, reimbursement decisions and any surprise regulatory moves can all jolt the sector, especially when positioning is crowded. How XLV trades around those catalysts inside a historically strong seasonal window will tell investors whether this cycle is tracking the prior six or starting to break the pattern.
Sources
About this seasonal analysis
Seasonal pattern data is sourced from TradeWave.ai, which analyzes historical price behavior across annual calendar windows going back up to 30 years. Read the full data methodology or the book The 100-Year Pattern by Afshin Moshrefi (2026 edition). Past performance of seasonal patterns does not guarantee future results. This article is for informational purposes only and does not constitute investment advice.