6-for-6 Midterm Run: S&P 500 Technology Sector SPDR (XLK) Averages 19% Gains in This Window
S&P 500 Technology Sector SPDR is heading toward an August seasonal window that has delivered double-digit gains in every midterm election year in the last two decades, setting up a key test for tech’s next leg.

What is the seasonal pattern for S&P 500 Technology Sector SPDR (XLK)?
S&P 500 Technology Sector SPDR has risen in 6 of 6 midterm-election-year windows starting around Aug 15, with an average gain of 19.44% in winning years.
- 6-for-6 record in this window, with winning years averaging 19.44% gains for XLK.
- Seasonal window begins Aug 15 and runs 348 trading days, spanning late midterm year into the following pre-election year.
- Percent Profitable is 100%, with 6 winners and 0 losers across the last six midterm-election cycles.
- Average profit of 19.29% annualized and 188% cumulative return across the sample highlights a strong XLK seasonal trend.
- Maximum favorable moves have reached more than 30% in some years, while adverse excursions have stretched beyond 20% in others, underscoring meaningful volatility inside the S&P 500 Technology Sector SPDR trading window.
- Sharpe ratio of 2.45 and a TradeWave Ratio of 2.46 point to historically attractive risk-adjusted returns for long exposure during this tech-sector seasonal outlook.
According to historical data from TradeWave.ai, this upcoming stretch for XLK behaves very differently from an average year on the calendar. The next section walks through how that pattern has played out across past midterm-election cycles.
How has S&P 500 Technology Sector SPDR (XLK) traded in this midterm-year window?
S&P 500 Technology Sector SPDR has posted gains in every one of the last six midterm-election-year windows that begin around Aug 15 and run for 348 trading days, averaging 19.44% in winning years. With the ETF sitting between a recent pullback and a still-elevated 52-week range, that kind of historical seasonality gives tech bulls a defined calendar to watch. This combination of a clean 6-for-6 record and double-digit average gains turns what might look like a routine late-summer stretch into a statistically unusual regime for the sector.
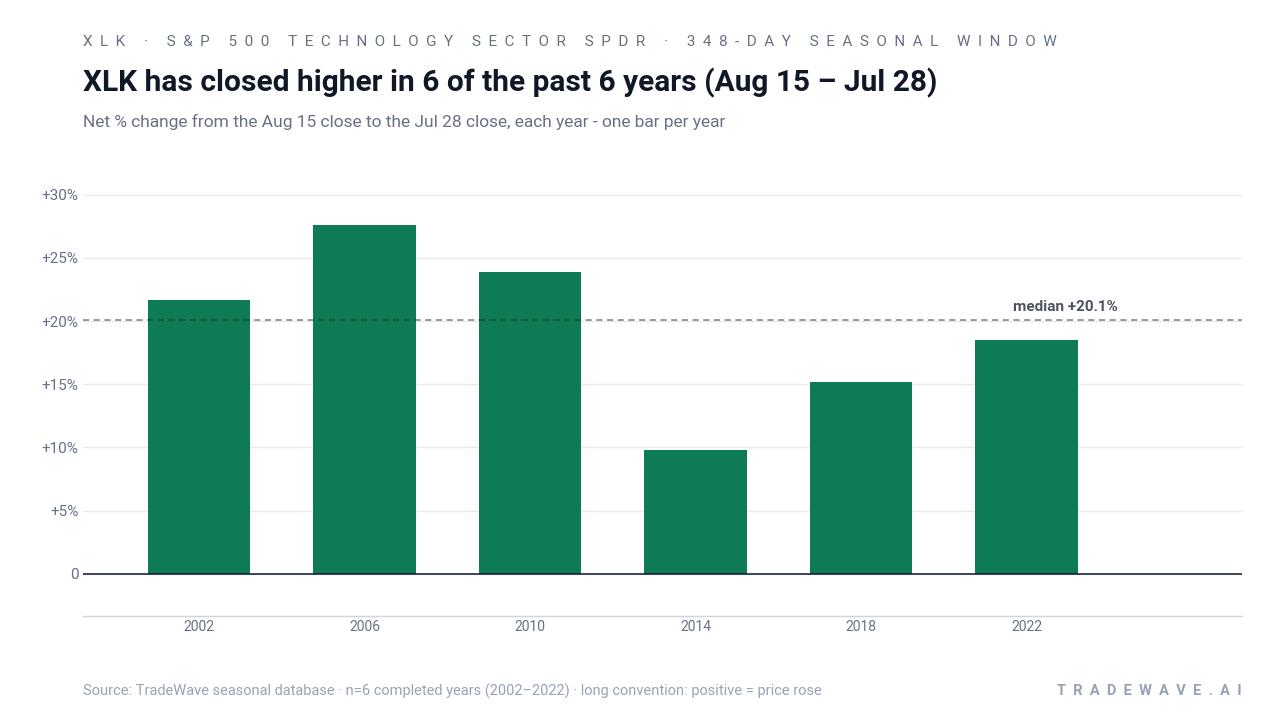
Because this pattern is grouped by the presidential election cycle, it only looks at midterm-election years and the 348 trading days that follow the Aug 15 start. That means the results aggregate across 2002, 2006, 2010, 2014, 2018 and 2022, all of which share a similar policy backdrop of mid-cycle fiscal debates, regulatory noise and positioning ahead of the stronger pre-election year. For XLK, that specific slice of the calendar has been unusually friendly to long exposure.
Across those six cycles, the ETF’s annualized return in the window clocks in at 19.29%, with a cumulative gain of 188%. Every single year finished positive, yet the path was not smooth. In 2006, XLK returned 27.57% between the Aug 15 entry and the end of the window, while 2014 was the softest outcome at 9.78%. The median profit of 20.12% shows that the typical midterm-year iteration has delivered something close to a one-fifth gain for the sector over this stretch.
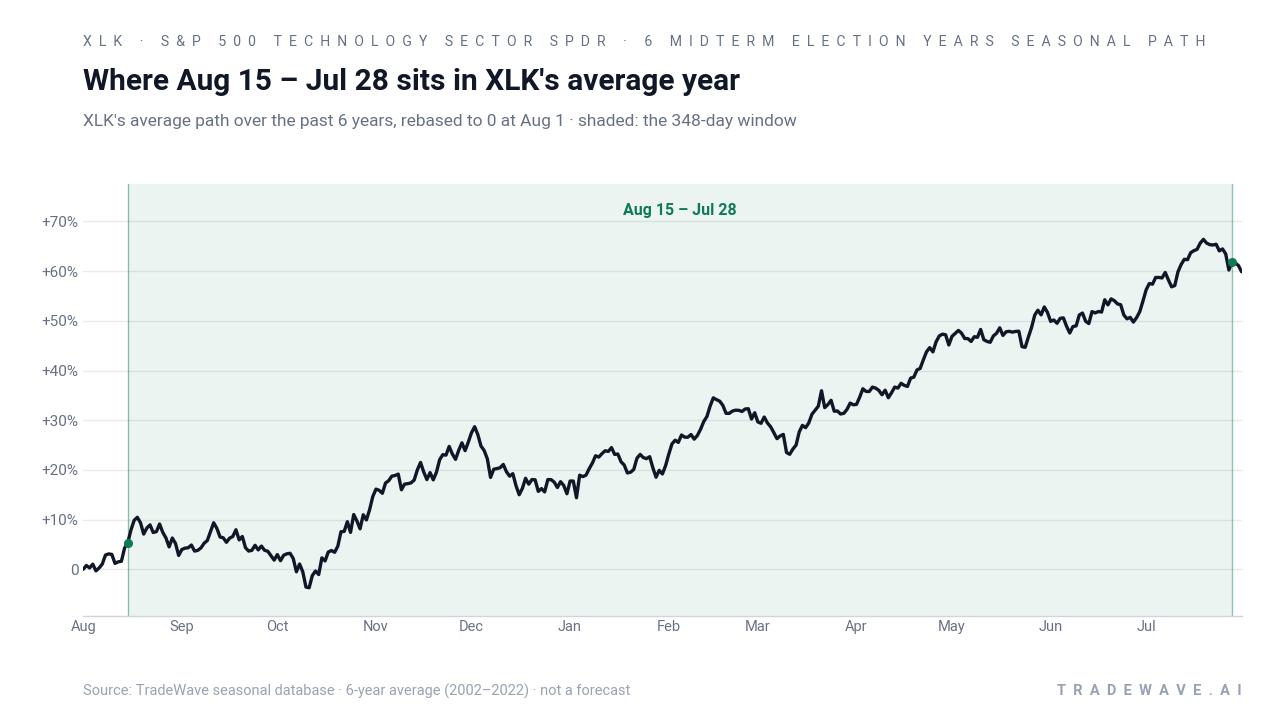
The historical seasonal average trend line slopes higher for most of the 348-day span, with gains tending to build as the window moves from late midterm year into the following pre-election year. That fits the broader pattern where risk assets often find a stronger footing once midterm political uncertainty clears and the policy calendar shifts toward pro-growth messaging ahead of the next presidential race. In the XLK seasonal trend, the climb is not a straight line, but the bias is clearly upward across the full regime.
Year-by-year bars that include both peak rallies and worst drawdowns show how much XLK has typically moved inside the window before settling at its final result.
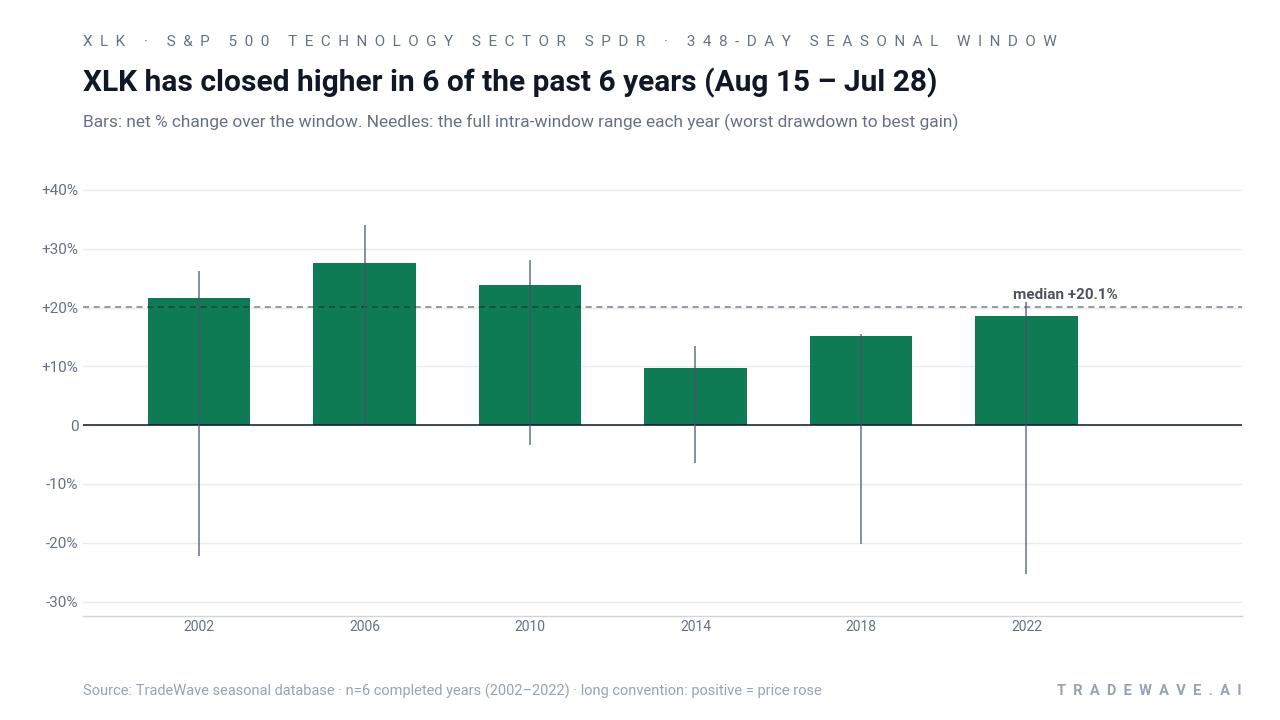
Maximum favorable excursions have been sizable: in 2006, XLK’s best intraperiod run-up reached 33.97%, while 2010 saw a 28.04% peak move. On the downside, maximum adverse excursions have at times been deep even in winning years, with drawdowns of -22.18% in 2002, -20.22% in 2018 and -25.28% in 2022 before the ETF recovered to finish higher. That mix of strong upside and meaningful interim stress is what the high TradeWave Ratio and Sharpe ratio are capturing: historically attractive returns, but with swings that can test conviction along the way.
Looking at individual years helps frame the range. The strongest net outcome in this sample came in 2006, when XLK gained 27.57% from entry to exit while never experiencing more than a 0.25% adverse move from the starting point. The most psychologically challenging year was 2022, which still finished up 18.54% but only after enduring a -25.28% drawdown at one point in the window. Add it up and you get a pattern that has rewarded patience but punished weak hands during volatility spikes.
History does not guarantee future results; adverse excursions can be large even in winning windows, and a 6-for-6 record does not mean the seventh iteration will automatically follow suit.
Why does S&P 500 Technology Sector SPDR (XLK) follow this seasonal pattern?
One likely driver is the way the tech sector’s earnings calendar and capital spending plans line up with the political cycle. Midterm years often bring regulatory noise and macro uncertainty early on, followed by clearer policy direction and a friendlier risk backdrop as the calendar rolls into the pre-election year. That shift tends to coincide with stronger enterprise IT budgets, renewed buyback activity and sector rotation back into growth, all of which can funnel into XLK during this specific window.
What is driving S&P 500 Technology Sector SPDR (XLK) today?
Into late July, XLK is digesting a one-month decline of 5.27% after a powerful run that pushed the ETF to a 52-week high of about 198.26, far above its 52-week low near 63.28. Average 20-day volume sits around 10.7 million shares, and the fund is trading close to its 50-day moving average of roughly 182.59, suggesting the recent pullback has been more of a consolidation than a full-blown trend change. With no single macro or policy headline dominating the tape, the near-term story is about whether buyers step back in ahead of the historically strong midterm-year window that opens in mid-August.
The chart below shows XLK’s past year of trading alongside a 60-day seasonal projection, highlighting how the current consolidation lines up with the historical pattern.
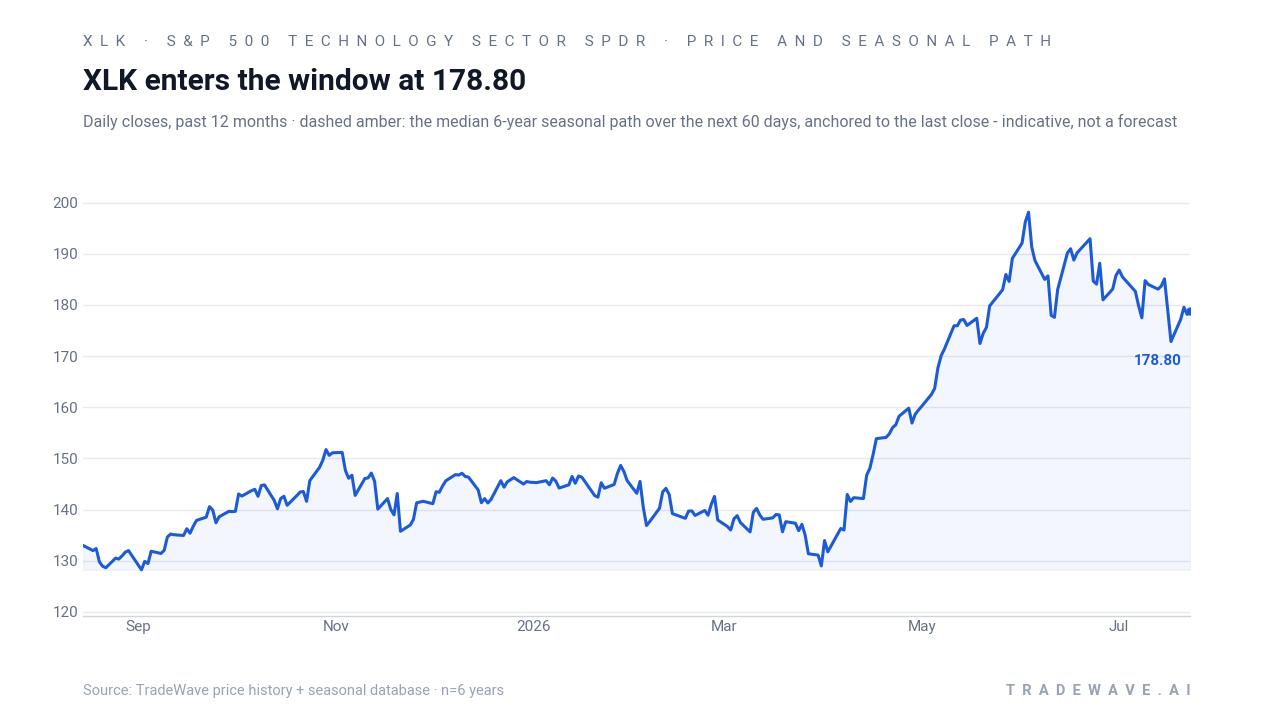
For traders, the key tension is straightforward. XLK remains a core proxy for mega-cap tech and the broader growth trade, yet it is heading into a calendar stretch that has historically delivered some of the sector’s strongest multi-quarter runs. If the ETF can hold above its recent lows and reclaim momentum into August, the historical seasonality argues that the next 9 to 12 months have often been a favorable backdrop for long tech exposure. If instead the current pullback deepens and breaks the pattern of prior cycles, that would be an early sign that this midterm-to-pre-election playbook may be changing.
What should traders watch as this XLK seasonal window approaches?
First, watch how XLK behaves as Aug 15 approaches: strength into the start of the window has often preceded some of the better historical outcomes, while deep pre-window weakness has tended to coincide with larger intraperiod drawdowns. Second, monitor the 50-day moving average and the zone around the recent one-month lows; holding that band would keep the longer-term uptrend intact as the seasonal tailwind kicks in. Third, keep an eye on macro and policy catalysts that matter most for tech, from rate expectations to regulatory headlines, since the historical pattern is built on midterm-year environments where those forces eventually turned more supportive. Finally, track whether volatility inside the window resembles prior cycles, with sharp but ultimately recoverable drawdowns, or whether a break from that script signals that this time really is different.
Sources
About this seasonal analysis
Seasonal pattern data is sourced from TradeWave.ai, which analyzes historical price behavior across annual calendar windows going back up to 30 years. Read the full data methodology or the book The 100-Year Pattern by Afshin Moshrefi (2026 edition). Past performance of seasonal patterns does not guarantee future results. This article is for informational purposes only and does not constitute investment advice.