This Midterm-Year Stretch Has Delivered 250% Cumulative Gains for Nasdaq QQQ Invesco ETF (QQQ)
Nasdaq QQQ Invesco ETF is approaching a midterm-year seasonal window that has never posted a loss in this dataset, just as tech leadership and election-cycle positioning converge again.

What is the seasonal pattern for Nasdaq QQQ Invesco ETF (QQQ)?
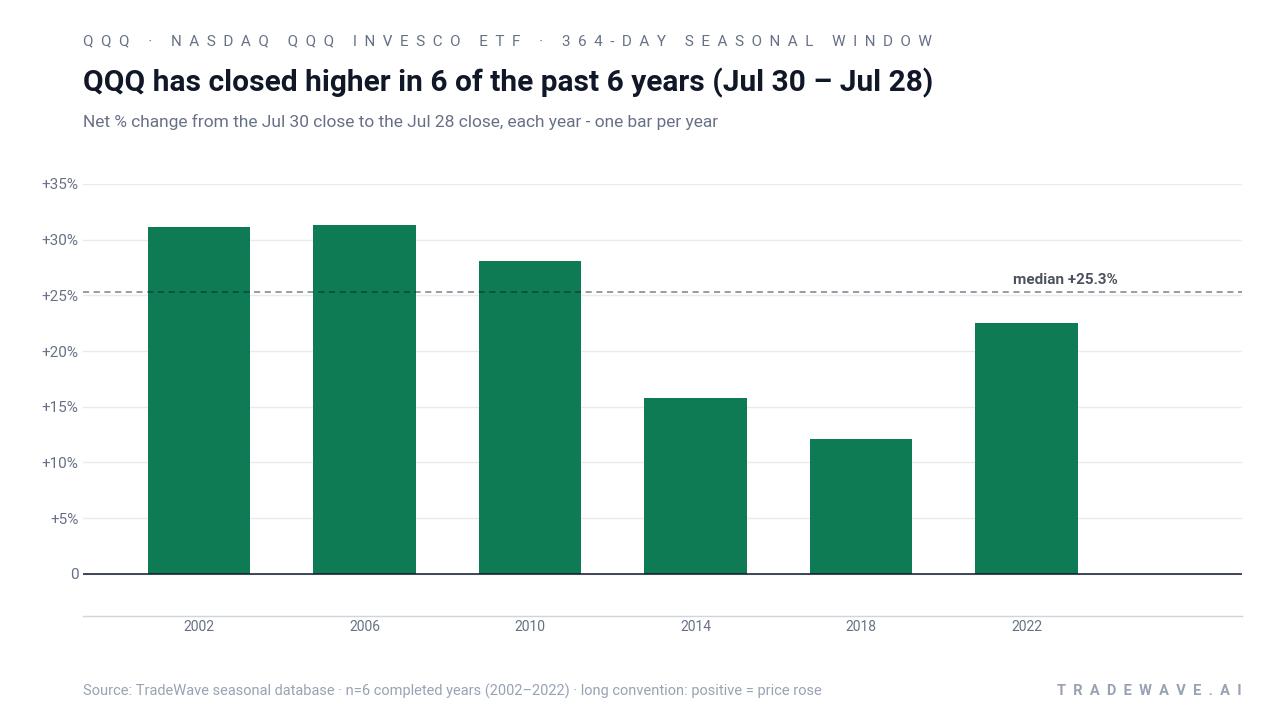
Nasdaq QQQ Invesco ETF has risen in 6 of 6 midterm-election-year windows starting around Jul 30, with an average gain of 23.49% in winning years.
- 6 for 6 in this window, with average winning-year gains of 23.49% across the last six midterm election years.
- The upcoming window begins Jul 30, 2026 and spans 364 days, covering the late midterm year into the heart of the year before the presidential election.
- Percent Profitable is 100%, with 6 winners and 0 losers in this Nasdaq QQQ Invesco ETF trading window.
- Average profit of 23.49% reflects strong tech-led performance, with a cumulative return of 250% across all six historical windows.
- Intraperiod swings have been meaningful, with individual years showing adverse moves of up to nearly 19% before finishing higher.
- The pattern aligns with a well-known election-cycle tendency for risk assets to strengthen from late midterm year into the pre-election year.
According to historical data from TradeWave.ai, this midterm-year stretch has behaved very differently from an average calendar year for QQQ, and the next iteration of that pattern is about to start.
How strong is the upcoming seasonal window for Nasdaq QQQ Invesco ETF (QQQ)?
Nasdaq QQQ Invesco ETF has risen in all 6 of the last midterm-election-year windows that start around Jul 30, averaging 23.49% gains over each 364-day stretch. The next window begins on Jul 30, 2026, with QQQ trading in the upper half of its 52-week range and roughly 27.0% above its 52-week low of 546.40 while sitting about 4.0% below its 52-week high of 747.00. That combination of a strong historical seasonal trend and a market still shy of its highs is why this window is on traders’ radar.
Grouping the data by the presidential election cycle matters here because this window runs from late in the midterm election year into the year before the presidential election, a phase that has often coincided with friendlier policy tone, clearer fiscal paths and a bias toward risk-taking in growth and tech. In this sample, the pattern phase is defined as the last six midterm election years, so each observation lines up with the same point in the four-year political calendar rather than with arbitrary calendar years.
Across those six midterm-year windows, the trade direction is long, and every single instance finished positive. Percent Profitable is 100%, with 6 winners and 0 losers, and the cumulative return across all six windows is 250%. Average profit of 23.49% per window sits close to the median outcome of 25.27%, which suggests the gains have been relatively clustered rather than driven by a single outlier year.
The per-year table shows how that plays out in individual cycles. The strongest net return came in 2006, when QQQ gained 31.28% from entry to exit, with a maximum favorable move of 36.99% during the window. The softest outcome was 2018, which still delivered a 12.11% net gain despite a maximum adverse move of -17.69% at one point, underscoring that even “good” years for this pattern can feel rough in real time.
Intraperiod swings have been meaningful. In 2002, QQQ’s best run-up within the window reached 34.72%, but the ETF also suffered a worst drawdown of -18.72% before finishing the year up 31.18%. In 2022, the maximum favorable excursion was 23.94% against a maximum adverse move of -19.21%, again ending with a 22.5% net gain. That mix of strong upside and double-digit downside at different points in the window is typical of a high-beta tech vehicle like QQQ.
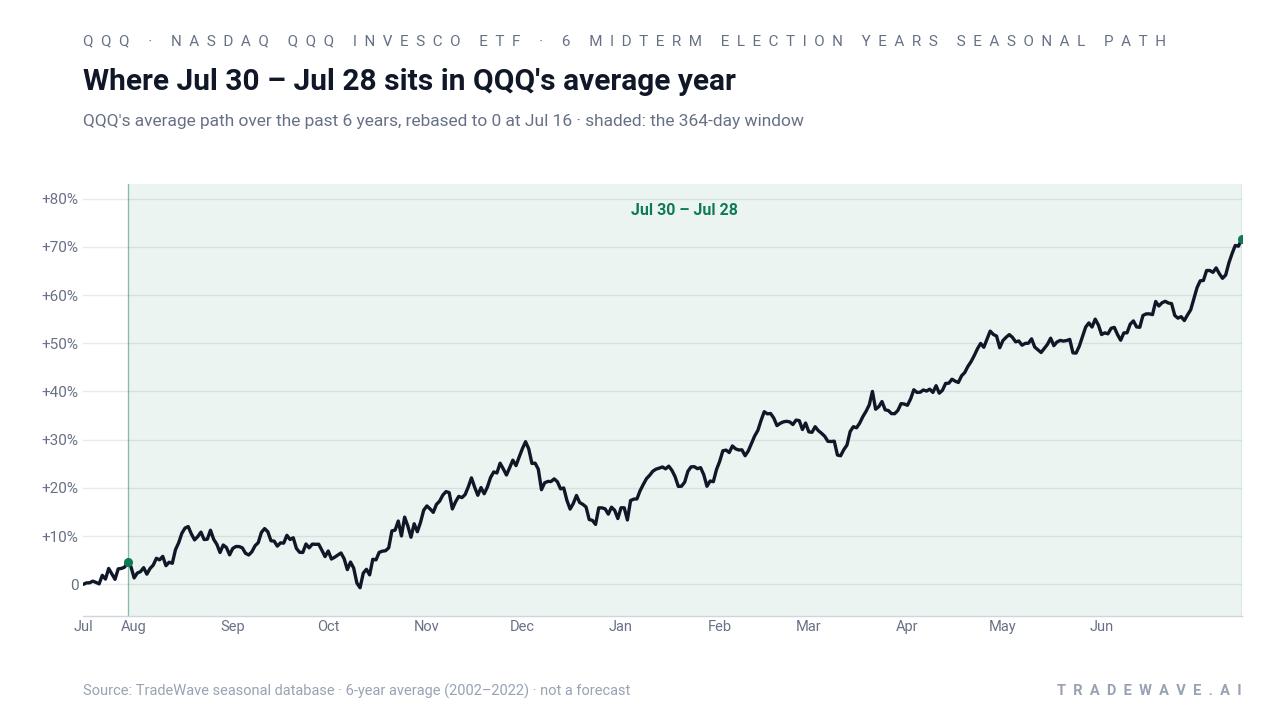
The historical seasonal trend chart shows a fairly steady upward slope rather than a single explosive burst. Gains tend to build over the full 364-day span, with some acceleration visible in the back half of the window as the calendar transitions into the year before the presidential election, a phase that has often been supportive for growth stocks.
Year-by-year bars that include both peak run-ups and worst drawdowns help clarify how much volatility has accompanied those gains.
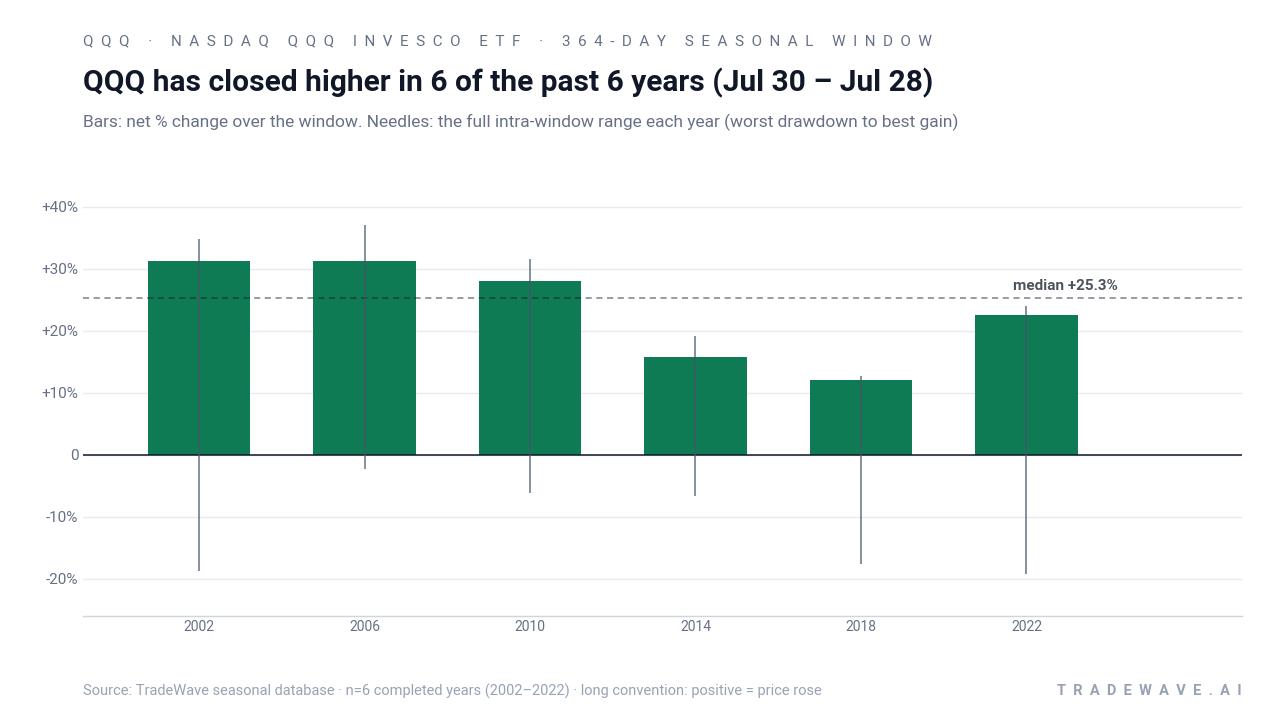
The combined net/MFE/MAE bars show that in every year, QQQ has carved out sizable upside moves in the trade direction while also experiencing notable drawdowns along the way. In several cycles, the worst adverse move approached or exceeded -17%, even though the final result was positive, which is consistent with a TradeWave Ratio of 2.36 and a Sharpe ratio of 2.4 for this setup.
History does not guarantee future results; adverse excursions can be large even in winning windows, and traders can experience significant drawdowns before any seasonal edge plays out.
Why does Nasdaq QQQ Invesco ETF (QQQ) follow this seasonal pattern?
One likely driver is the way the tech-heavy Nasdaq complex lines up with the election calendar, as policy uncertainty often peaks earlier in the midterm year and then fades as the market looks ahead to the year before the presidential election. Analysts have also pointed to institutional portfolio rebalancing and renewed risk appetite in growth sectors once midterm results are known and fiscal and regulatory paths look clearer. This pattern may also reflect the clustering of major tech product cycles and capital spending plans that tend to ramp into the pre-election year, supporting earnings expectations for QQQ’s largest holdings.
What is driving Nasdaq QQQ Invesco ETF (QQQ) today?
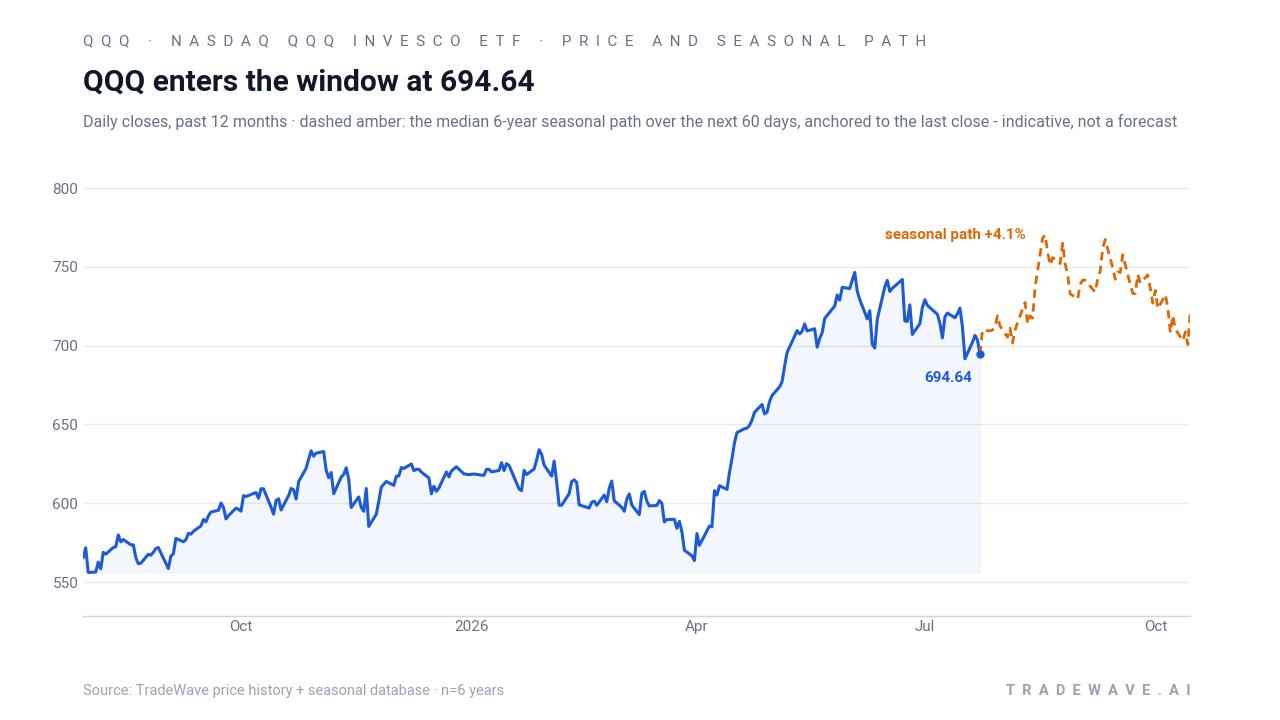
QQQ is trading near the upper half of its 52-week range, roughly 27.0% above its 52-week low of 546.40 and about 4.0% below its 52-week high of 747.00, after a modest -3.55% pullback over the past month. Recent MarketBeat pages that display intraday QQQ values in their headers underscore how closely the ETF is watched as a real-time proxy for US large-cap growth sentiment, even when the underlying articles focus on single-stock news rather than the index itself.[1]
The chart below situates the latest move in its recent multi-month context and overlays a short seasonal projection.
What should traders watch as this QQQ seasonal window opens?
First, the calendar. The new 364-day window starts on Jul 30, 2026 and runs deep into the year before the presidential election, a phase that has historically been friendlier for risk assets than the early midterm year. How QQQ behaves in the first 60 to 90 days of this stretch will be an early tell on whether the historical pattern is repeating or fading.
Second, levels. With the ETF sitting a few percent below its 52-week high and well above its 50-day moving average of 718.02, traders will be watching whether QQQ can sustain breakouts to fresh highs without giving back double-digit drawdowns that have been common inside this window in prior cycles. A move that quickly revisits the 52-week high while keeping pullbacks shallower than the historical -18% to -19% worst cases would mark a cleaner version of the pattern than some past years.
Third, macro and policy catalysts. As the midterm election year progresses toward its back half, the policy calendar typically shifts from legislative uncertainty toward positioning for the presidential race, which can influence sector rotation and appetite for high-duration growth exposure. If that backdrop again lines up with stronger earnings breadth in large-cap tech, it would be consistent with the prior six midterm-year windows that all finished higher for QQQ.
Finally, volatility inside the window. The historical record shows that even “all green” seasonal patterns can involve sharp swings, with maximum adverse moves approaching -20% in some years before the ETF recovered. Traders watching this window will be focused not just on whether QQQ ends the period higher, but on how deep any interim drawdowns run relative to those historical MAE levels and whether intraperiod rallies resemble the 30% plus maximum favorable excursions seen in stronger cycles.
Sources
About this seasonal analysis
Seasonal pattern data is sourced from TradeWave.ai, which analyzes historical price behavior across annual calendar windows going back up to 30 years. Read the full data methodology or the book The 100-Year Pattern by Afshin Moshrefi (2026 edition). Past performance of seasonal patterns does not guarantee future results. This article is for informational purposes only and does not constitute investment advice.