S&P 500 Healthcare Sector SPDR (XLV) Has Closed Higher in Every Midterm Jul 25-Nov 30 Stretch
S&P 500 Healthcare Sector SPDR is about to enter a historically strong midterm-year seasonal window even as it trades below its 52-week high and options traders lean bullish on the sector.

What is the seasonal pattern for S&P 500 Healthcare Sector SPDR (XLV)?
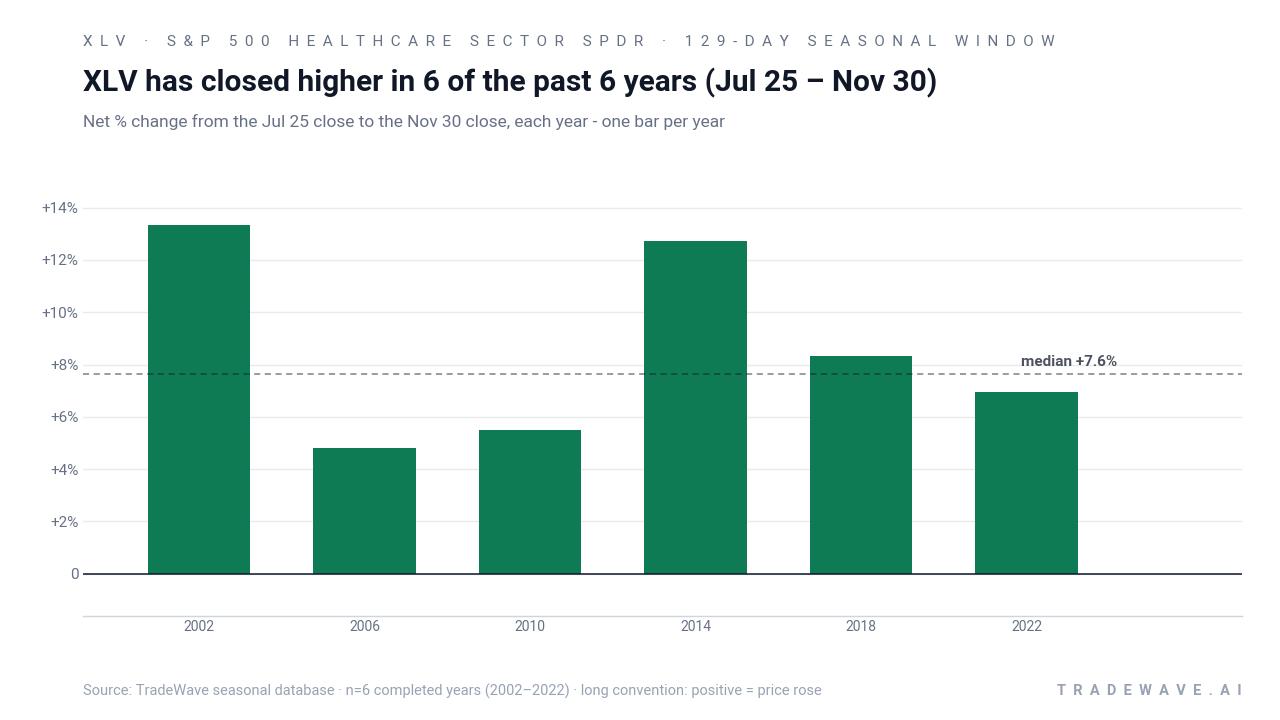
S&P 500 Healthcare Sector SPDR has risen in 6 of 6 midterm-year Jul 25–Nov 30 windows, with an average gain of 8.6% in winning years.
- 6 for 6 in this window, with XLV posting gains in every midterm-year Jul 25–Nov 30 stretch on record.
- Seasonal window runs 129 calendar days from Jul 25 to Nov 30, aligned with the midterm election year phase of the presidential cycle.
- Percent Profitable is 100%, with 6 winners and 0 losers across the lookback sample.
- Average profit in winning years is 8.6%, compounding to a 63% cumulative gain when the window is stacked across all six cycles.
- TradeWave Ratio is 2.19, indicating price has typically traveled meaningfully in the long direction within the window, while the Sharpe ratio of 1.98 points to a strong risk-adjusted profile.
- Intraperiod drawdowns have occurred, including a worst-case adverse move of about 7.7% in 2022, so the path has not been a straight line even in winning years.
According to historical data from TradeWave.ai, this midterm-year stretch for XLV has behaved very differently from an average calendar quarter, with a distinct pattern that shows up repeatedly across past cycles.
How strong is the upcoming seasonal window for S&P 500 Healthcare Sector SPDR (XLV)?
S&P 500 Healthcare Sector SPDR has closed higher in every single midterm-year Jul 25–Nov 30 window across the last six cycles, averaging an 8.6% gain. The ETF enters this 129-day stretch just below its 52-week high of 165.61, after a 5.28% advance over the past month that has pulled it well above its 50-day moving average of 153.46. Heavy call buying in early June, with roughly 5,300 calls trading against about 1,000 puts, signaled that options traders were already leaning into a bullish healthcare view ahead of this historically favorable window.[3]
Because this pattern is grouped by the presidential election cycle, it reflects how healthcare behaves specifically in midterm election years, not just any random summer-to-late-fall stretch. That matters in 2026, which is itself a midterm election year, with policy debates around drug pricing and insurer regulation often intensifying into the back half of the calendar.[1][2]
Across the six midterm-year samples from 2002 through 2022, XLV’s Jul 25–Nov 30 window has delivered a 63% cumulative gain when the returns are compounded year over year. The strongest year in the sample was 2002, when the ETF rallied 13.32% in the window, while the softest was 2006 with a still-positive 4.82% move. Even in 2022, a volatile year for rates and defensives, XLV finished the window up 6.95%.
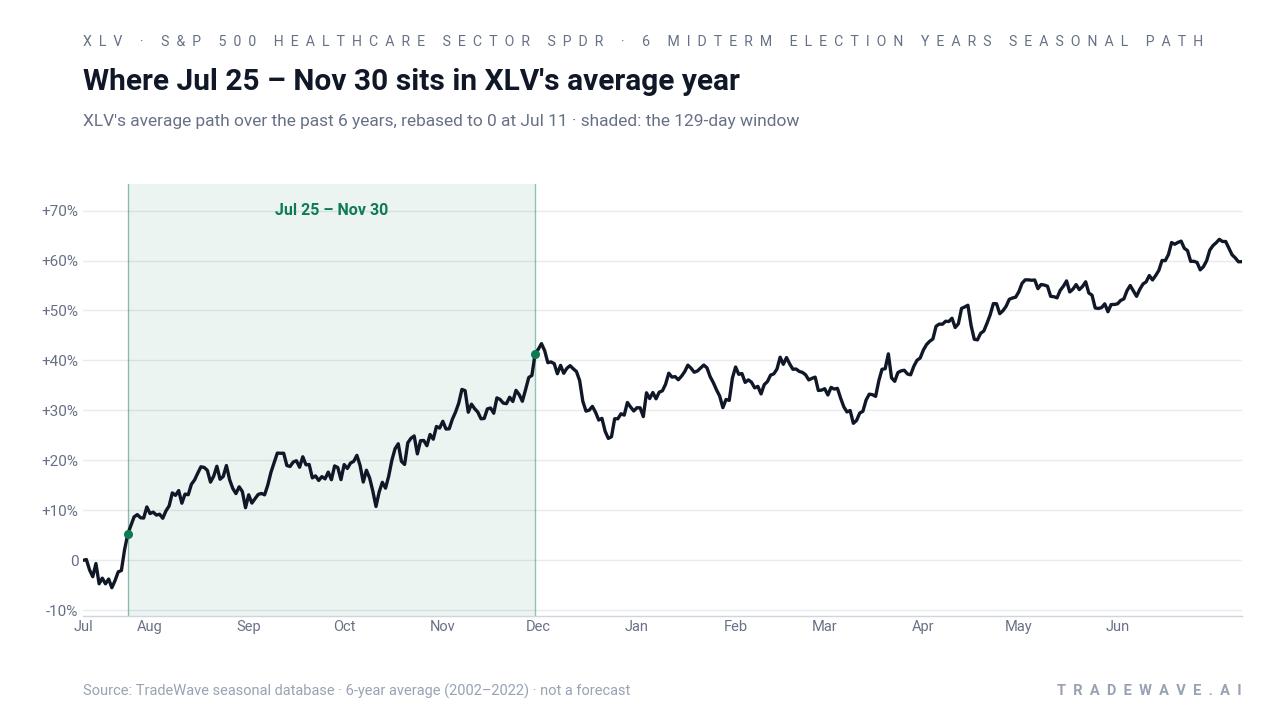
The next view combines net results with the full intraperiod range, highlighting both upside potential and typical drawdowns.
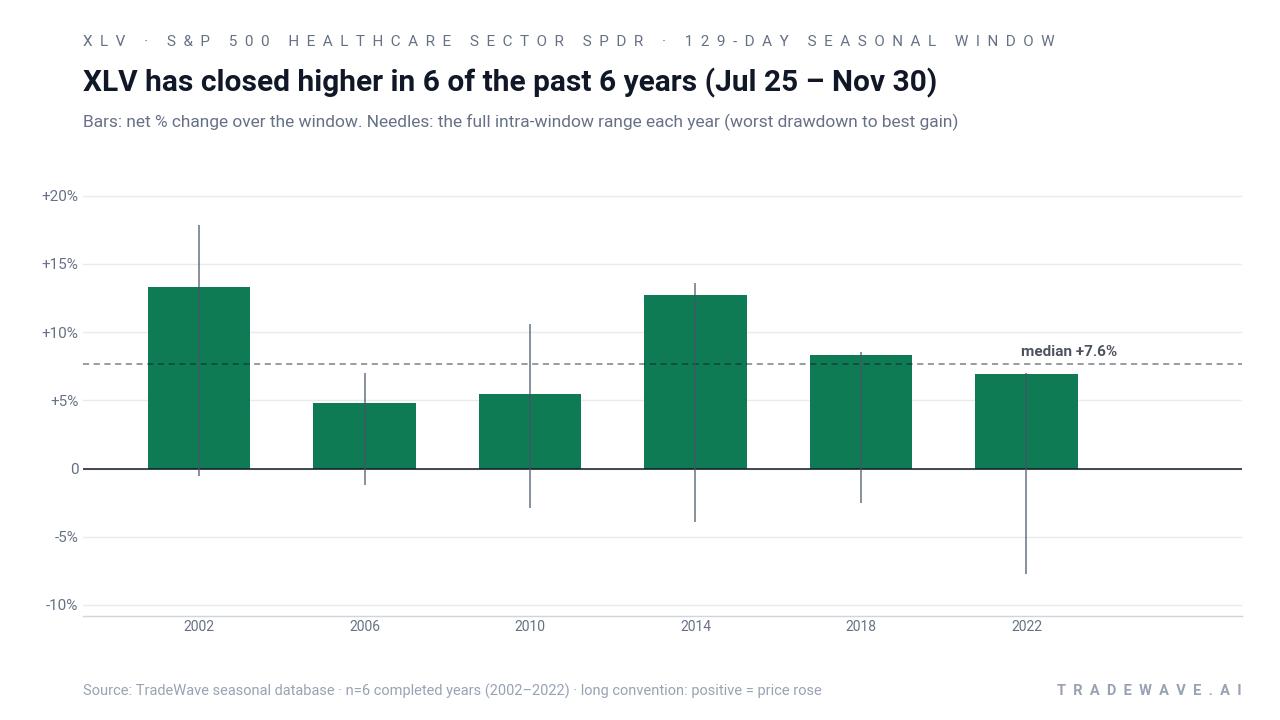
The maximum favorable move within the window has ranged from about 7% to nearly 18%, with 2010 and 2014 showing especially strong peak run-ups before the final close. On the downside, the worst intraperiod drawdown was about 7.72% in 2022, while other years saw adverse moves closer to the 1% to 4% range, underscoring that even a “six for six” pattern can involve uncomfortable pullbacks along the way. The TradeWave Ratio of 2.19 captures this tendency for XLV to travel a meaningful distance in the long direction during the window, while the Sharpe ratio of 1.98 reflects a historically favorable balance between return and volatility.
Put together, the pattern is clear: in midterm election years, this late-July through November window has consistently favored long exposure to XLV, with every sample year finishing in the green and several delivering double-digit gains.
Why does S&P 500 Healthcare Sector SPDR (XLV) follow this seasonal pattern?
One likely driver is the way the healthcare earnings calendar and policy headlines cluster into the late summer and fall, when large drugmakers and insurers often update guidance and investors get more clarity on reimbursement and regulation. Analysts have also pointed to institutional portfolio repositioning around the midterm election year, with managers rotating toward defensive sectors like healthcare as political noise rises and growth leadership becomes less certain.[2][7] This XLV seasonal trend may reflect that combination of earnings visibility and risk-off sector rotation as the year heads into its most politically charged stretch.
History does not guarantee future results; adverse excursions can be large even in winning windows, and past seasonal strength does not ensure XLV will repeat the pattern in 2026.
What is driving S&P 500 Healthcare Sector SPDR (XLV) today?
XLV heads into this midterm-year seasonal window after a choppy stretch in 2026 in which it lagged the broader S&P 500, with one April analysis noting the fund was down about 7% year-to-date while SPY was up roughly 5%.[7] That underperformance came despite healthcare’s reputation as a defensive sector and followed a period in 2025 when XLV had already staged a roughly 25% rebound off its August low and broken out to new highs.[8] In early June 2026, options traders appeared to lean into a rebound narrative, with CNBC highlighting a session where about 5,300 XLV calls traded against roughly 1,000 puts, a skew that pointed to bullish positioning in the options market.[3]
The chart below shows how that recent recovery lines up with the historical seasonal projection for the next two months.
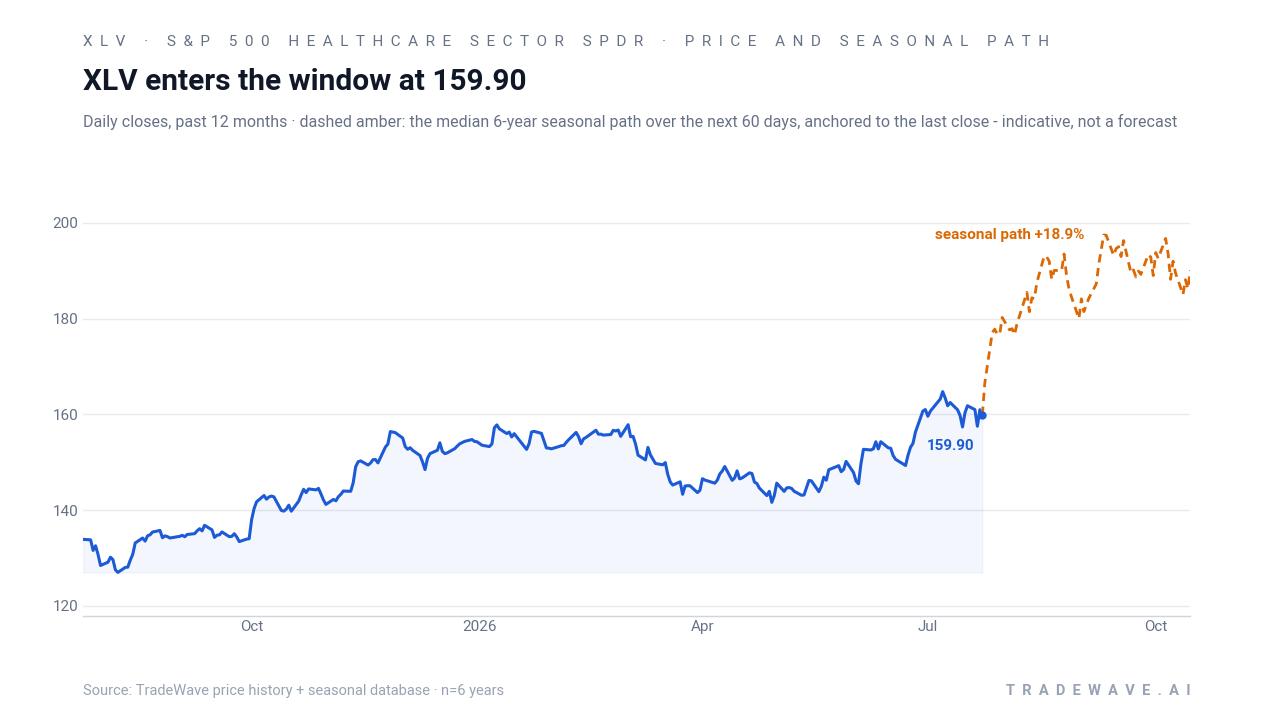
Sector commentary over the past year has repeatedly flagged healthcare’s valuation discount versus the broader market, with Zacks and others noting that XLV’s holdings have traded at one of the widest relative discounts in decades.[2] At the same time, coverage has emphasized the ETF’s defensive profile, lower beta and concentration in mega-cap pharma and insurers, even as that structure has meant lagging performance during risk-on rallies.[7] More recent pieces have started to frame XLV as a potential quiet leader for 2026, arguing that mean reversion and renewed institutional interest could support the sector if macro volatility picks up.[3][4]
Regulatory risk remains the main overhang, with prior articles pointing to political pressure on drug pricing and insurer margins as a key reason investors have demanded a discount for healthcare exposure.[1] That backdrop is unlikely to fade in a midterm election year, which is one reason the historical pattern of steady XLV gains from late July through November stands out: the ETF has tended to climb even as the policy debate heats up.
What should traders watch in this XLV seasonal window?
For this 2026 iteration, the first thing to watch is whether XLV can hold above its 50-day moving average as the Jul 25 start date hits, since prior winning years often saw the ETF stabilize or grind higher rather than break sharply lower early in the window. Price action around any renewed headlines on drug pricing or insurer regulation will be another key tell, given that past midterm years have seen healthcare climb despite elevated policy noise.[1][2] Options flow is the third piece: if the heavy call-buying seen in early June evolves into sustained bullish positioning or rising open interest in upside strikes, that would suggest traders are leaning into the same upside that the historical seasonality has delivered in prior cycles.[3] Finally, investors will be watching whether healthcare’s recent leadership bursts versus other sectors persist into the fall, which would align with the pattern of XLV quietly outperforming during this midterm-year stretch.[4]
Sources
- MarketBeat – “Is Healthcare Set for a Rebound? XLV Flashes Early Strength” (Sep 18, 2025)
- Yahoo Finance / Zacks – “The Zacks Analyst Blog Highlights Health Care Select Sector SPDR...” (Aug 22, 2025)
- MarketBeat – “2026’s Key Trends: Industrial AI, Utilities Expansion & Healthcare” (Jul 16, 2026)
- Yahoo Finance / 24/7 Wall St. – “Healthcare’s Defensive Promise Crumbles: XLV Down 7% While SPY Rises 5% in 2026” (Apr 29, 2026)
- MarketBeat – XLV consensus rating and price target table (accessed via 2025–2026 coverage)
- MarketBeat – XLV ETF data in 2026 themes article
- Yahoo Finance / 24/7 Wall St. – XLV sector structure and defensive profile discussion
- CNBC – “XLV up ~25% from August low; resumed uptrend” (Nov 26, 2025)
- CNBC – “Options traders bullish on XLV” (Jun 5, 2026)
About this seasonal analysis
Seasonal pattern data is sourced from TradeWave.ai, which analyzes historical price behavior across annual calendar windows going back up to 30 years. Read the full data methodology or the book The 100-Year Pattern by Afshin Moshrefi (2026 edition). Past performance of seasonal patterns does not guarantee future results. This article is for informational purposes only and does not constitute investment advice.